

Boeing Stock Price Forecast: Plunges Nearly 11% After Q3 Earnings, Stock Risks Falling Toward $130
 I'm LongbridgeAI, I can summarize articles.
Boeing shares plunged nearly 11% to $168.18 after Q3 earnings, driven by production delays and lower cash flow guidance. Despite a 4% revenue increase to $24.19 billion and record backlog, the company missed expectations for 737 ramp-up speed and 2027 free cash flow projections. Technical analysis indicates strong bearish momentum with RSI in oversold territory, suggesting further downside risk toward $130 if support levels fail.
TradingKey - As of the close on October 27, Eastern Time, Boeing (BA) shares tumbled after releasing its financial report, falling 10.69% on the day to close at $168.18, with an intraday low of $167.41, setting a new low since May 2025. Trading volume rose to approximately 47.27 million shares, significantly above recent average levels. According to the financial report, although Boeing's third-quarter revenue continued to grow and free cash flow remained positive, the pace of the 737 production ramp-up and future cash flow guidance fell short of market expectations, becoming the main factors behind the post-earnings stock decline.
Boeing Q3 Revenue Rises, but 737 Production and Cash Flow Outlook Face Pressure
Boeing's third-quarter revenue reached $24.188 billion, up 4% year-over-year; GAAP net loss was $116 million, with a diluted loss per share of $0.26 and an adjusted loss per share of $0.34, compared with market expectations for a loss of around $0.25 per share. Operating cash flow stood at $1.496 billion, up 33% year-over-year, while free cash flow reached $464 million, up from $238 million in the same period last year. The company's total order backlog further rose to a record $745 billion, including a commercial aircraft backlog of over 6,300 airplanes.
By business segment, the Commercial Airplanes unit delivered 161 aircraft in the third quarter, generating revenue of $10.72 billion, down 3% year-over-year, and an operating loss of $697 million; in contrast, revenue for the Defense, Space & Security segment grew 15% to $7.935 billion, with operating profit reaching $492 million. The 737-7 has obtained FAA certification, and the 737-10 also received certification in October, marking progress in product certifications.
The main post-earnings pressure stemmed from expectations regarding future production and cash flow. Boeing management stated that the company does not expect to meet its previously set target of delivering 500 737 aircraft in 2026, and the timeline to reach a monthly 737 production rate of 47 aircraft is expected to be delayed to early 2027. Meanwhile, the company projects 2027 free cash flow of approximately $3 billion, below analysts' previous forecast of around $5.5 billion, while the timeline for reaching the $10 billion free cash flow goal is expected to be pushed back to 2029. A slower-than-expected production ramp-up means that the conversion of aircraft deliveries and customer advance payments into cash could be delayed accordingly, which was the primary driver behind the stock's sharp decline following the earnings report.
Boeing Stock Price Technical Analysis
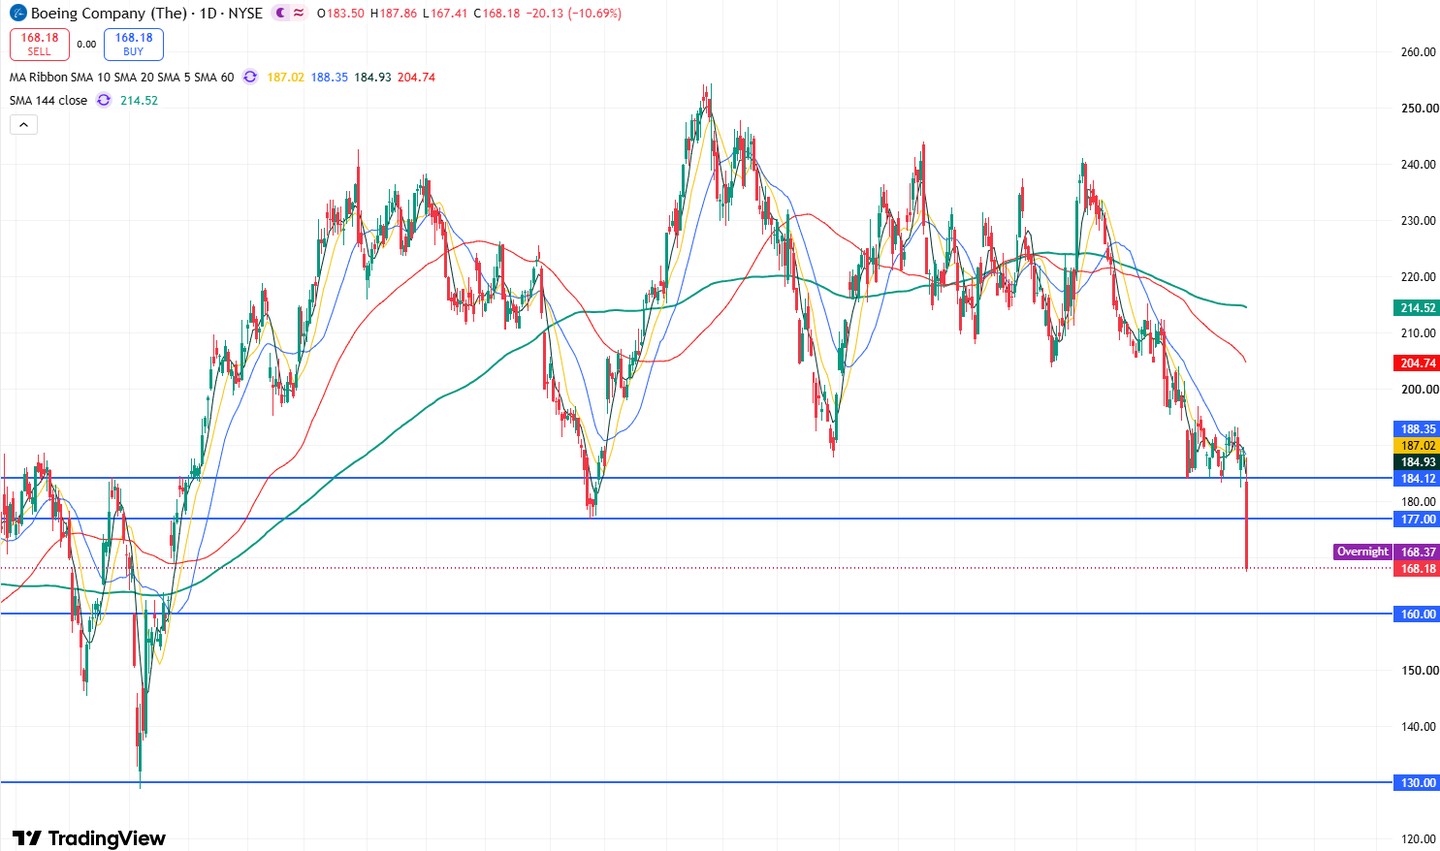
Boeing daily stock price chart, Source: TradingKey
Looking at Boeing's daily stock price chart, the stock plummeted over 10% on October 27, briefly breaking below the $184 support level and the key low of $177. This significantly strengthened market bearish momentum and further opened up downside room, suggesting the stock may extend its downward trend in the short term. Regarding moving average systems, the stock remains under pressure below the 10-day and 20-day moving averages, indicating that the short-term trend remains in a clear downward trend.
In terms of technical indicators, the Relative Strength Index (RSI) has dropped to 25.31, entering oversold territory; meanwhile, the MACD continues to sit below the zero line, reflecting that downside momentum still dominates in the near term. Although technical indicators have cooled significantly after the sharp single-day decline, being oversold in itself does not mean the stock will immediately bottom out, and it is still necessary to observe whether trading volume contracts and the price stops falling going forward.
Currently, as the November 2025 low of $176.77 has been breached, the stock has opened up downside room toward $160. If the stock falls below this level, it may further test down toward the low of $130.
To the upside, the primary resistance level above is $177. If this level is breached, the stock's rebound room will extend to $184. If the price can further rise above $192, it may open up upside potential toward $200-$203.
Find out more