

S&P 500 Faces Double Top Risk as Rate Hike Bets Build and AI Fears Spread
 I'm LongbridgeAI. Here is the key information I extracted
The S&P 500 Index and its top ETFs, including SPY, VOO, and IVV, have recently dropped sharply as risks have spread. They are down 5.8% from their highs this year, and the decline may continue as a double-top pattern forms, AI bubble fears grow, and Federal Reserve rate-hike odds jump.
Fed Rate Hike Odds are Rising After US Jobs Data
The S&P 500 Index may be at risk of further downward as risks rise. One of the risks is that the Federal Reserve will hike interest rates in its December meeting. These risks rose after the US published strong nonfarm payrolls (NFP) data.
The report showed that the unemployment rate dropped to 4.1% as the economy added 165,000 jobs, well above the 65,000 created a month earlier. Wage growth of 3.1% also came in above the expected 2.9%.
These numbers led to a surge in rate-hike odds, since inflation remains well above the Federal Reserve’s 2.0% target. The stock market tends to underperform when the Fed is hiking interest rates.
Read Also: Man Secretly Pays Brother’s $47K Debt. Brother Then Tries Charging Sister $200 For Advice, Crediting His 'Financial Discipline'
The stock market is also confronting growing concerns about an artificial intelligence (AI) bubble. Some prominent investors, including Ken Griffin and Ray Dalio, have warned that the bubble may burst soon as interest rates continue to rise.
Indeed, a closer look at the index’s biggest laggards shows companies such as Seagate Technology, Coherent, Intel, Western Digital, and Applied Materials.
The S&P 500 Index has also wavered as the earnings season has continued. FactSet (NYSE:FDS) data shows that 84% of companies in the index have published their earnings. Of these companies, the blended earnings growth is 31.4%, slightly higher than the expected 29%. Still, the growth is much lower than the second quarter’s growth of over 50%.
S&P 500 Index Has Formed a Double-Top Pattern
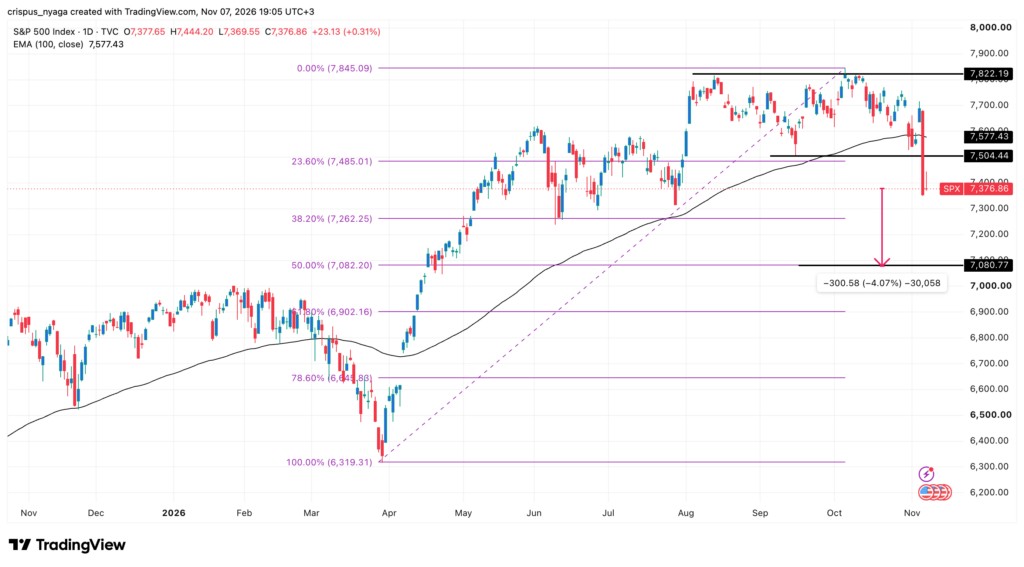
The daily chart shows that the SPX Index has slumped in the past few weeks. A key risk is that it has formed a double-top pattern at 7,822 and a neckline of 7,504. The neckline coincided with the 23.6% Fibonacci Retracement level.
The index has slumped below the 50-day and 100-day Exponential Moving Averages (EMA). At the same time, the Relative Strength Index (RSI) and the MACD indicators have continued to fall.
Therefore, the index will likely continue falling, potentially to the 50% retracement level of 7,080, down by 4% from the current level.
Read Also: Nu Holdings Stock Plunged After Lula Win: UBS and JPMorgan See Opportunity
Image: Shutterstock
Login to unlock1,666characters for free
Due to copyright restrictions, please log in to your Longbridge account to view this content.
Thank you for your understanding and support of licensed content.