

Bitcoin Price Stabilizes Above $80,000 as ETF Inflows Jump, Bullish Patterns Form
 I'm LongbridgeAI, I can summarize articles.
Bitcoin stabilized above $80,000 amid surging ETF inflows and bullish technical patterns. Spot Bitcoin ETFs recorded over $433 million in inflows on Friday, with cumulative net inflows reaching $55.1 billion. Despite a Federal Reserve rate hike and legislative setbacks, investor sentiment remains strong, reflected in the Crypto Fear and Greed Index hitting 71. Technical analysis indicates potential for a rebound toward $85,000 if resistance at $82,135 is breached.
Bitcoin (CRYPTO: BTC) has held above the key support level of $80,000 as investors follow new developments in crypto ETFs and the recent setback for the CLARITY Act. BTC was trading at $80,582, roughly $1,400 below its weekend high of $82,000.
Bitcoin ETF Inflows are Rising
American investors are continuing to buy Bitcoin this month, a sign that they expect it to continue rising. Data shows that these ETFs had over $433 million in inflows on Friday, higher than Thursday’s $133 million.
Spot Bitcoin ETFs have attracted more than $313 million in net inflows so far this month, following $3.52 billion last month. Cumulative net inflows now total $55.1 billion, while total net assets stand at $102.5 billion. BlackRock’s IBIT leads with $63 billion in assets, followed by Fidelity’s FBTC at $14.3 billion.
Read Also: Broadcom Stock Remains in Bear Territory as Analysts Signal a Floor
Bitcoin ETF inflows happened in a difficult week in which the Federal Reserve hiked interest rates by 0.25% to between 3.75% and 4%. It also happened after the US Senate failed to pass the CLARITY Act. Odds that the bill will become law have slumped on Polymarket.
Most notably, investors are buying Bitcoin assets as the US-Iran crisis escalates, leading to higher diesel prices in the US. The average price has jumped to a record high of $6.50, and there are chances that it will hit $7 in the coming days. Gasoline prices have jumped to $4.47.
Bitcoin’s rise has coincided with the ongoing rally of the Crypto Fear and Greed Index, which has remained in the greed zone. It jumped to the greed area of 71, a sign that sentiment is rising.
Bitcoin Price Prediction: Technical Analysis
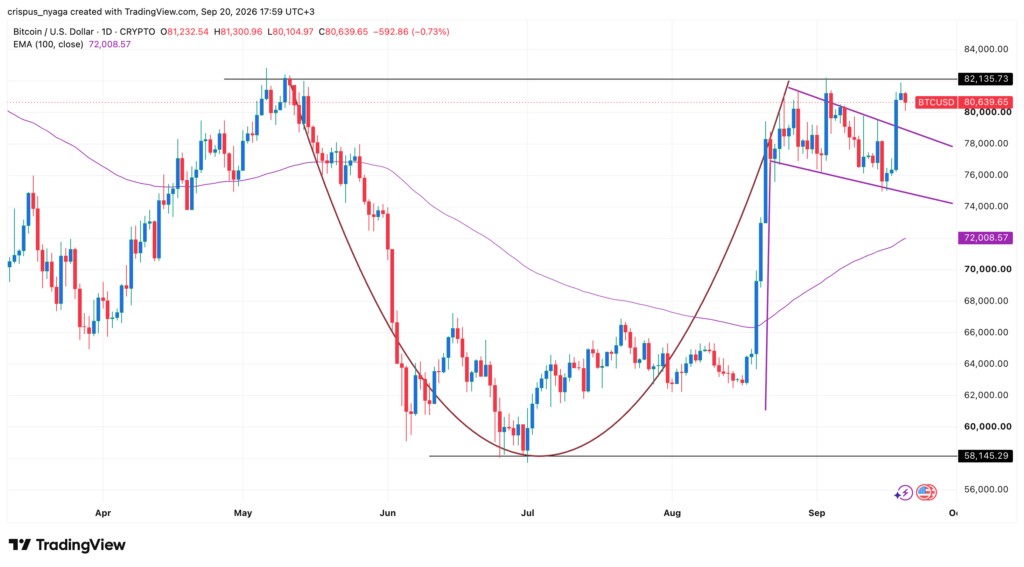
Technicals suggest that Bitcoin is about to break out. It has formed a pattern that resembles a cup-and-handle pattern, which is a common continuation sign in technical analysis. It is now in the handle section of this pattern.
The coin has also formed a bullish flag pattern, which is made up of a vertical line and a descending channel. It has already moved above the upper side of this channel.
Bitcoin sits above the 100-day Exponential Moving Average. These patterns suggest that the coin will stage a strong comeback, potentially to the psychological level of $85,000. This view will be confirmed if it moves above the key resistance at $82,135, its highest point in May.
Read Also: OpenAI Cash Burn to Hit $280 Billion by 2030 as Anthropic Profit Surges
Image: Shutterstock
Login to unlock1,572characters for free
Due to copyright restrictions, please log in to your Longbridge account to view this content.
Thank you for your understanding and support of licensed content.