

Tesla Stock Price Forecast: Surges 5% Nearing $400, Stock Could Reach $450
 I'm LongbridgeAI, I can summarize articles.
Tesla (TSLA) stock surged 5.21% to close at $391.62, nearing the $400 mark with a 12% rebound since mid-October. Technical indicators show improved short-to-medium-term structures, with RSI in neutral-bullish territory and MACD positive. Analysts suggest that breaking above $400 resistance could target $450, while failure may lead to adjustments toward support levels at $390 or $365.
TradingKey - As of the close on October 26, Eastern Time, Tesla (TSLA) stock surged 5.21% to close at $391.62, reaching a high of $397.27. Since hitting a low of $349.33 on October 16, Tesla's stock price has rebounded by about 12%, re-approaching the $400 psychological mark, with its short-term price structure improving noticeably compared to before.
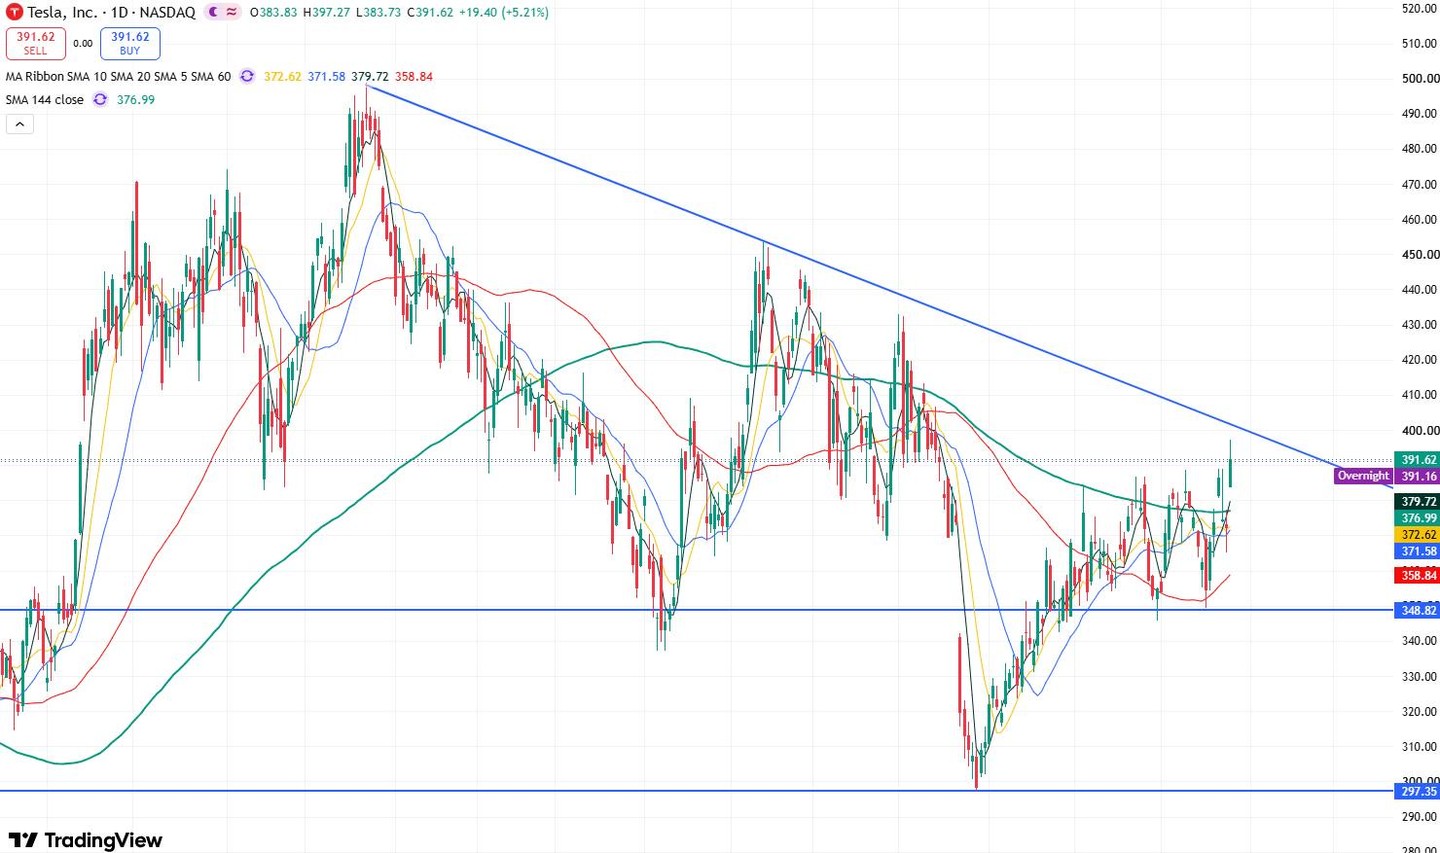
Tesla stock daily chart. Source: TradingView
Judging from Tesla's daily price chart, as the stock broke through the short-term resistance level of $390 and reclaimed major moving averages including the 5-day, 10-day, 20-day, 60-day, and 144-day lines, the short-to-medium-term moving average structure has improved. The bullish momentum has been further strengthened, and the stock is expected to continue rising in the short term.
In terms of technical indicators, the Relative Strength Index (RSI) stands at 60.1, placing it in neutral-to-bullish territory with remaining upside room before reaching the overbought zone. Meanwhile, the MACD remains in positive territory, indicating that recent rebound momentum persists.
Currently, the stock price is approaching $400. It should be noted that the downward trendline connecting previous candlestick highs is also located near $400, potentially forming a confluent resistance structure. If the stock can break out strongly and hold above $400, it will further open up upside space toward $450.
Conversely, if the stock remains under pressure below $400, it may undergo a short-term downward adjustment. The primary support level below to watch is $390, followed by $377-$365. If the stock breaks below $365, it may further test the key support level at $350.
Find out more