

Assessing JGC Holdings (TSE:1963) Valuation After Earnings Turn From Loss To ¥41,842m Net Income
 I'm LongbridgeAI, I can summarize articles.
JGC Holdings (TSE:1963) reported a net income of ¥41,842 million for the year ending March 31, 2026, recovering from a previous loss. The stock has seen a 15.84% return in the last month and 37.12% year-to-date, with a total shareholder return of 143.07% over the past year. However, it is considered 16% overvalued at a fair value of ¥2,360 compared to its last close of ¥2,731.5. The company’s future growth is tied to its strong pipeline in LNG and decarbonization projects.
JGC Holdings (TSE:1963) has returned to the spotlight after reporting full-year earnings for the period ended March 31, 2026, moving from a prior net loss to net income of ¥41,842 million.
See our latest analysis for JGC Holdings.
The earnings recovery and upcoming dividend proposal have arrived alongside strong share price momentum, with a 1 month share price return of 15.84% and year to date share price return of 37.12%. The 1 year total shareholder return of 143.07% points to substantial gains for investors over a longer horizon.
If JGC Holdings has caught your eye and you want to see what else is moving in related areas of infrastructure and energy, now is a good time to scan 35 power grid technology and infrastructure stocks
With earnings turning positive and the share price already up sharply, the key question now is whether JGC Holdings is still trading below its underlying value or if the market is already pricing in future growth.
Most Popular Narrative: 16% Overvalued
The most followed narrative puts JGC Holdings' fair value at ¥2,360, which sits below the last close of ¥2,731.5. This frames the current valuation debate.
Ongoing strong pipeline of international capital investment projects, especially in LNG, hydrogen, and decarbonization sectors, leverages JGC's engineering expertise and establishes long-term visibility for recurring revenue and higher-value contracts.
Read the complete narrative.
Want to see what backs that confidence in future contracts and margins? The narrative leans on steady revenues, firmer profit margins, and a richer earnings multiple story.
Result: Fair Value of ¥2,360 (OVERVALUED)
Have a read of the narrative in full and understand what's behind the forecasts.
However, this narrative can unravel if project execution issues return or if heavy exposure to large oil and gas EPC work leads to prolonged earnings pressure.
Find out about the key risks to this JGC Holdings narrative.
Another Angle On Valuation
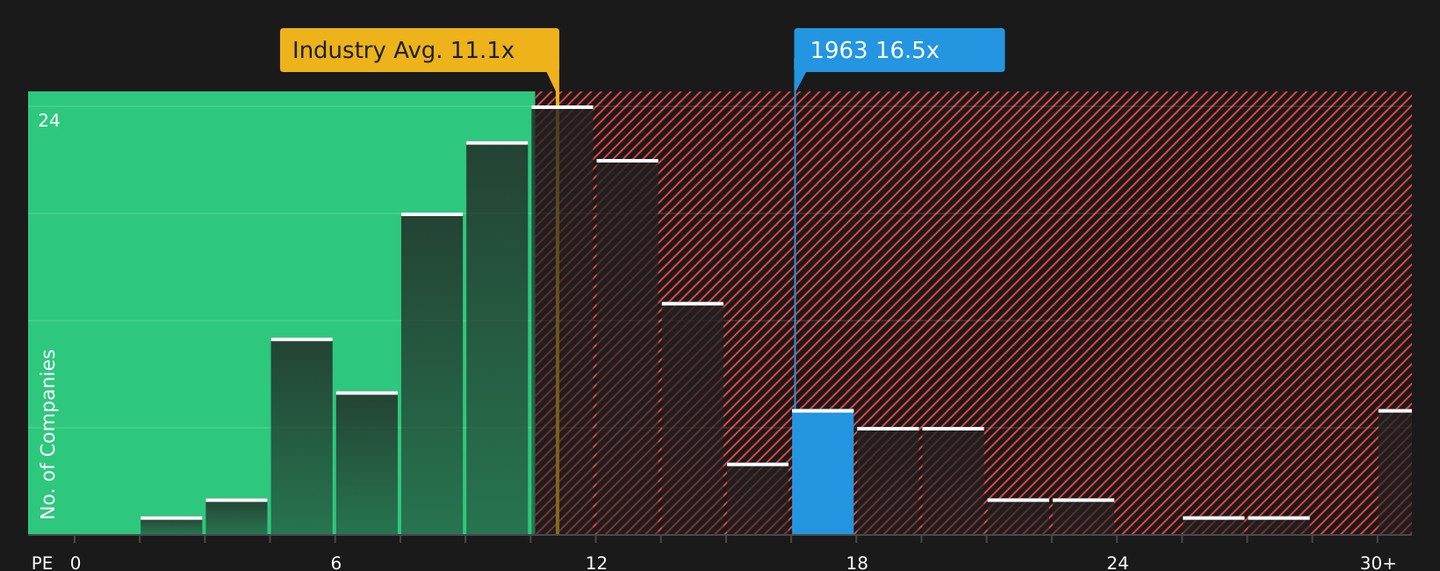
While the consensus fair value of ¥2,360 suggests JGC Holdings is 16% overvalued at ¥2,731.5, the current P/E of 15.8x sits below an estimated fair ratio of 17.6x, yet above the JP Construction industry at 11.1x and peers at 14.4x. That mix of cheaper and richer signals raises a simple question: where is the real margin of safety here?
See what the numbers say about this price — find out in our valuation breakdown.
Next Steps
If this mix of optimism and concern around JGC Holdings leaves you on the fence, now is the time to test the numbers yourself and shape your own view with 1 key reward and 2 important warning signs
Looking for more investment ideas?
If JGC Holdings has sharpened your focus, do not stop here. Fresh opportunities across different styles and risk profiles are only a few clicks away.
- Target quality at a discount by scanning companies highlighted in the 17 high quality undervalued stocks that pair fundamentals with appealing valuations.
- Strengthen your income stream by reviewing stocks in the 41 dividend fortresses that combine yield with consistency.
- Prioritise resilience by filtering companies through the 57 resilient stocks with low risk scores that emphasise stability and controlled downside.
This article by Simply Wall St is general in nature. We provide commentary based on historical data and analyst forecasts only using an unbiased methodology and our articles are not intended to be financial advice. It does not constitute a recommendation to buy or sell any stock, and does not take account of your objectives, or your financial situation. We aim to bring you long-term focused analysis driven by fundamental data. Note that our analysis may not factor in the latest price-sensitive company announcements or qualitative material. Simply Wall St has no position in any stocks mentioned.
New: Manage All Your Stock Portfolios in One Place
We've created the ultimate portfolio companion for stock investors, and it's free.
• Connect an unlimited number of Portfolios and see your total in one currency
• Be alerted to new Warning Signs or Risks via email or mobile
• Track the Fair Value of your stocks
Try a Demo Portfolio for Free