

MODEC (TSE:6269) Earnings Put Valuation Back In Focus
 I'm LongbridgeAI, I can summarize articles.
MODEC (TSE:6269) reported H1 2026 sales of US$2.45bn and net income of US$224m, up from prior year figures. Despite a YTD price decline of 16.55%, recent earnings sparked interest with short-term gains. Valuation analysis shows a P/E of 10.6x, below industry peers but above the estimated fair ratio of 9.1x. A DCF model suggests the current share price is undervalued relative to future cash flows, presenting mixed signals for investors weighing strong historical returns against modest growth forecasts.
MODEC earnings spark fresh interest in the stock
MODEC (TSE:6269) released half year results to June 30, 2026, with sales of US$2,447.05m and net income of US$224.05m, compared with US$2,074.3m and US$145.08m a year earlier.
See our latest analysis for MODEC.
MODEC’s recent earnings update appears to have shifted sentiment, with the 1-day share price return of 2.89% and 1-month share price return of 3.44% standing against a year-to-date share price decline of 16.55%. At the same time, the 1-year total shareholder return of 44.69% and multi year total shareholder returns in the very large range point to earlier strong momentum that has recently faded.
If MODEC’s move has you looking beyond a single stock, this is a good moment to see what else is setting up in the sector via the 91 nuclear energy infrastructure stocks
Bulls see MODEC’s stronger half year earnings and recent bounce as the start of a re rating. Bears point to the year to date share price decline and past volatility. Which side do the valuation numbers support next?
Price-to-Earnings of 10.6x for MODEC: Is it justified?
On the numbers, MODEC screens as good value on several measures, yet looks a bit rich on one key benchmark. The stock trades on a P/E of 10.6x, which is below both the Asian Energy Services industry average of 16.5x and a peer group average of 16.3x. A discounted cash flow (DCF) analysis suggests the current share price of ¥10,510 is below an estimated future cash flow value of ¥16,919.61.
The P/E multiple compares MODEC’s share price to its earnings per share. For a company focused on floating production systems with a profitable track record and high quality earnings, it is a straightforward way to see how much investors are paying for each unit of profit.
Relative to sector and peers, a 10.6x P/E implies the market is pricing MODEC at a lower earnings multiple than many comparable Energy Services stocks. That can happen when investors expect slower future growth or see higher risk. The fair P/E ratio estimate of 9.1x points in the other direction and suggests the market multiple could have room to adjust toward that level if those assumptions prove closer to reality.
The contrast is stark. MODEC trades below broad industry and peer P/E levels, yet above the estimated fair P/E that the model points to. Investors are effectively weighing a strong earnings record and a 28.5% return on equity against forecasts for modest earnings growth of 0.2% per year and a revenue decline of 3% per year. How that balance plays out will be key for where the multiple settles next.
Explore the SWS fair ratio for MODEC
Result: Price-to-earnings of 10.6x (ABOUT RIGHT)
However, MODEC’s revenue decline of 3% and the year to date share price fall of 16.55% highlight that sentiment can shift quickly if contracts or margins disappoint.
Find out about the key risks to this MODEC narrative.
Another view on MODEC’s valuation
The P/E comparison presents MODEC as relatively inexpensive compared with industry peers, yet slightly above its fair ratio of 9.1x. Our DCF model offers a different perspective. It indicates that the current share price of ¥10,510 is below an estimated future cash flow value of ¥16,919.61. That highlights a potential upside, but how comfortable are you with the assumptions embedded in that projected cash flow?
Look into how the SWS DCF model arrives at its fair value.
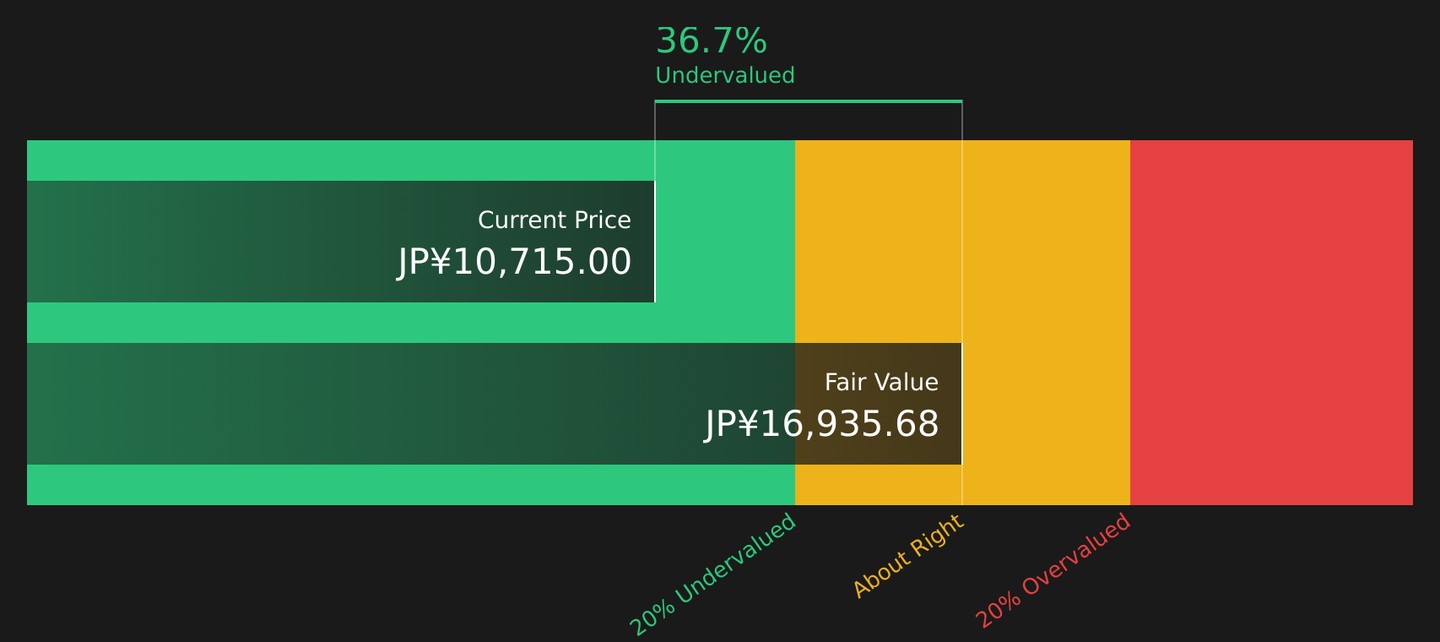
Simply Wall St performs a discounted cash flow (DCF) on every stock in the world every day (check out MODEC for example). We show the entire calculation in full. You can track the result in your watchlist or portfolio and be alerted when this changes, or use our stock screener to discover 26 high quality undervalued stocks. If you save a screener we even alert you when new companies match - so you never miss a potential opportunity.
Next Steps
With MODEC’s valuation sending mixed signals, it is worth looking past the headline numbers and weighing both the concern and optimism in the data. To see how the full picture of risks and rewards stacks up, take a closer look at the 2 key rewards and 2 important warning signs.
Looking for more MODEC investment ideas?
If MODEC has sharpened your focus, do not stop there. Broader context from other stocks can help you stress test your thinking and spot fresh opportunities.
- Spot companies that combine quality and attractive pricing by scanning the 26 high quality undervalued stocks before others notice the same potential.
- Strengthen your income toolkit by reviewing the 33 dividend fortresses that could complement MODEC in a diversified portfolio.
- Protect your downside by checking the 58 resilient stocks with low risk scores that may offer steadier profiles alongside more volatile holdings.
This article by Simply Wall St is general in nature. We provide commentary based on historical data and analyst forecasts only using an unbiased methodology and our articles are not intended to be financial advice. It does not constitute a recommendation to buy or sell any stock, and does not take account of your objectives, or your financial situation. We aim to bring you long-term focused analysis driven by fundamental data. Note that our analysis may not factor in the latest price-sensitive company announcements or qualitative material. Simply Wall St has no position in any stocks mentioned.
New: Manage All Your Stock Portfolios in One Place
We've created the ultimate portfolio companion for stock investors, and it's free.
• Connect an unlimited number of Portfolios and see your total in one currency
• Be alerted to new Warning Signs or Risks via email or mobile
• Track the Fair Value of your stocks
Try a Demo Portfolio for Free