

Alithya Group Q3 2026 C$30.9m Loss Tests Bullish Profitability Narrative
 I'm LongbridgeAI, I can summarize articles.
Alithya Group (TSX:ALYA) reported a Q3 2026 loss of C$30.9 million, with revenue at C$124.3 million and basic EPS at a loss of C$0.32. Despite a trailing twelve-month revenue of C$489.5 million, the company faces challenges in profitability, with forecasts suggesting a 109.87% earnings growth needed to turn around its mixed performance. Critics highlight a slower revenue growth outlook of 4.5% compared to the market's 8.5%, raising concerns about margin improvements. The stock trades at a low P/S of 0.3x, indicating potential upside but also reflecting the ongoing losses.
Alithya Group (TSX:ALYA) has just posted its Q3 2026 numbers, with recent quarterly revenue sitting around C$124.3 million in Q2 2026 and basic EPS at a loss of C$0.32. Earlier quarters over the past year have ranged from C$111.5 million to C$125.3 million in revenue and basic EPS from a C$0.08 profit to a C$0.04 loss. Over the trailing twelve months to Q2 2026, revenue has hovered around C$468.7 million to C$489.5 million and basic EPS has swung between a small profit of C$0.01 and a loss of C$0.27. This frames a story of meaningful top line scale paired with still pressured margins that keep profitability on the watchlist for investors.
See our full analysis for Alithya Group.
With the latest results on the table, the next step is to see how these revenue and EPS swings line up with the most widely discussed narratives around Alithya and where the numbers start to push back on those views.
See what the community is saying about Alithya Group
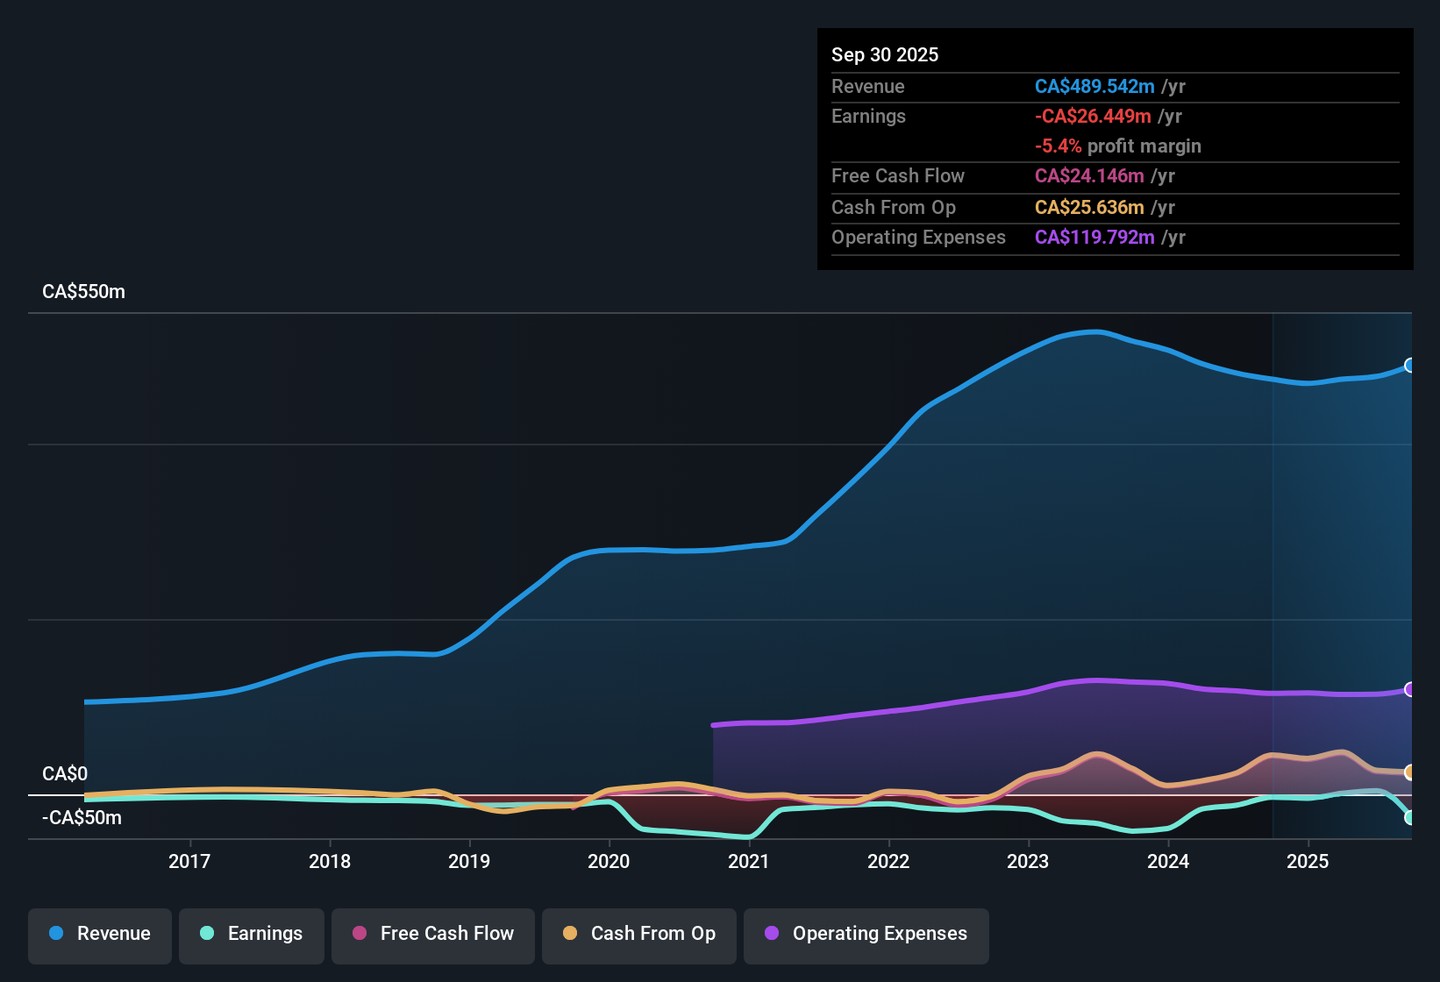
Losses Widen Again With C$30.9m Hit
- Q2 2026 showed total revenue of C$124.3 million alongside a net loss of C$30.9 million and basic EPS of a C$0.32 loss, after a small C$0.19 million profit and roughly flat EPS in Q1 2026 on similar revenue of C$124.2 million.
- Bulls point to forecasts of very strong earnings growth and a path to profitability within three years. However, the latest C$30.9 million loss means:
- Trailing 12 month net income is shown at a loss of C$26.4 million, so the recent quarter sits at odds with the idea of steadily narrowing losses, even though longer term data shows losses have reduced by about 20.4% a year over five years.
- Forecast earnings growth of about 109.87% a year relies on turning this pattern of mixed quarters around. As a result, the current run rate of losses makes the bullish timing on profitability something investors may want to stress test against these actual results.
Bulls argue this setback is just a step on the way to a turnaround. If you want to see how that optimistic story is built around these numbers, have a look at 🐂 Alithya Group Bull Case
Trailing Revenue Near C$489.5m, But Growth Seen Slower Than Market
- On a trailing 12 month view to Q2 2026, revenue sits at about C$489.5 million, and the analysis you have here cites expected revenue growth of 4.5% a year compared with a Canadian market forecast of 8.5% a year.
- Critics who lean bearish highlight that this slower 4.5% revenue growth outlook could limit how much earnings can scale. The current data creates some tension with that view:
- Quarterly revenue over the last six reported periods has moved in a band from C$111.5 million to C$125.3 million, which shows the business already operates at decent scale even though top line growth is not pegged to match the broader market.
- Because the company is still loss making on C$489.5 million of trailing revenue, bears argue that simply growing at 4.5% a year may not be enough by itself to reach the profit margin improvements that optimistic scenarios assume, so margin progress becomes just as important as the revenue line.
Skeptics see this growth profile as a reason for caution. If you want the full cautious argument set out against these figures, it is worth reading through 🐻 Alithya Group Bear Case
P/S At 0.3x Versus Industry 1.9x
- The shares trade on a P/S of 0.3x compared with about 0.7x for peers and 1.9x for the wider North American IT industry, while the current share price of C$1.42 is also well below an analyst price target reference of C$2.64 and a DCF fair value of C$7.42.
- Supporters of the bullish narrative say this wide valuation gap leaves room for upside, but the loss making profile means the discount comes with clear trade offs:
- Trailing 12 month EPS is a loss of C$0.27 and net income is a loss of C$26.4 million, which explains why valuation is framed around P/S and DCF fair value rather than P/E, and highlights why some investors may see the low multiple as compensation for these losses.
- At the same time, forecasts that the company could become profitable within three years sit beside this 0.3x P/S level, so anyone using the apparent discount as part of their thesis will likely want to keep a close eye on how quickly the loss line moves towards the profitability path outlined in those forecasts.
Next Steps
To see how these results tie into long-term growth, risks, and valuation, check out the full range of community narratives for Alithya Group on Simply Wall St. Add the company to your watchlist or portfolio so you'll be alerted when the story evolves.
See the numbers another way? Take a couple of minutes to compare your own view with the data and turn it into a clear thesis: Do it your way
A good starting point is our analysis highlighting 4 key rewards investors are optimistic about regarding Alithya Group.
See What Else Is Out There
Alithya Group is still posting sizeable losses on roughly C$489.5 million of trailing revenue, with slower forecast revenue growth and profitability timing that remains uncertain.
If you want alternatives where the story focuses more on value than ongoing losses, take a few minutes to scan our 5 high quality undervalued stocks and see which ideas better fit your risk tolerance today.
This article by Simply Wall St is general in nature. We provide commentary based on historical data and analyst forecasts only using an unbiased methodology and our articles are not intended to be financial advice. It does not constitute a recommendation to buy or sell any stock, and does not take account of your objectives, or your financial situation. We aim to bring you long-term focused analysis driven by fundamental data. Note that our analysis may not factor in the latest price-sensitive company announcements or qualitative material. Simply Wall St has no position in any stocks mentioned.
New: Manage All Your Stock Portfolios in One Place
We've created the ultimate portfolio companion for stock investors, and it's free.
• Connect an unlimited number of Portfolios and see your total in one currency
• Be alerted to new Warning Signs or Risks via email or mobile
• Track the Fair Value of your stocks
Try a Demo Portfolio for Free