

Understanding Amazon.com's Position In Broadline Retail Industry Compared To Competitors
 I'm LongbridgeAI, I can summarize articles.
An analysis compares Amazon.com with competitors in the Broadline Retail industry. Key metrics show Amazon's PE (20.51) and PB (4.99) ratios suggest undervaluation, while its PS ratio (3.57) indicates potential overvaluation relative to sales. Amazon demonstrates strong profitability with high ROE (12.61%), EBITDA ($102.16B), and gross profit ($104.83B), significantly outperforming industry averages. Revenue growth of 19.62% also exceeds the peer average. Additionally, Amazon maintains a favorable financial position with a low debt-to-equity ratio of 0.4 compared to top peers.
In the ever-evolving and intensely competitive business landscape, conducting a thorough company analysis is of utmost importance for investors and industry followers. In this article, we will carry out an in-depth industry comparison, assessing Amazon.com (NASDAQ:AMZN) alongside its primary competitors in the Broadline Retail industry. By meticulously examining key financial metrics, market positioning, and growth prospects, we aim to offer valuable insights to investors and shed light on company's performance within the industry.
Amazon.com Background
Amazon is the leading online retailer and marketplace for third party sellers. Retail related revenue represents approximately 74% of total, followed by Amazon Web Services (17%), and advertising services (9%). International segments constitute 22% of Amazon's total revenue, led by Germany, the United Kingdom, and Japan.
| Company | P/E | P/B | P/S | ROE | EBITDA (in billions) | Gross Profit (in billions) | Revenue Growth |
|---|---|---|---|---|---|---|---|
| Amazon.com Inc | 20.51 | 4.99 | 3.57 | 12.61% | $102.16 | $104.83 | 19.62% |
| MercadoLibre Inc | 49.69 | 11.82 | 2.63 | 6.17% | $0.96 | $4.16 | 49.76% |
| eBay Inc | 22.96 | 10.42 | 4.19 | 12.12% | $0.83 | $2.3 | 14.8% |
| Dillard's Inc | 14.90 | 4.79 | 1.54 | 4.71% | $0.17 | $0.62 | -0.36% |
| Global E Online Ltd | 47.22 | 7.72 | 6.70 | 5.26% | $0.05 | $0.13 | 39.15% |
| Macy's Inc | 8.34 | 1.21 | 0.27 | 3.46% | $0.46 | $2.21 | 1.2% |
| Ollie's Bargain Outlet Holdings Inc | 18.46 | 2.59 | 1.81 | 4.51% | $0.13 | $0.32 | 9.09% |
| Kohl's Corp | 7.84 | 0.50 | 0.14 | 3.69% | $0.43 | $1.62 | -0.87% |
| Savers Value Village Inc | 61.73 | 3.19 | 0.86 | 4.95% | $0.07 | $0.25 | 7.43% |
| Hour Loop Inc | 45.75 | 7.25 | 0.42 | 12.6% | $0.0 | $0.02 | 25.24% |
| Average | 30.77 | 5.5 | 2.06 | 6.39% | $0.34 | $1.29 | 16.16% |
Upon a comprehensive analysis of Amazon.com, the following trends can be discerned:
- A Price to Earnings ratio of 20.51 significantly below the industry average by 0.67x suggests undervaluation. This can make the stock appealing for those seeking growth.
- With a Price to Book ratio of 4.99, significantly falling below the industry average by 0.91x, it suggests undervaluation and the possibility of untapped growth prospects.
- The Price to Sales ratio of 3.57, which is 1.73x the industry average, suggests the stock could potentially be overvalued in relation to its sales performance compared to its peers.
- The Return on Equity (ROE) of 12.61% is 6.22% above the industry average, highlighting efficient use of equity to generate profits.
- The company exhibits higher Earnings Before Interest, Taxes, Depreciation, and Amortization (EBITDA) of $102.16 Billion, which is 300.47x above the industry average, implying stronger profitability and robust cash flow generation.
- Compared to its industry, the company has higher gross profit of $104.83 Billion, which indicates 81.26x above the industry average, indicating stronger profitability and higher earnings from its core operations.
- The company's revenue growth of 19.62% exceeds the industry average of 16.16%, indicating strong sales performance and market outperformance.
Debt To Equity Ratio
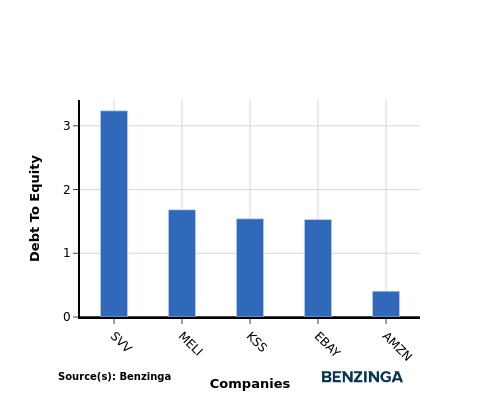
The debt-to-equity (D/E) ratio is a measure that indicates the level of debt a company has taken on relative to the value of its assets net of liabilities.
Considering the debt-to-equity ratio in industry comparisons allows for a concise evaluation of a company's financial health and risk profile, aiding in informed decision-making.
When comparing Amazon.com with its top 4 peers based on the Debt-to-Equity ratio, the following insights can be observed:
- Amazon.com is in a relatively stronger financial position compared to its top 4 peers, as evidenced by its lower debt-to-equity ratio of 0.4.
- This implies that the company relies less on debt financing and has a more favorable balance between debt and equity.
Key Takeaways
For Amazon.com in the Broadline Retail industry, the PE and PB ratios suggest the stock is undervalued compared to peers. However, the high PS ratio indicates the stock may be overvalued based on revenue. In terms of profitability, Amazon.com shows strong performance with high ROE, EBITDA, and gross profit margins. Additionally, the company's revenue growth rate is also high, reflecting a positive outlook for future earnings potential compared to industry peers.
This article was generated by Benzinga's automated content engine and reviewed by an editor.