

Algonquin Power Net Margin Compressed To 1.1% Reinforces Cautious Earnings Narrative
 I'm LongbridgeAI, I can summarize articles.
Algonquin Power & Utilities (TSX:AQN) reported mixed FY 2025 results, with Q3 revenue at US$582.7 million and EPS of US$0.09, while net profit margins fell sharply to 1.1% from 16.2% a year prior. Analysts anticipate earnings growth despite current low profitability, but concerns about high debt and interest costs persist. The stock trades at CA$8.35, significantly below its DCF fair value of CA$18.76, indicating potential upside but also reflecting cautious sentiment due to slow revenue growth and tight margins.
Algonquin Power & Utilities (TSX:AQN) has laid out a mixed set of FY 2025 numbers, with Q3 revenue at US$582.7 million and EPS of US$0.09, against a backdrop where trailing net profit margins slipped from 16.2% to 1.1% over the past year. The company has seen quarterly revenue move from US$573.2 million in Q3 2024 to US$692.4 million in Q1 2025 and US$582.7 million in Q3 2025. EPS shifted from US$0.07 in Q3 2024 to US$0.12 in Q1 2025 and US$0.09 in Q3 2025, setting the stage for analysts’ expectations of rapid earnings growth from a much thinner margin base. For investors, the story this quarter centers on how that low current profitability might respond if the forecast earnings recovery plays out.
See our full analysis for Algonquin Power & Utilities.
With the headline figures in place, the next step is to see how these reported margins and earnings trajectories line up with the widely discussed bull and bear narratives around Algonquin, and where those stories might need a rethink.
See what the community is saying about Algonquin Power & Utilities
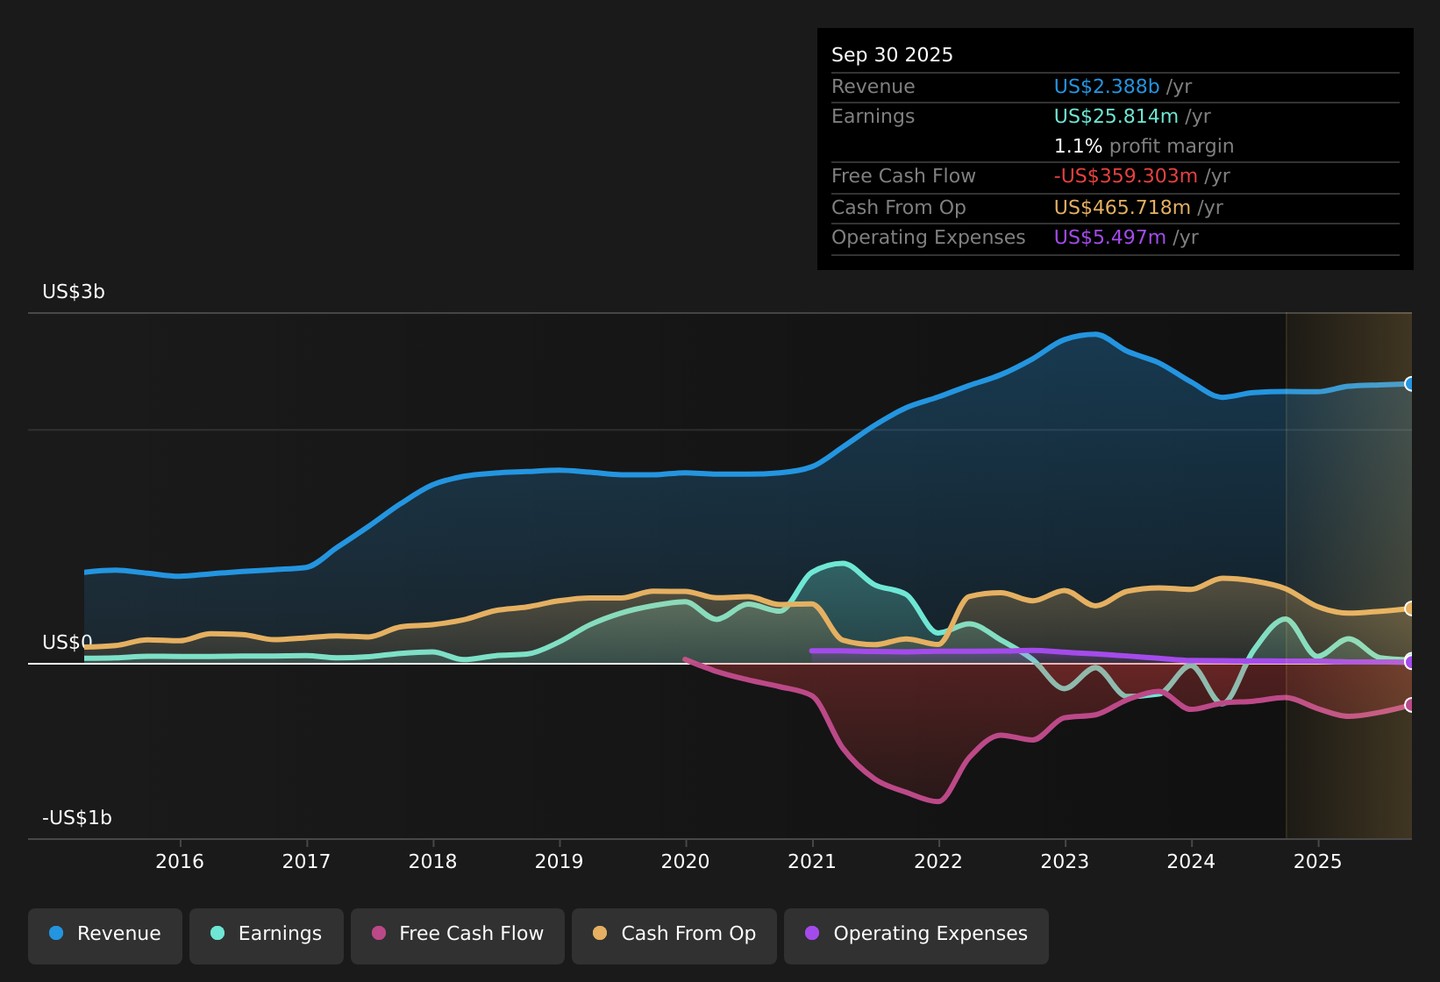
EPS swings around discontinued items
- Across the last three reported quarters, basic EPS moved from US$0.12 in Q1 2025 to US$0.02 in Q2 and US$0.09 in Q3, while earnings from discontinued operations swung from a gain of US$6.7 million in Q2 2025 to a loss of US$34.8 million in Q3.
- What bullish investors focus on is that, even with those discontinued hits, net income excluding extra items in Q3 2025 was US$71 million versus US$14.8 million in Q2. They see this as early support for forecasts of strong earnings growth.
- Bullish arguments point to this rebound in underlying earnings alongside forecasts of roughly 58% annual earnings growth as evidence that reported EPS volatility may not reflect the core trend they are watching.
- At the same time, the five year history of earnings falling about 46.6% per year reminds you that this improvement has only shown up in a few quarters so far. This is why bulls treat these numbers as the start of a possible turnaround rather than proof that it is complete.
Bulls argue that this sharp rebound in underlying profit is exactly the kind of inflection that could reshape Algonquin's longer term story, if it can be repeated over more quarters. 🐂 Algonquin Power & Utilities Bull Case
Margins compressed to 1.1%
- On a trailing basis, net profit margin sits at 1.1%, well below the 16.2% level from the prior year, even though trailing twelve month revenue of about US$2.4b is only modestly above the US$2.3b level a year earlier.
- Skeptics point out that this sharp margin squeeze lines up with concerns around high debt and interest costs, and they argue that weak coverage of interest and a dividend yield of 4.26% that is not well covered by earnings or free cash flow leave little room for error.
- The risk view leans heavily on the data that interest payments are not well covered by earnings and that dividend coverage is stretched, which together can keep margins tight even if revenue edges up.
- With earnings having declined on average 46.6% per year over the past five years, bears see the current 1.1% net margin as consistent with a business still working through balance sheet and regulatory pressures rather than one already through the tough part.
Skeptical investors use this margin and coverage profile as their main reference point when they argue that the cautious long term narrative still fits Algonquin today. 🐻 Algonquin Power & Utilities Bear Case
DCF fair value far above price
- Algonquin trades at CA$8.35 while the provided DCF fair value is CA$18.76, and the company is on a P/S of 2x compared with 1.6x for the global integrated utilities group and 2.4x for its direct peers.
- Consensus narrative sees this mix of signals as a tug of war, with a DCF model and strong earnings growth forecasts pointing to upside potential, while slower expected revenue growth of 4.2% a year versus 6.1% for the Canadian market and the current 1.1% net margin keep many analysts cautious.
- The DCF gap and cheaper P/S versus peers are what support the idea that the shares could be pricing in a lot of the five year earnings decline already.
- On the other hand, the weaker revenue growth outlook and thin margins give a clear reason why the share price might sit well below both the CA$9.37 analyst target and the DCF fair value until the profit story looks more settled.
Next Steps
To see how these results tie into long-term growth, risks, and valuation, check out the full range of community narratives for Algonquin Power & Utilities on Simply Wall St. Add the company to your watchlist or portfolio so you'll be alerted when the story evolves.
With both cautious and optimistic narratives in play, how does all this stack up for you, personally, right now? If you want to move quickly from headline impressions to your own evidence based view, it is worth weighing the balance of 2 key rewards and 3 important warning signs.
Explore Alternatives
Algonquin's squeezed 1.1% net margin, stretched dividend coverage, and interest burden highlight how fragile its earnings profile currently looks.
If that balance sheet strain makes you uneasy, shift your focus toward companies screened for stronger financial footing and steadier cash coverage with solid balance sheet and fundamentals stocks screener (10 results) today.
This article by Simply Wall St is general in nature. We provide commentary based on historical data and analyst forecasts only using an unbiased methodology and our articles are not intended to be financial advice. It does not constitute a recommendation to buy or sell any stock, and does not take account of your objectives, or your financial situation. We aim to bring you long-term focused analysis driven by fundamental data. Note that our analysis may not factor in the latest price-sensitive company announcements or qualitative material. Simply Wall St has no position in any stocks mentioned.
New: Manage All Your Stock Portfolios in One Place
We've created the ultimate portfolio companion for stock investors, and it's free.
• Connect an unlimited number of Portfolios and see your total in one currency
• Be alerted to new Warning Signs or Risks via email or mobile
• Track the Fair Value of your stocks
Try a Demo Portfolio for Free