

Amazon Stock Forecast: Morgan Stanley Top Pick Call Sends AMZN to $263 Triangle Resistance
 I'm LongbridgeAI, I can summarize articles.
Amazon stock rose nearly 5% to $262.45, driven by Morgan Stanley naming it a top pick and raising its price target to $350. The upgrade cites strong AWS growth forecasts linked to AI demand. While Q2 results showed robust sales and operating income, concerns remain over high capital expenditures and soft Q3 guidance due to Prime Day timing shifts. Technical analysis indicates the stock is testing resistance near $263, with bullish momentum contingent on breaking above $267.
TradingKey - Amazon (NASDAQ: AMZN) spiked 4.98% to finish at $262.45 on Monday, October 19. That’s from its close on Friday of $250. It is currently approximately 9% down from its August peak near $287.
Morgan Stanley naming Amazon its top pick of the stock and raising its price target to $350 from $335 was likely the biggest catalyst on Monday. According to my analysis, the stock is largely dependent on AWS and the next biggest catalyst will be Amazon’s Q3 Earnings Call on Thursday, October 29 at 5:00pm ET.
Why Morgan Stanley Turned More Bullish
Brian Nowak increased his two year annual growth rate forecast of AWS revenue to 47% for 2027 and 42% for 2028 from 41% and 37% respectively. The revision to his forecast was due to disclosures by Nvidia (NVDA) that AWS will deploy around 2 million of Nvidia’s GPUs over the next two years. Nowak also mentioned better visibility of Bedrock, Amazon’s cloud-based AI model service.
Morgan Stanley gave a bear case of $220 and bull case of $410. In my opinion, the wide range of their cases shows that AWS revenue and its margin growth will be the largest driver of the stock price in the short term.
AWS Is Driving the Story
AWS revenue growth continued at a blistering pace, increasing 37% to $42.2 billion in Q2. AWS operating income grew 63% to $16.6 billion compared to Q2 2025 from $10.2 billion, a margin of 39%.
It is important to recognize that AWS generates roughly 60% of operating profit for Amazon, making Cloud the biggest driver of the stock price right now instead of retail.
The Group Results
Q2 net sales increased 20% to $200.6 billion, surpassing the estimated $197 billion. Operating income was $27.5 billion, up 43% from the previous year, and advertising increased 26%.
The reported net income of $62.6 billion, or $5.75 per share, includes non-operating income of $53.4 billion, primarily gains on the investments of Amazon’s Anthropic. Focus on operating income rather than net income, which was inflated by the gains.
Q3 Guidance Looks Soft, but Timing Explains Much of It
Amazon expects Q3 net sales of $197 to $202 billion, up 9% to 12% from the prior year. Operating income for Q3 is expected to be $22.5 to $26.5 billion, compared to $17.4 billion in Q3 2025.
The headline numbers are misleading. The 2026 prime day event occurred in Q2 rather than Q3, and Amazon commented Q3 growth would be nearly 4 percentage points higher if not for the shift in prime day.
Capex and Free Cash Flow Are the Main Risk
Amazon increased its 2026 capital spending plan to approximately $220 billion from $200 billion, primarily due to higher prices of memory and other chips. Amazon’s spending on property, plant, and equipment was $54.2 billion in Q2, and Free Cash Flow for the past 12 months was negative $7.6 billion.
The main concern is whether AWS continues to be the main driver of revenue growth. If Amazon continues to increase capital spending, the bull case weakens.
Analysts and Sentiment
Rosenblatt raised its target to $360 from $335 in September, and the average analyst target hovers around $322. Amazon’s balance sheet stands out, in particular, at a time when heavily indebted AI builders, such as CoreWeave, are selling off sharply.
Amazon Technical Analysis: AMZN Jumps 5% to Test Triangle Resistance Near $263
My daily chart has AMZN closing at $262.45, an increase of 4.98%. It has adjusted even higher to an overnight high of $263.45. It is currently testing the upper trendline of a symmetrical triangle and the 50-day EMA at $254.58. The triangle is formed by the rising trendline drawn from the July low of $226.21 and the descending trendline drawn from the August high of $287.20.
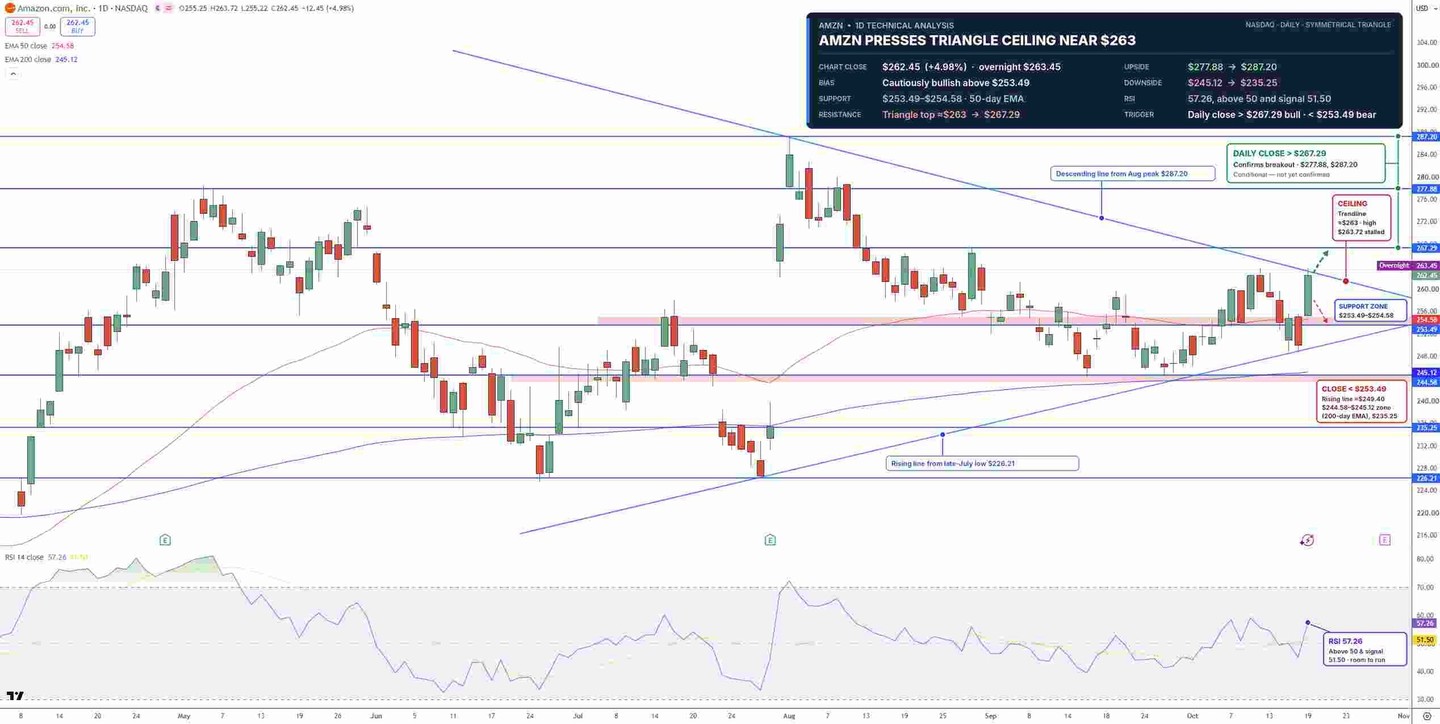
Amazon Stock Price Chart - Source: Tradingview
Yesterday’s price action strongly favored the bulls and lifted the stock back above its 50-day EMA, but a break above the trendline extending down from the August high would be needed to confirm the new uptrend.
If bulls can drive AMZN above $267.29, the stock could test the $277.88 and $287.20 levels next. A move below $253.49 first targets $244.58 and then $235.25. For now I’m bullish, but would become more aggressive on the long side above $267.29.
Key Levels
Last close: $262.45, up 4.98% on October 19
Support: $253.49 to $254.58, $244.58 to $245.12, $235.25
Resistance: $263.72, $267.29, $277.88, $287.20
RSI: 57.26, above its 51.50 signal line
Bullish trigger: Daily close above $267.29
Bearish trigger: Daily close below $253.49
FAQs
Why did Amazon stock jump 5% on October 19?
Morgan Stanley named Amazon its top pick, raised its target to $350 from $335 and lifted its 2027 AWS growth forecast to 47%, citing AI capacity and Bedrock demand.
What is the Amazon stock forecast before Q3 earnings?
The bias is cautiously bullish above $253.49. A close above $267.29 targets $277.88 and $287.20, while a close below $253.49 opens $245.12 and $235.25.
Bottom Line
Going into earnings, Amazon has its cloud business AWS accelerating and Wall Street turning more bullish. However, its $220 billion capex plan keeps FCF under pressure. The opportunity is a breakout above $277.88 if Q3 AWS estimates are confirmed. Other risks are a slower AWS growth and weaker Q4 outlook. A close above $267.29 strengthens my view, while a close below $253.49 invalidates it.
Find out more