

Meta Stock Forecast: META Defends $694 Support as a $10 Billion Legal Charge and Capex Test Loom
 I'm LongbridgeAI, I can summarize articles.
Meta Platforms (META) faces a $10 billion legal charge in Q3 earnings, distorting reported financials despite strong ad revenue growth. High capital expenditures have significantly reduced free cash flow. Analysts maintain bullish price targets ($797 avg), citing Muse AI traction, though retention concerns persist. Technically, META defends the $694 support level; a close above $727 could target $780, while a break below risks lower levels. Earnings on Oct 21 will be pivotal.
TradingKey - Meta Platforms (NASDAQ: META) fell 0.55% to end the day at $705.44 on Monday, October 19. It also lost 3.72% on Friday. The stock has been trending lower from its September highs in the $780 range as the broader market sold off on rising debt concerns and signs of possible recession.
My focus is more on two things that are likely to happen in the future: 2027 capex, and more traction by the company's Muse AI agent. I believe the catalyst has been set. The company is scheduled to announce its Q3 earnings after the market close on Wednesday, October 21, with the company call set for 4:30 p.m. ET.
A $10 Billion Legal Charge Will Distort Q3
The other thing that draws my attention is the $10 billion legal charge. Meta expects to record about $10 billion of legal expense in Q3 after settling youth-harm claims with a group of 29 attorneys general. The settlement is capped at about $18 billion over 10 years, of which about $12.7 billion is unconditional.
The outstanding $5.3 billion hinges on the implementation of similar safety measures by YouTube and TikTok, and the settlement still awaits court approval. Because the charge was not contained in Meta's previous guidance, reported Q3 results will reflect much weaker financials than the underlying business.
Q2 Showed Strong Ads but Shrinking Cash
Q2 revenues increased by 28% to $60.8 billion, as the total number of ads increased by 14% and the average price of ads increased by 12%. “Other” revenue from the Family of Apps exceeded $1 billion for the first time and increased by about 73%.
Total expenses for the quarter increased by 55% to $42.0 billion, which included $2.4 billion of litigation costs and $1.2 billion of severance costs. EPS declined to $6.18 from $7.14.
Capex Is Swallowing Free Cash Flow
The issue for me is cash. Q2 capex was $31.1 billion, and free cash flow plummeted to $784 million from $8.55 billion the year prior. Meta narrowed its 2026 capex to $130 billion to $145 billion. The company ended Q2 with $90.3 billion in cash and marketable securities, compared to $83.7 billion in long-term debt. Any sign of 2027 spending may move the stock more than the Q3 results themselves.
Guidance to Beat
Meta set Q3 revenue guidance from $61 billion to $64 billion and full-year expenses from $165 billion to $169 billion (before the legal charge). The consensus is around $63.3 billion in revenue and $6.76 in EPS. Bank of America set a revenue estimate of $63.8 billion.
Muse: Strong Launch, Retention Questions
Meta launched Muse in September and updated it last week with Wonder models. Bank of America sees strong Muse traction resulting in multiple expansion (valued at 22x 2027 earnings) and believes growth will largely come from advertising revenues.
The retention data isn't great. Morgan Stanley says Muse is drawing about 300,000 U.S. downloads daily, but 14 day retention is only about 20%. It also takes a lot of computing power to drive revenue with Muse.
Analysts Lift Targets but Flag Costs
Morgan Stanley set a new target of $820 on the stock, Guggenheim set a new target of $850, and Wells Fargo set a new target of $1000. Bank of America has set a target of $810, and the average target price hovers around $797.
Meta Technical Analysis: META Defends $694.88 Fibonacci Support as Bulls Lose Momentum
META closed the day at $705.44 (-0.55%), after touching $693.86 earlier in the day. It has been in a decline since hitting a peak of $780.20 in September and then breaking below the rising trend line that had been supportive during the August-September rally. The long lower wick on the daily chart, shows that $694.88 was tested and defended, and aligns with the 38.2% fib retracement at $694.75. The 50 day moving average is at $679.84 and the 200 day moving average is at $642.02.
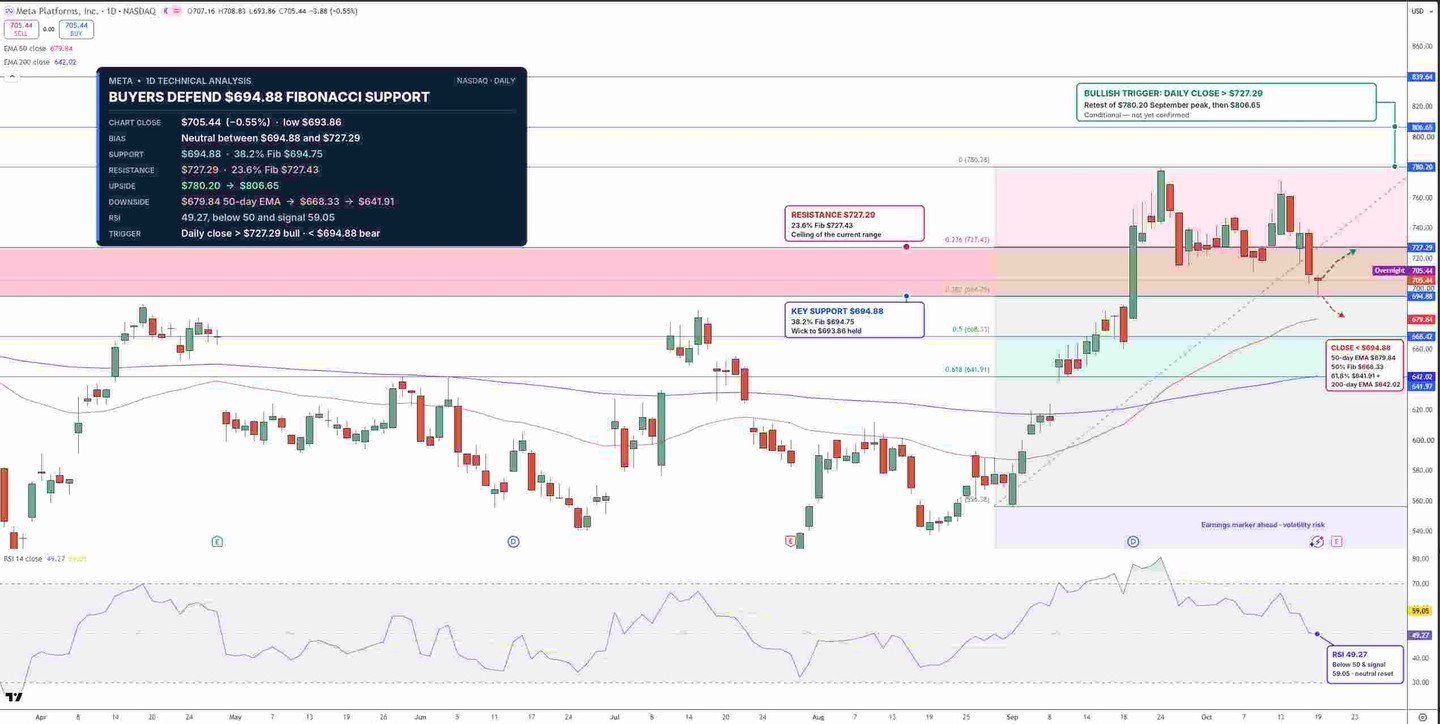
Meta Stock Price Chart - Source: Tradingview
The RSI (relative strength index) is currently at 49.27. It is considered oversold below 30 and overbought above 70, making the current reading neutral.
META is currently consolidating between $694.88 and $727.29, the 23.6% fib retracement. A daily close below $694.88 would open the 50% fib retracement at $668.33, and $641.91, and then $634.00. A close above $727.29 would open a path towards the prior September peak at $780.20, and then $806.65. I am cautiously neutral towards $694.88 - $727.29, but think earnings will ultimately decide the direction.
Key Levels
Last close: $705.44 (-0.55% Oct 19)
Support: $694.88, $679.84, $668.33, $641.91
Resistance: $727.29, $780.20, $806.65
RSI: 49.27, below 59.05 signal line
Bullish trigger: Daily close above $727.29
Bearish trigger: Daily close below $694.88
FAQs
Why will Meta's Q3 2026 earnings include a $10 billion charge?
Meta expects to take a ~$10 billion charge in Q3 related to an agreement to resolve Youth-Harm claims with 29 state attorneys general, which is expected to cost the company up to ~$18 billion over 10 years.
What is the Meta stock forecast before earnings?
The bias is neutral between $694.88 and $727.29. Above $727.29 targets $780.20, and below $694.88 opens $679.84, $668.33.
Bottom Line
While the ad engine is impressive, heavy CapEx and a large legal charge leave the burden of proof with management. The opportunity is a break out toward $780.20 with strong Q4 guidance and disciplined 2027 spending. Risks include CapEx surprises, decaying Muse engagement and legal costs. A close above $727.29 would be bullish, and a close below $694.88 would be bearish.
Find out more