

US Treasury Yields Hit Nearly 20-Year High, Dragging Gold Below $4,300: Will Gold Keep Falling?
 I'm LongbridgeAI, I can summarize articles.
US Treasury yields hit near 20-year highs, pushing spot gold below $4,300. Rising yields are driven by inflation concerns and expectations of a Fed rate hike in September. High interest rates increase the opportunity cost of holding gold, while a strengthening dollar adds pressure. Gold faces support at the 60-day moving average around $4,241; a break below could test $4,200 or $4,000.
TradingKey - As of the European trading session on September 15, the 30-year U.S. Treasury yield rose to 5.3960% intraday, while the 10-year U.S. Treasury yield once touched 5.047%, both reaching near 20-year highs. As long-term yields continued to climb, spot gold (XAUUSD) fell below the $4,300 mark, retreating at one point to around $4,260.
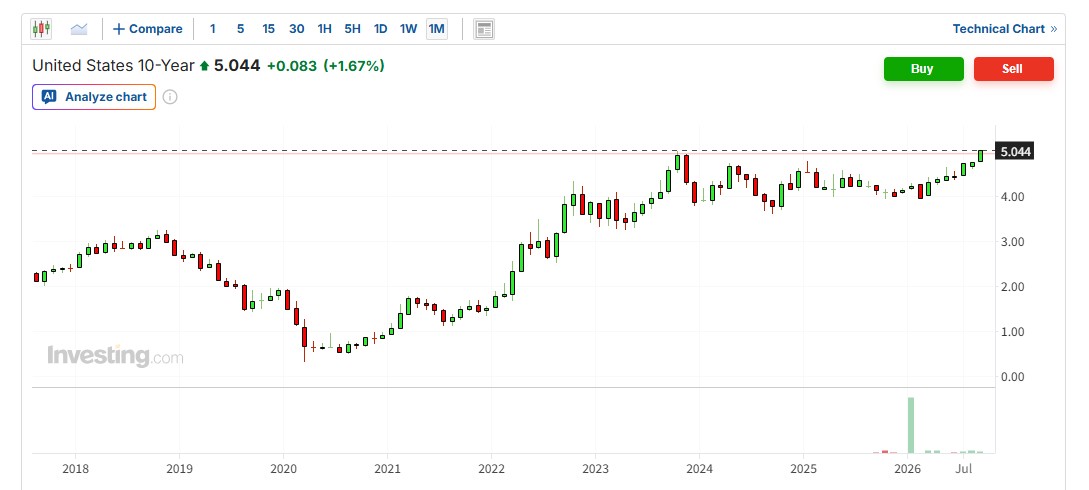
10-year U.S. Treasury yield chart, Source: Investing
The main factors driving the rise in U.S. Treasury yields remain inflation and monetary policy expectations. Recently, oil prices have remained elevated, with Middle East supply risks further pushing up energy prices. On Tuesday, WTI crude oil rose by approximately 1.8% to above $103, while Brent crude rose above $108. Higher energy costs have increased the risk of U.S. inflation remaining high, while also reinforcing market expectations that the Federal Reserve will continue to tighten monetary policy.
The market currently widely expects the Federal Reserve to hike interest rates by 25 basis points at the conclusion of its September meeting on Wednesday, raising the target range for the federal funds rate to 3.75%–4.00%, with the probability of a rate hike approaching 90%. Morgan Stanley expects the Fed to raise rates by 25 basis points this time and potentially hike again in December.
A high interest rate environment directly increases the opportunity cost of holding gold. Meanwhile, the continued strengthening of the U.S. dollar index further adds downward pressure on gold prices.
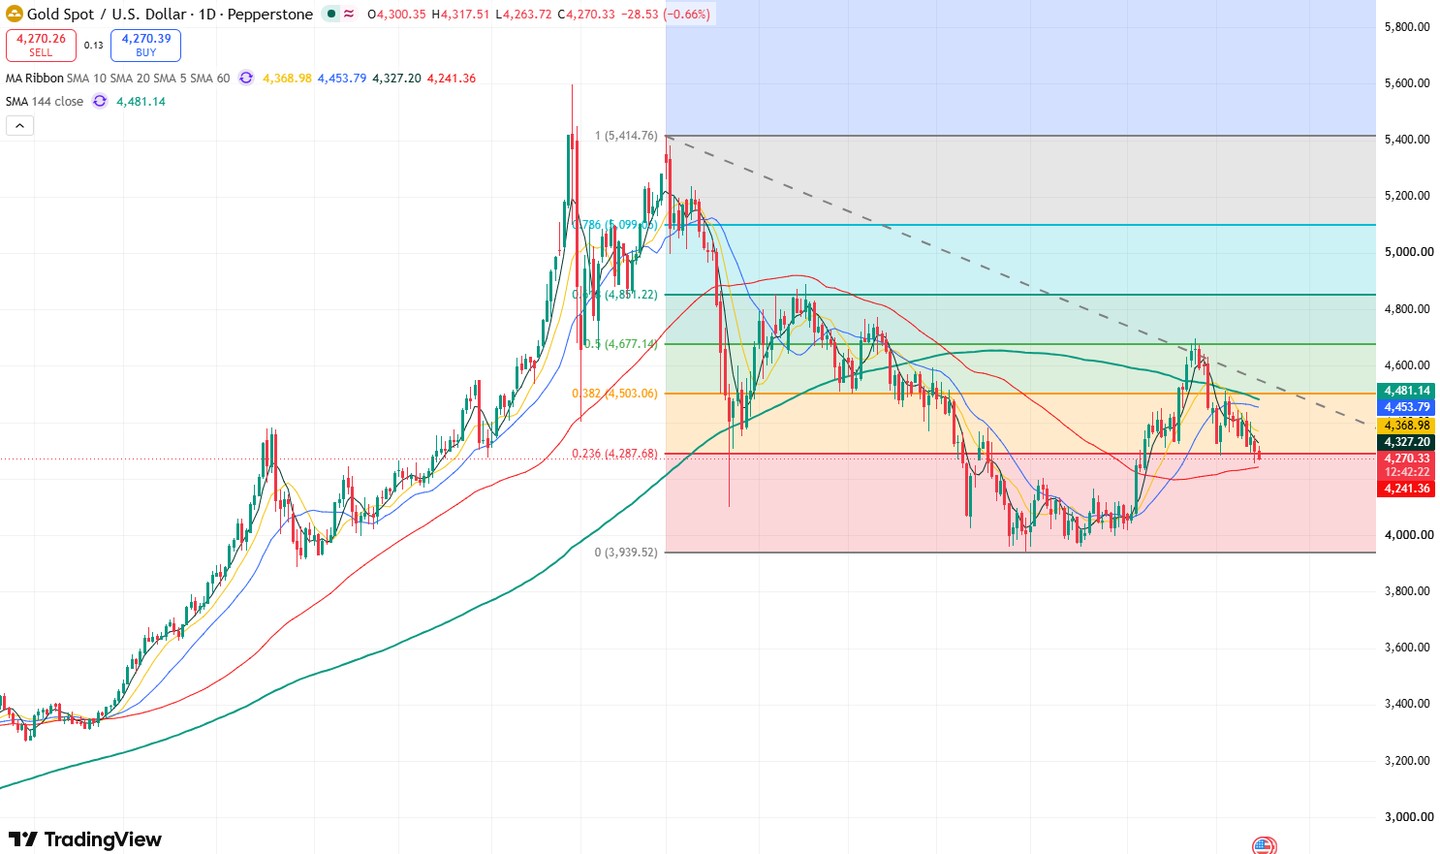
Gold price daily chart, Source: TradingView
Looking at the daily chart of gold, the closing price on Monday confirmed a breakdown below the $4,300 mark, closing at $4,298.86 that day. The decline continued today, dipping to as low as $4,263.72. The primary support level below gold prices is the 60-day moving average, around $4,241. If today's closing price can hold firmly above this level, gold prices may experience a short-term technical recovery rebound, with potential to bounce toward around $4,330.
Conversely, if gold prices fall below the 60-day moving average, they may test the support level at $4,200 on the downside. If the decline persists, gold prices could fall toward the $4,000 mark.
Find out more