

Assessing Parex Resources (TSX:PXT) Valuation After Strong Recent Share Price Performance
 I'm LongbridgeAI, I can summarize articles.
Parex Resources (TSX:PXT) has seen a significant share price increase of 24% in the past month and 45% over the last three months, with a total return of approximately 110% over the past year. Currently priced at CA$26.08, analysts suggest it may be overvalued with a fair value of CA$24.74. Future earnings growth expectations indicate a consensus price target of CA$17.167. Mixed signals on valuation suggest investors should carefully assess risks and opportunities in energy-related materials.
What recent performance suggests for Parex Resources (TSX:PXT)
Parex Resources (TSX:PXT) has quietly put up strong total returns, with the share price up about 24% over the past month and roughly 45% over the past 3 months.
Over the past year, total return sits near 110%, while the year to date move is close to 39%. Those numbers naturally raise questions about what is already priced in and where value might still exist.
See our latest analysis for Parex Resources.
With the share price now at about CA$26.08 and a 30-day share price return of roughly 24%, Parex Resources has picked up clear short term momentum on top of a much stronger one year total shareholder return of about 110%.
If this kind of move has you looking beyond a single name, it could be a good moment to size up opportunities in energy related materials as well, including 8 top copper producer stocks as a starting point for fresh ideas.
With the share price near CA$26.08 and recent total returns already strong, the key question now is whether Parex still trades at an attractive discount or whether the market is already pricing in future growth.
Most Popular Narrative: 5.4% Overvalued
On the widely followed narrative, Parex Resources has a fair value of about CA$24.74 compared with the current CA$26.08, which frames the share price strength in a tighter valuation range.
The analysts have a consensus price target of CA$17.167 for Parex Resources based on their expectations of its future earnings growth, profit margins and other risk factors.
In order for you to agree with the analyst's consensus, you'd need to believe that by 2028, revenues will be $956.5 million, earnings will come to $243.7 million, and it would be trading on a PE ratio of 5.5x, assuming you use a discount rate of 6.0%.
Read the complete narrative.
If you are curious what sits behind that earnings path and compressed future P/E multiple, and how the revenue and margin assumptions fit together over several years, the full narrative lays out those moving pieces in one place.
Result: Fair Value of CA$24.74 (OVERVALUED)
Have a read of the narrative in full and understand what's behind the forecasts.
However, the story can shift quickly if Colombia's regulatory backdrop tightens, or if mature fields demand heavier spending just to keep production roughly where it is today.
Find out about the key risks to this Parex Resources narrative.
Another Angle on Valuation
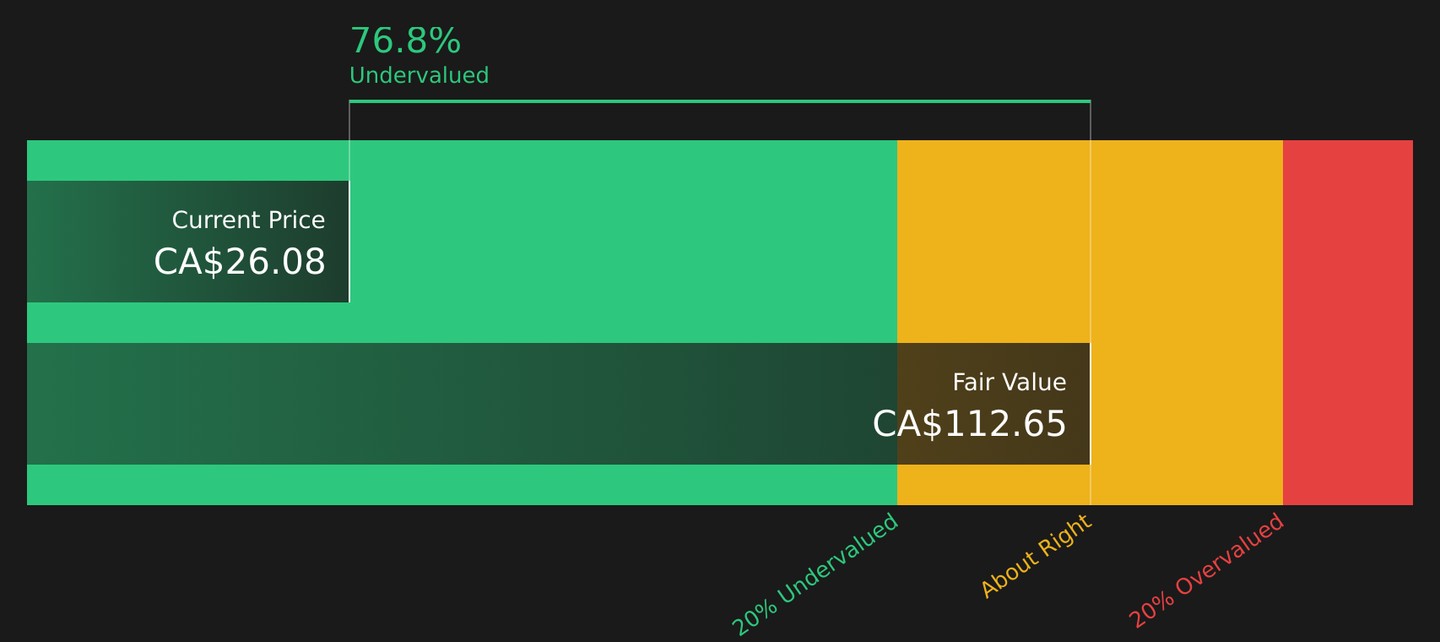
The narrative model pegs Parex Resources at a fair value of about CA$24.74, which points to a mildly overvalued share price against today’s CA$26.08. Our DCF model, however, arrives at a future cash flow value of roughly CA$112.65, suggesting the shares sit well below that estimate. Which lens do you trust more when the gap is this wide?
Look into how the SWS DCF model arrives at its fair value.
Next Steps
With mixed signals on value and sentiment running in both directions, it makes sense to move quickly and weigh the details for yourself using 4 key rewards and 2 important warning signs.
Looking for more investment ideas?
If Parex has caught your attention, do not stop here, use the Simply Wall St screener to spot other opportunities before they move out of reach.
- Target quality at a discount by scanning companies that appear mispriced on fundamentals with our 7 high quality undervalued stocks and see what stands out to you.
- Prioritize resilience by checking out businesses that pair financial strength with cleaner balance sheets through the solid balance sheet and fundamentals stocks screener (10 results) and compare how they stack up.
- Hunt for under the radar potential by running the screener containing 7 high quality undiscovered gems and surface ideas the broader market may not be watching closely yet.
This article by Simply Wall St is general in nature. We provide commentary based on historical data and analyst forecasts only using an unbiased methodology and our articles are not intended to be financial advice. It does not constitute a recommendation to buy or sell any stock, and does not take account of your objectives, or your financial situation. We aim to bring you long-term focused analysis driven by fundamental data. Note that our analysis may not factor in the latest price-sensitive company announcements or qualitative material. Simply Wall St has no position in any stocks mentioned.
New: Manage All Your Stock Portfolios in One Place
We've created the ultimate portfolio companion for stock investors, and it's free.
• Connect an unlimited number of Portfolios and see your total in one currency
• Be alerted to new Warning Signs or Risks via email or mobile
• Track the Fair Value of your stocks
Try a Demo Portfolio for Free