

Out-of-favor HDDs: Why Are They the Last Stop for AI Data?
 I'm LongbridgeAI, I can summarize articles.
In our NAND series, Dolphin Research argued that AI inference has turned NAND from a peripheral data warehouse into a must-have on the compute path, with SSDs effectively becoming a 'token battery' for storage compute.
Yet the market often overlooks another fact: roughly 80% of cloud data still resides on HDDs. The vast data generated by AI ultimately lands mostly in HDDs, the terminal depot for data.
Over the past decade, as laptops, desktops and traditional enterprise drives migrated to SSDs, HDD shipments fell for years and the category was labeled a sunset industry. Western Digital even spun off SanDisk in Feb 2025, leaving itself a pure-play HDD company.
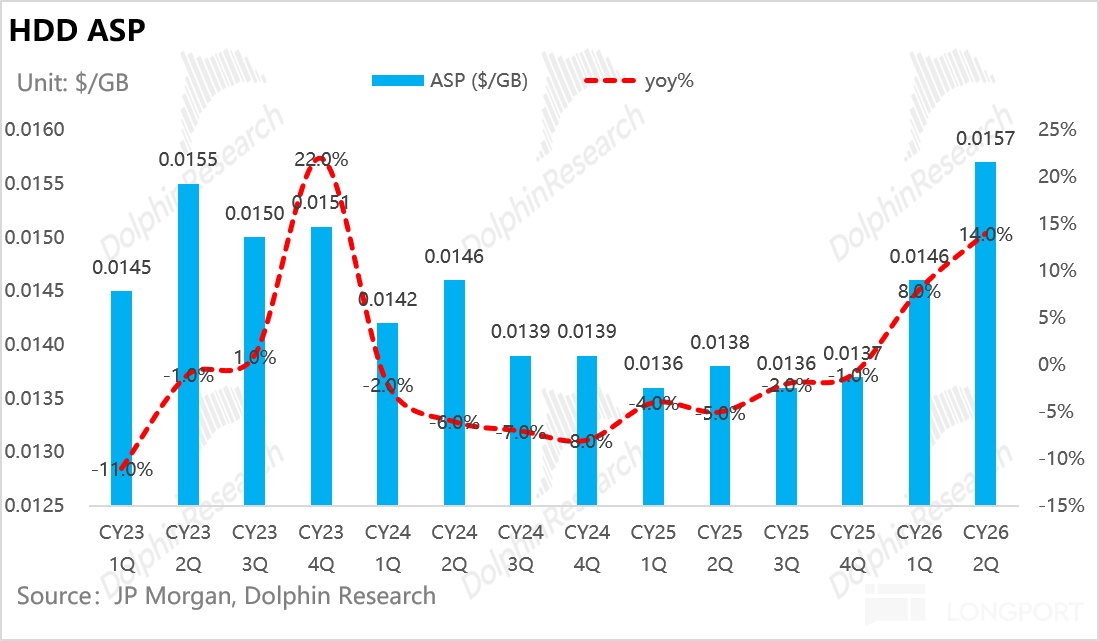
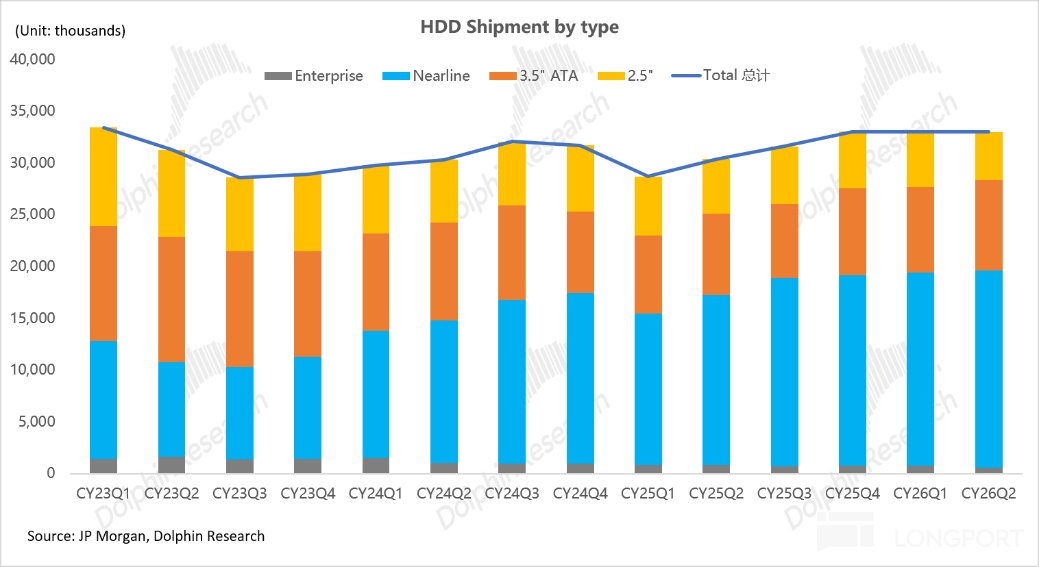
However, this 'sunset' sector is seeing a rare reversal: in Q2 2026, industry-wide HDD revenue surged 47% YoY, driven by both volume and price. Shipped capacity rose 29% YoY and ASP per GB increased 14%. The end of multi-year declines in per-GB ASP and the shift to increases indicate the downcycle has ended.
This note tackles four questions:
1) What is HDD and how is it different from NAND?
2) Why is HDD an oligopoly?
3) Why is supply hard to expand? Can China-based capacity compete?
4) Why are HDDs, long out of favor, becoming the data terminus in the AI era?
Below is the main text:
1) What is HDD and how is it different from NAND?
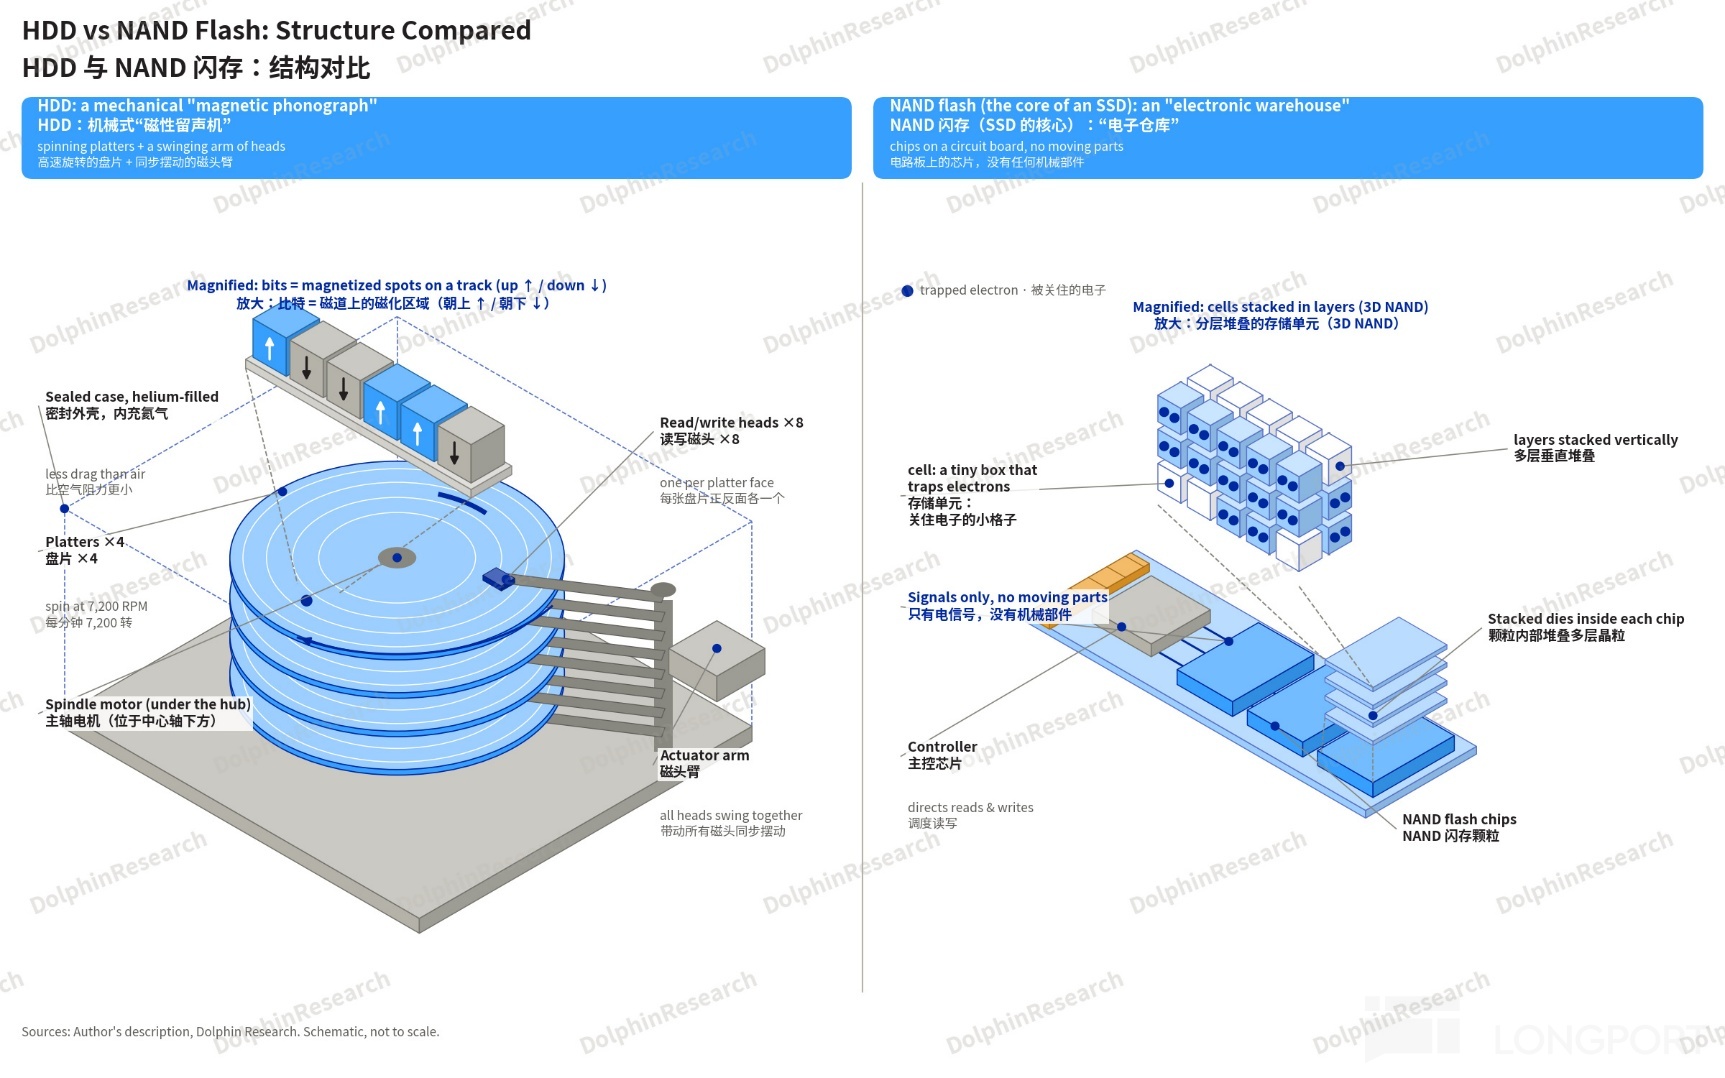
HDDs and NAND flash (the core of SSDs) sit at opposite ends of storage: HDDs are like magnetic phonographs, writing and reading data via heads over spinning platters, while NAND is like an electronic warehouse, trapping electrons in cells. HDDs are cheap, high-capacity and tolerant of repeated writes but slow to read; NAND is fast and solid-state but pricier with write endurance limits.
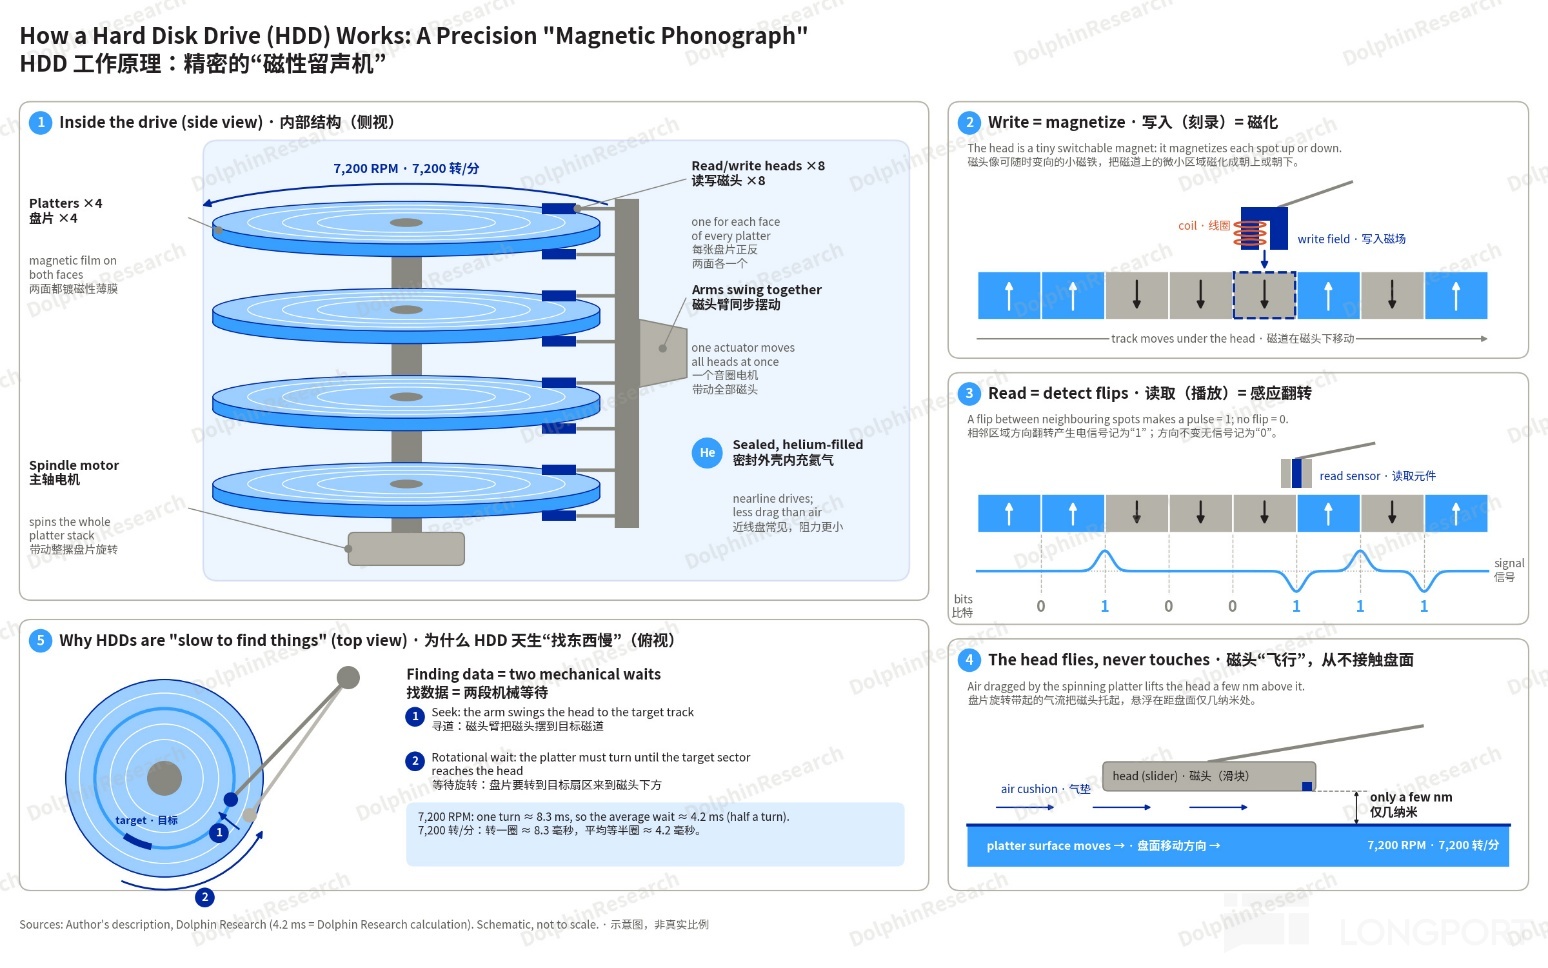
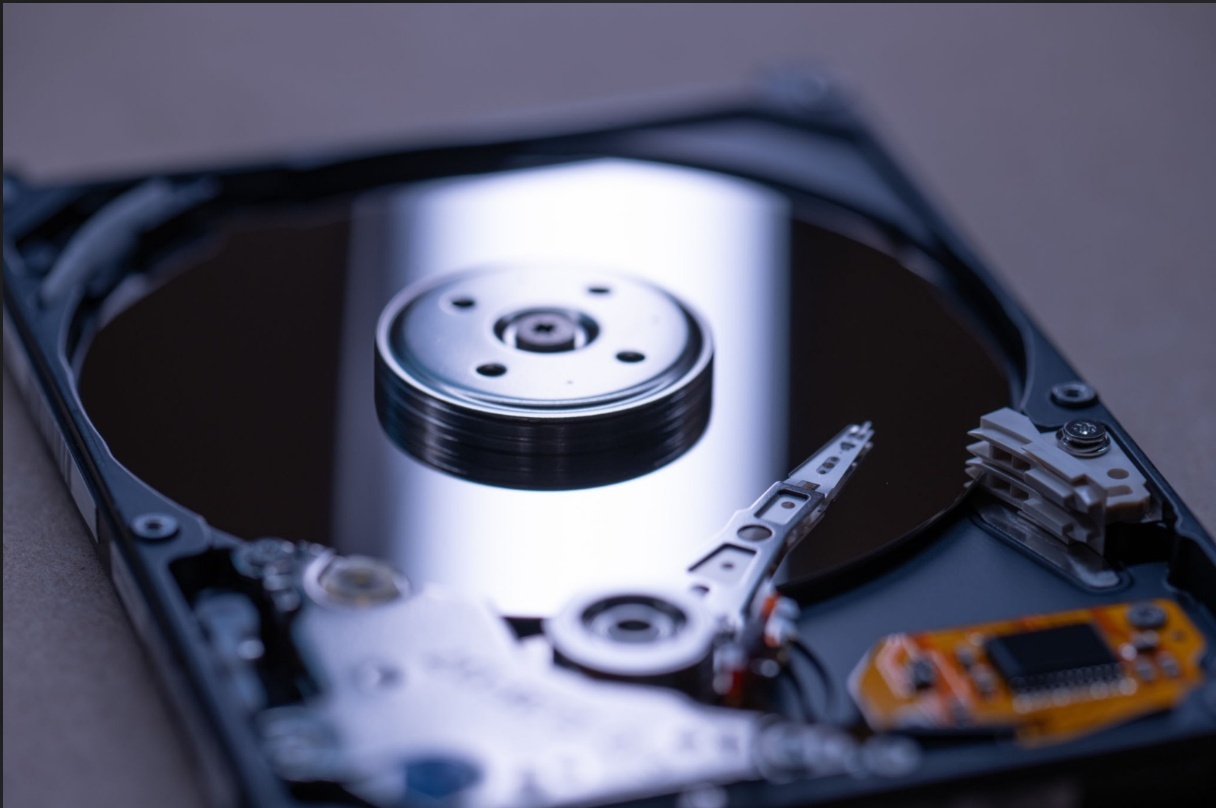
Inside an HDD are stacks of high-speed platters (nearline drives often use helium to reduce drag) and a set of synchronized actuator arms. Heads magnetize tiny areas along tracks as up or down to encode 0s and 1s, flying mere nanometers above the surface. Because the arm must seek and then wait for the target sector to rotate under the head, HDDs are inherently slow at random access.
NAND, with no moving parts, comprises tens of billions of tiny transistors: writes push electrons into the charge storage layer, and reads infer the stored value from threshold voltages.
These physics lead to divergent performance, use cases and industry structures:
a. Endurance: HDDs encode data by magnetic orientation and can flip repeatedly without wear. NAND’s oxide ages with each program/erase, limiting P/E cycles.
b. Speed: HDD random access is 5–15ms, or roughly hundreds of IOPS. NAND responds in tens to ~100 microseconds, delivering hundreds of times more random IOPS, making it fit for hot/warm data, while HDDs suit warm/cold data with mostly sequential reads/writes.
c. Manufacturing: HDDs are assembled from motors, heads, platters and enclosures, so each incremental drive needs a full bill of materials. NAND is 'printed' in fabs, and stacking more layers lifts die output by ~30% annually without new fabs, explaining why NAND supply is hard to constrain while HDD supply is OEM-controlled.
2) Why is HDD an oligopoly?
Before AI, HDDs were a mature, cyclical, commoditized market with limited growth, often seen as a cash cow in decline. The oligopoly kept losses in check, but growth was slow, volatility high and demand visibility low.
From the 1990s to early 2010s, over a dozen players including Conner, Quantum, IBM, Maxtor, Fujitsu, Samsung and Hitachi fought for share and price, leaving industry profitability fragile.
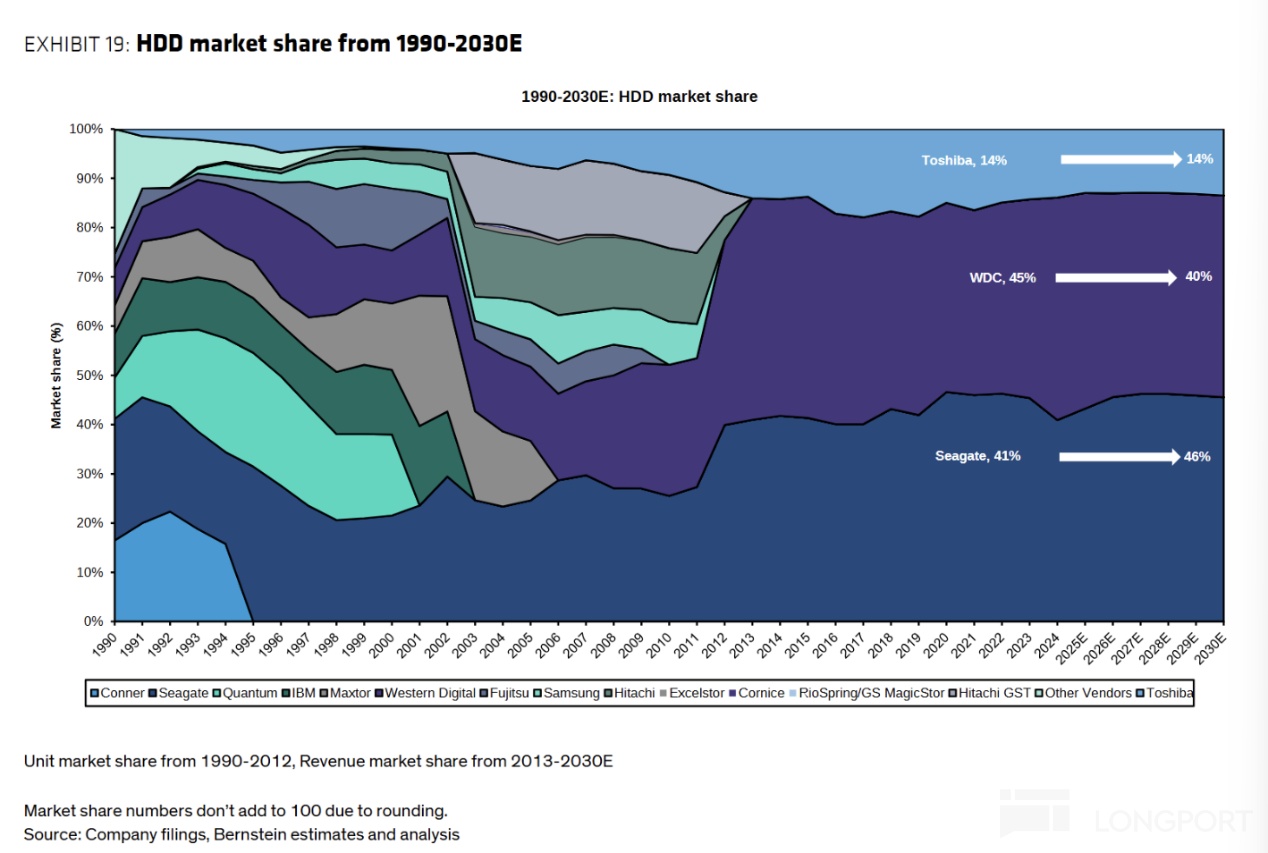
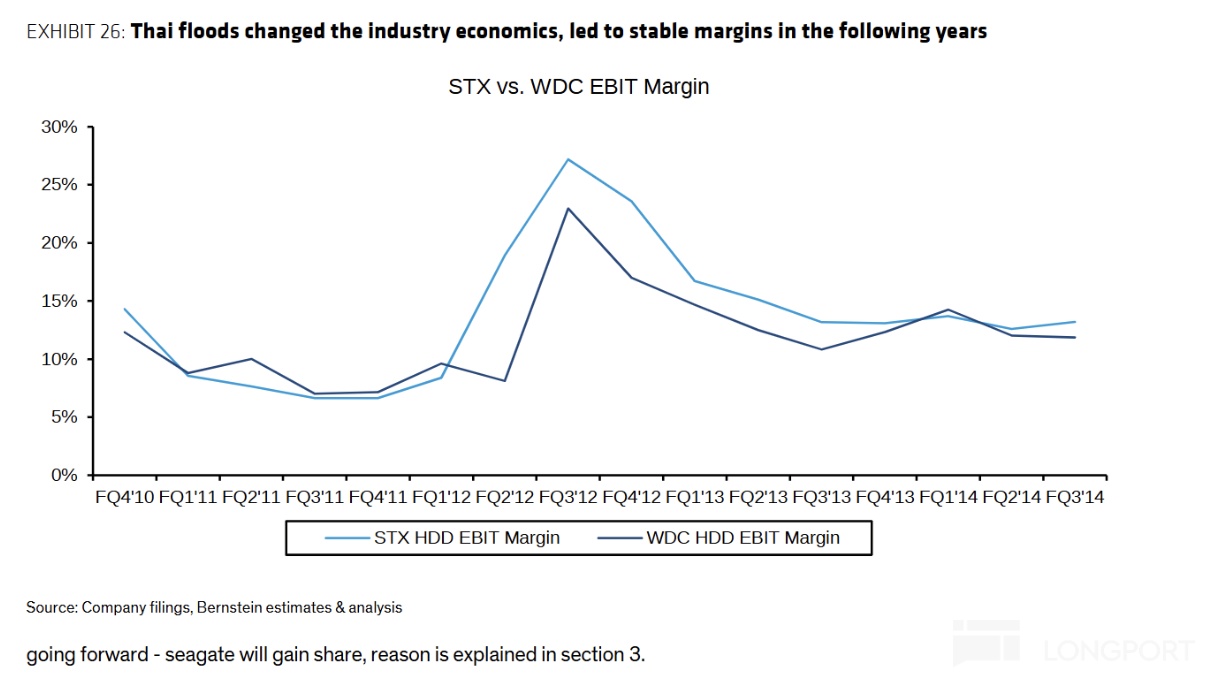
In 2011–2012, consolidation culminated with Seagate buying Samsung’s HDD business and Western Digital acquiring Hitachi GST. During deal close, catastrophic floods hit Thailand in Oct 2011, which housed about 53% of global HDD capacity and key component plants, impacting the entire industry.
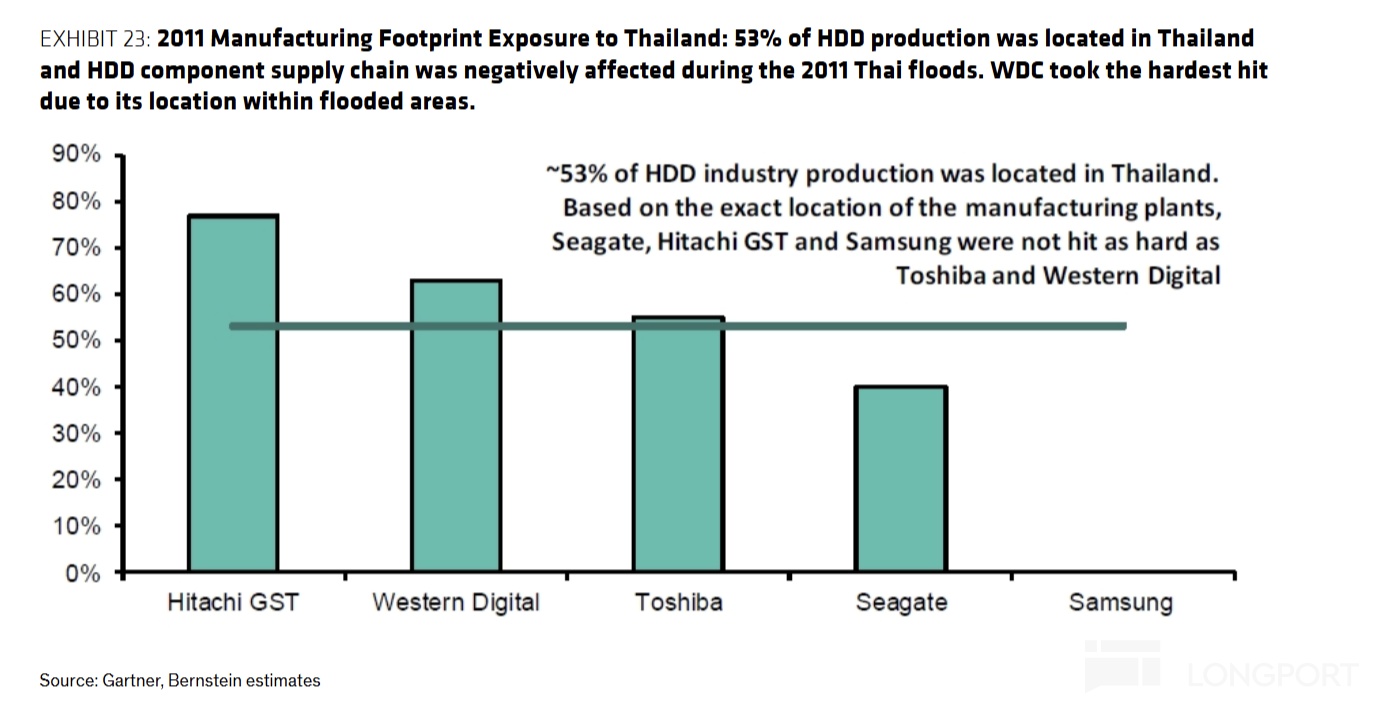
The floods had three far-reaching effects:
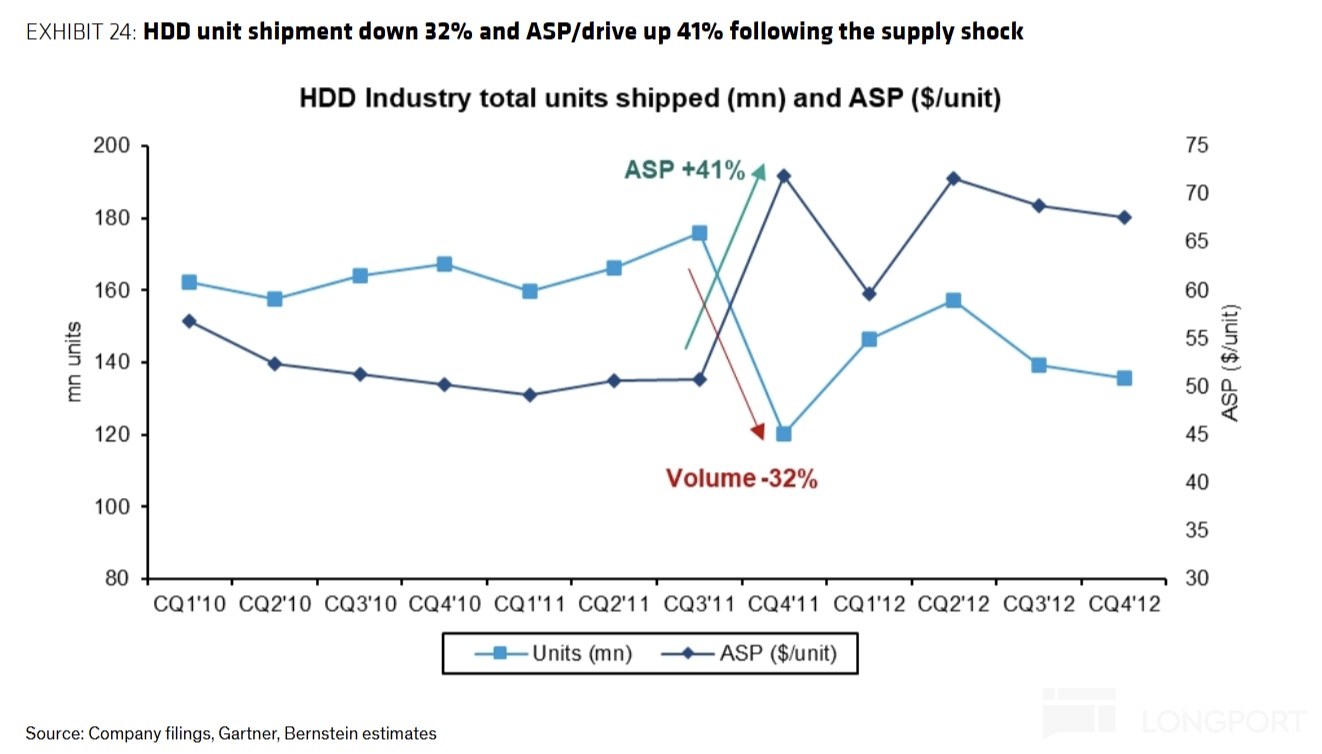
a. Short-term volume down, price up: In Q4 2011, shipments fell from 176mn units in Q3 to 120mn (-32%), creating severe shortages as ASP per drive rose ~41%.
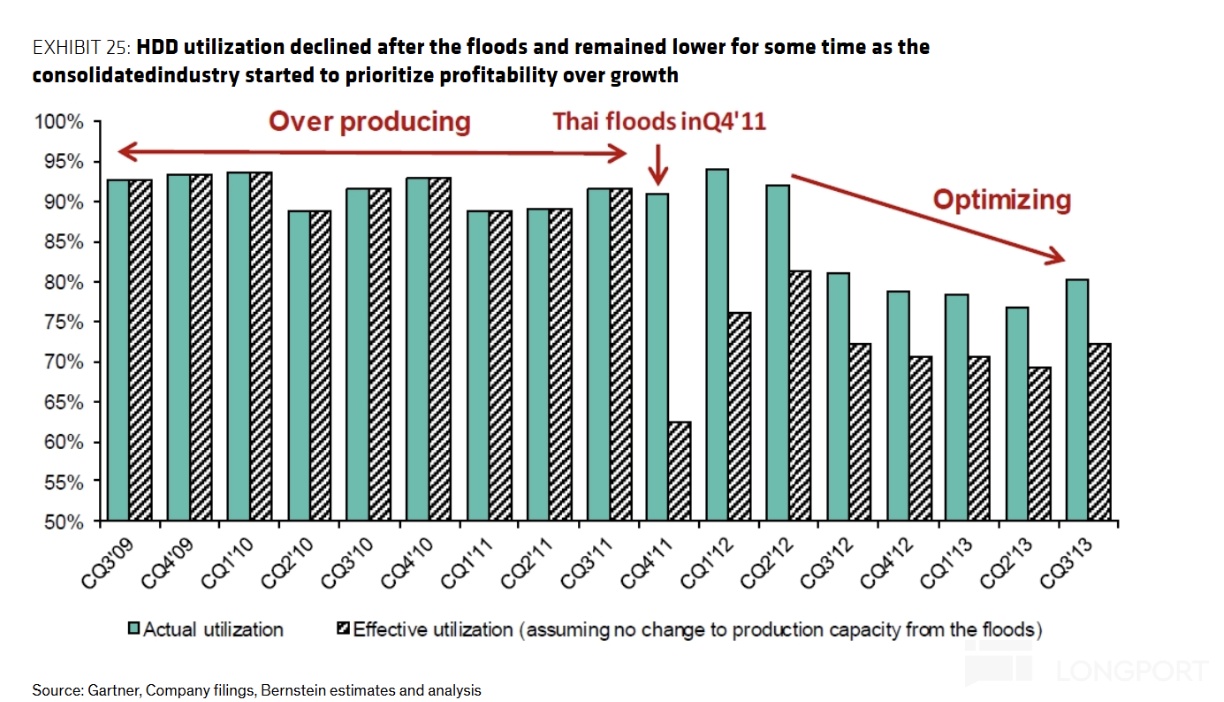
b. Demand never fully returned: By Q2 2012, most capacity was back, but elevated post-flood pricing accelerated PC weakness and SSD substitution. Quarterly shipments never reclaimed the 176mn peak, and utilization fell from ~90% to 77%–81%.
c. Profit midpoints rose: Pre-flood OPM for Seagate and Western Digital was about 6%–7%. Shortages pushed OPM to 27% and 23% in 2012, then stabilized at 11%–16% (mid-teens around 13%), nearly doubling from pre-flood levels.
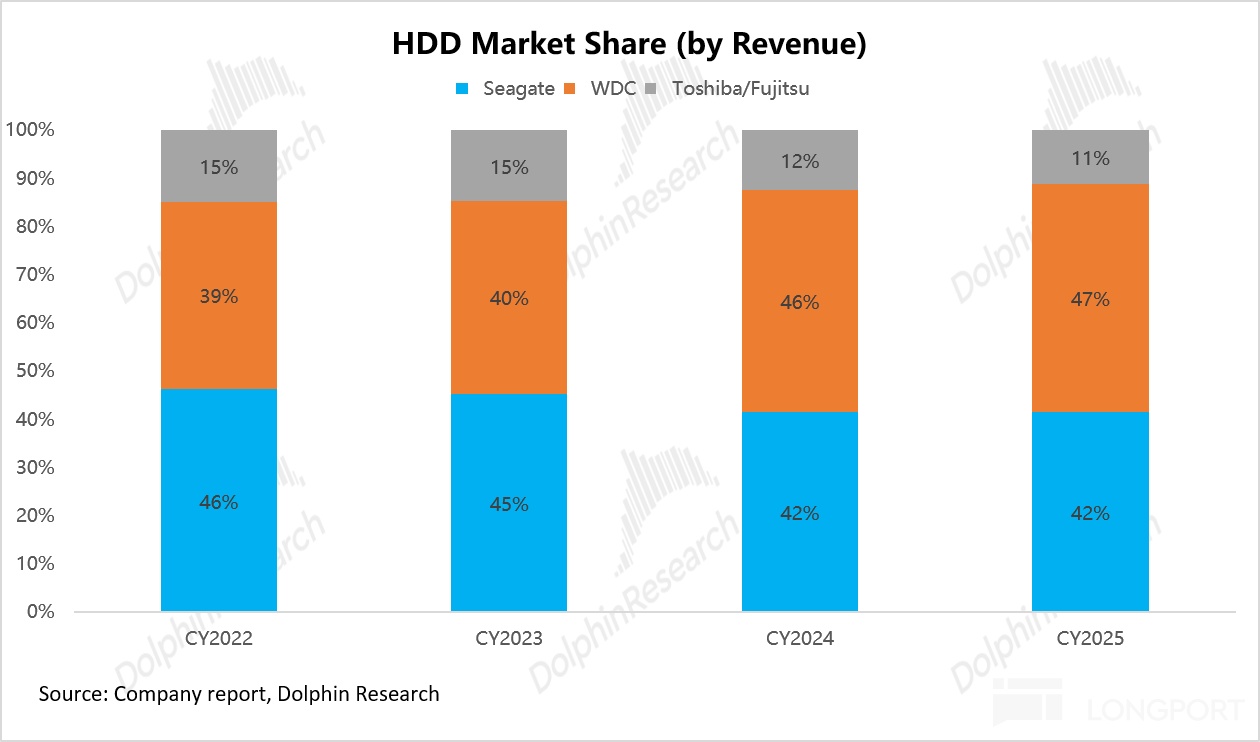
Post-mergers, only Seagate, Western Digital and Toshiba remained (2025 revenue shares of ~47%, ~42%, ~11%). After the floods, cloud hyperscalers like Microsoft, Google and Amazon signed multi-year LTAs with Seagate and Western Digital, shifting HDDs from boom-bust commodity cycles to more stable, predictable models.
More importantly, the flood and subsequent demand erosion forged rational supply behavior among survivors. They avoided restarting price wars and aligned on a profit-over-share discipline that persists today.
3) Why is supply hard to expand? Can China-based capacity compete?
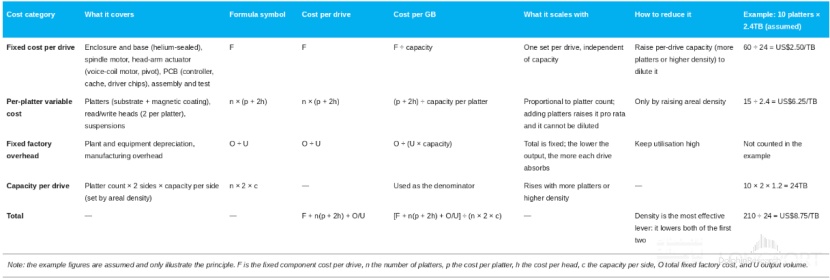
Shipped capacity equals units times capacity per drive, which in turn hinges on platter count and areal density (bits per square inch). Thus, there are three expansion levers with very different economics.
a. Add units: Build or restart lines. Each drive needs a full set of motors, heads, PCBs and enclosures, with little per-TB cost relief.
b. Add platters: Fit more platters into the same HDA. Each extra platter requires another platter and two heads, the costliest nearline components, with diminishing capacity gains per added platter (10 to 11 is only +10%).
c. Raise areal density: Keep parts constant while storing more per platter, spreading fixed costs and offering the best economics. This is why Seagate and Western Digital are avoiding unit additions in this AI cycle.
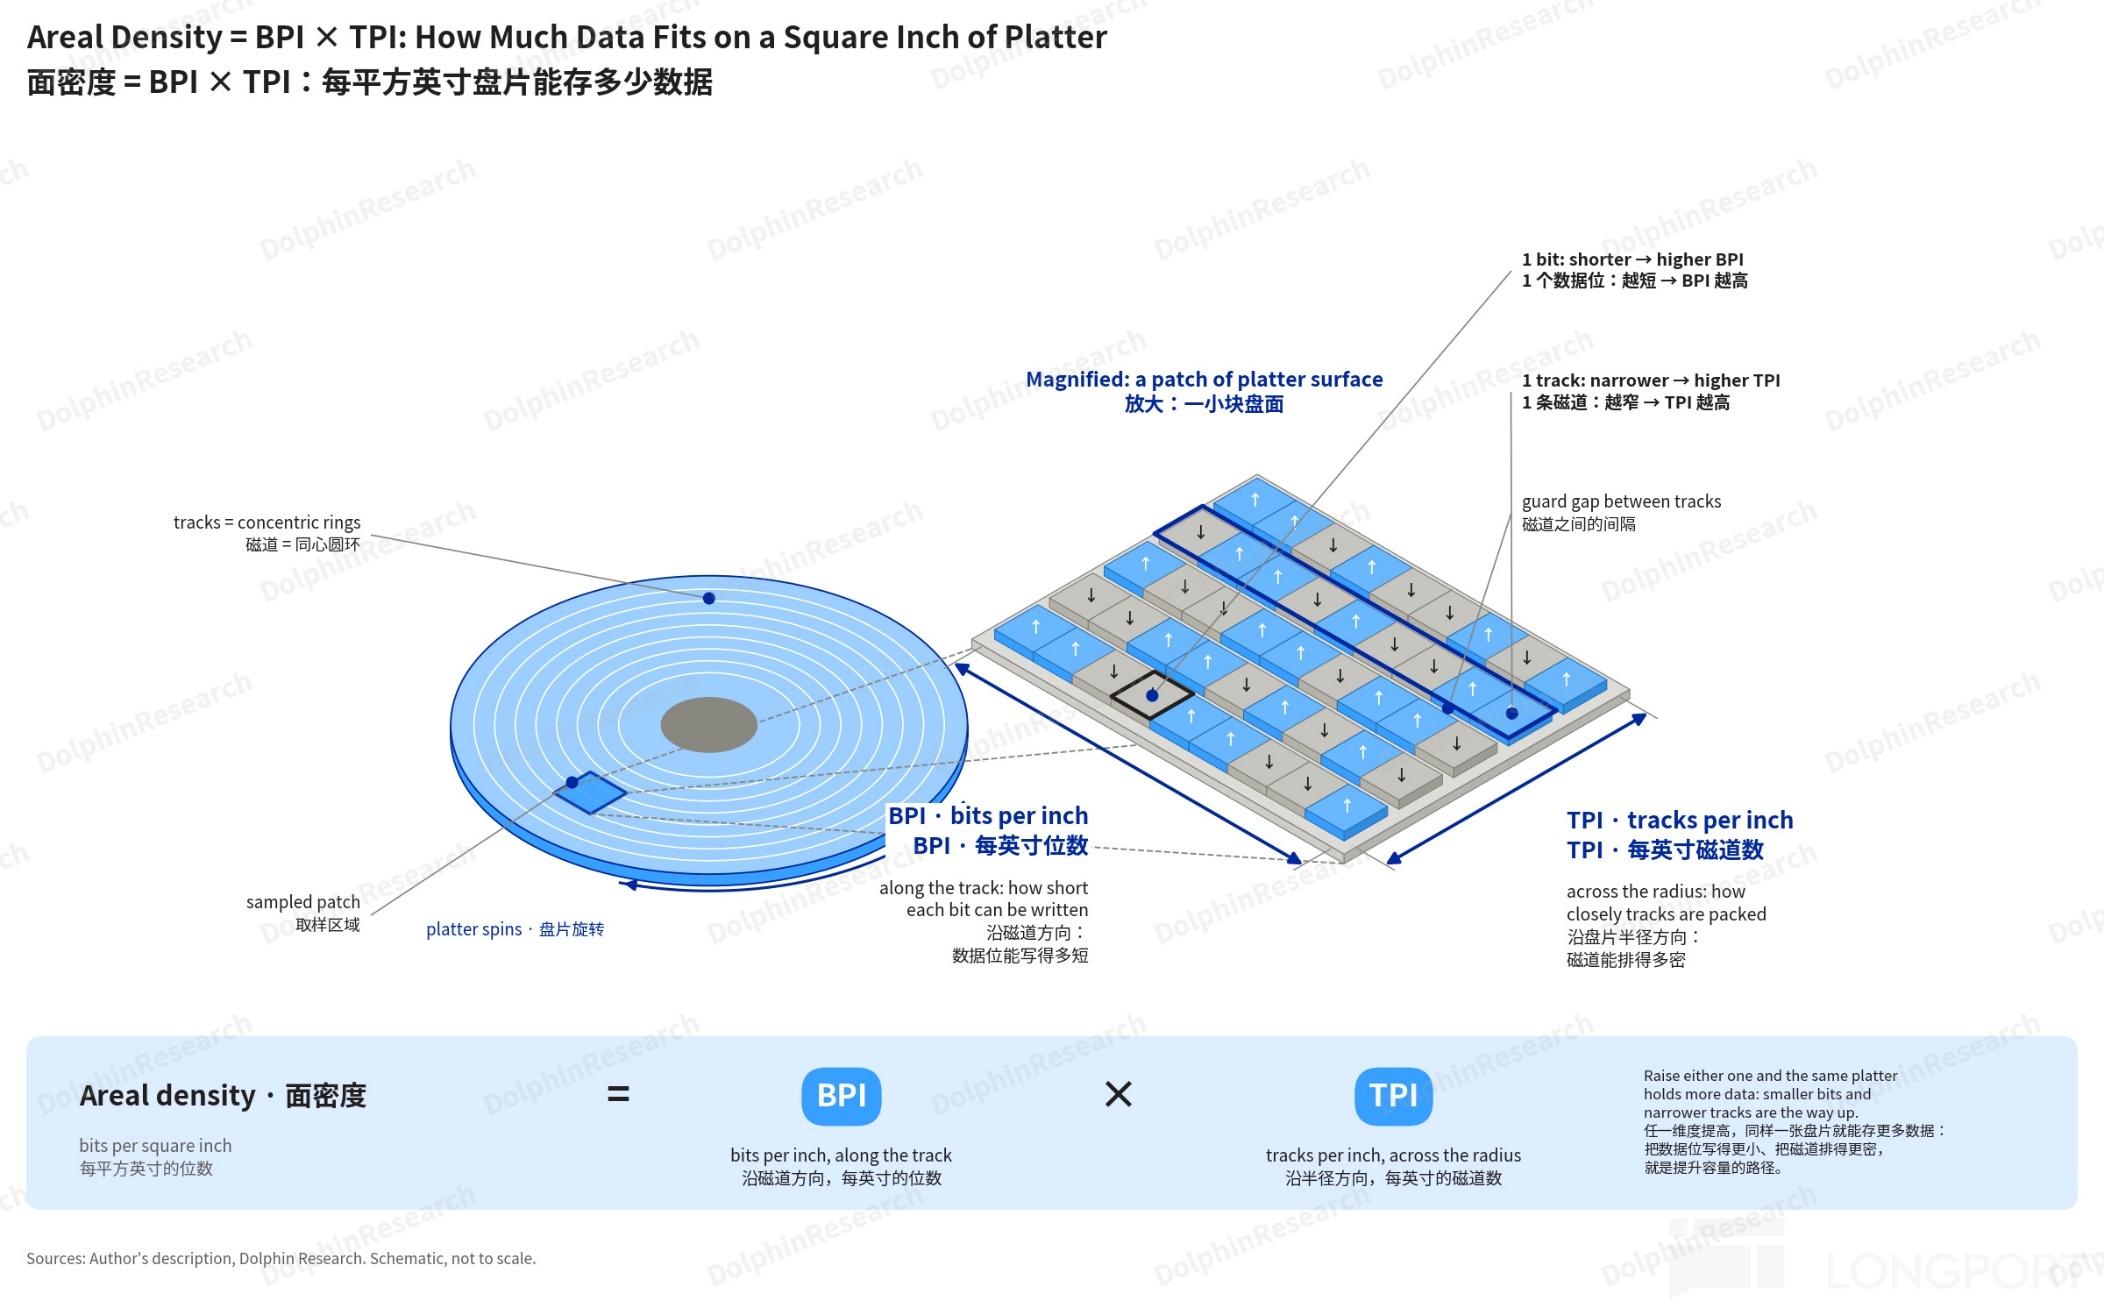
1. Technology: areal density drives cost, with Seagate pulling ahead via HAMR
Conventional PMR is at physical limits: smaller bits are thermally unstable, while harder magnetic media are unwritable by normal heads. The industry moved to energy-assisted recording.
HAMR (heat-assisted): a laser heats media at write-time, making hard media temporarily pliable, like softening hardened wax before stamping. It overhauls substrates, media, heads and controllers, with the highest difficulty and potential, and Seagate leads.
MAMR/ePMR: microwaves or assist currents help writes with smaller changes and lower costs but limited gains, led by Toshiba and Western Digital respectively.
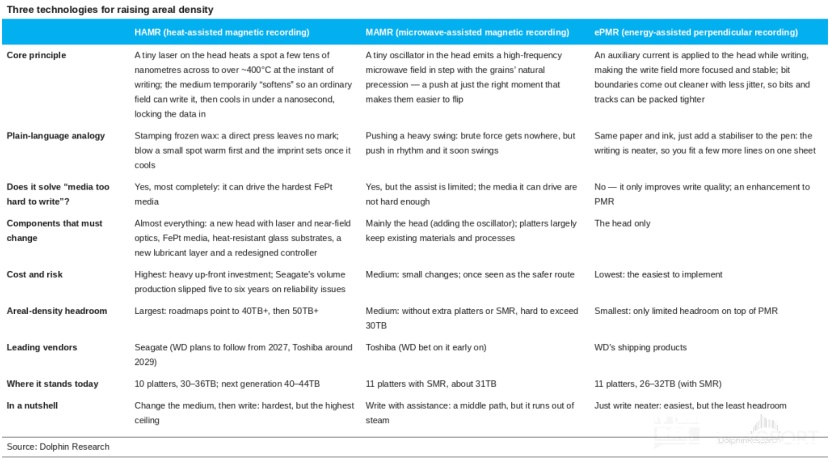
Strategies diverged accordingly:
Seagate: two decades on HAMR, pain then gain
HAMR required replacing substrates, media, heads and controllers. Original commercialization targets in 2018–2020 slipped to 2024–2025 on technical and reliability issues.
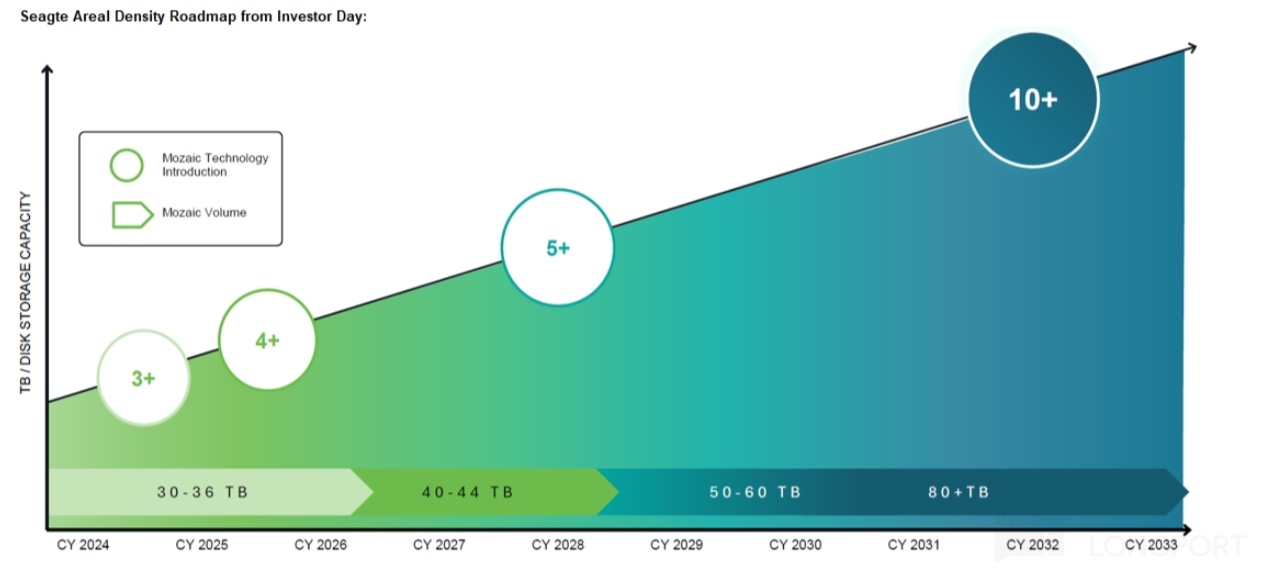
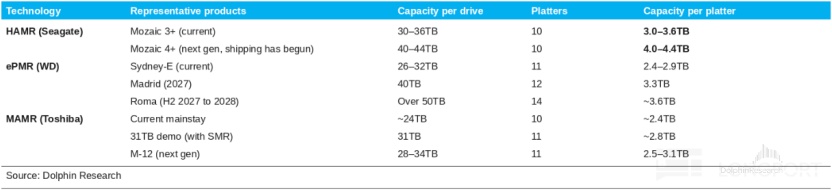
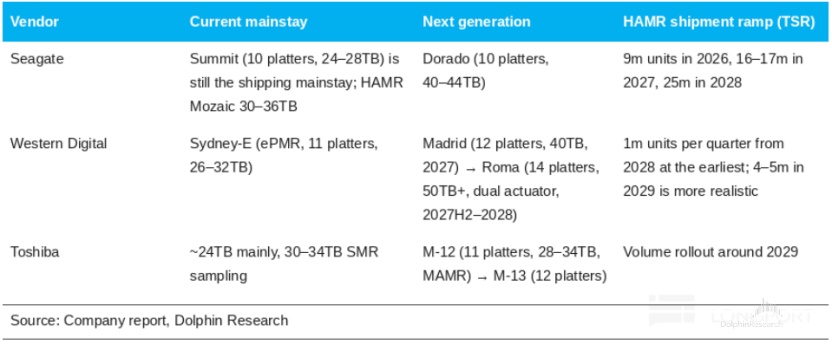
Persistence paid off: Mozaic 3+ (10-disk, ~30TB) has cleared major cloud qualifications and is ramping. Mozaic 4+ achieves 44TB with similar platter and head counts, about 47% higher vs. prior gen, and can scale to 50–60TB+ via areal density alone.
Western Digital: adding platters before HAMR matures
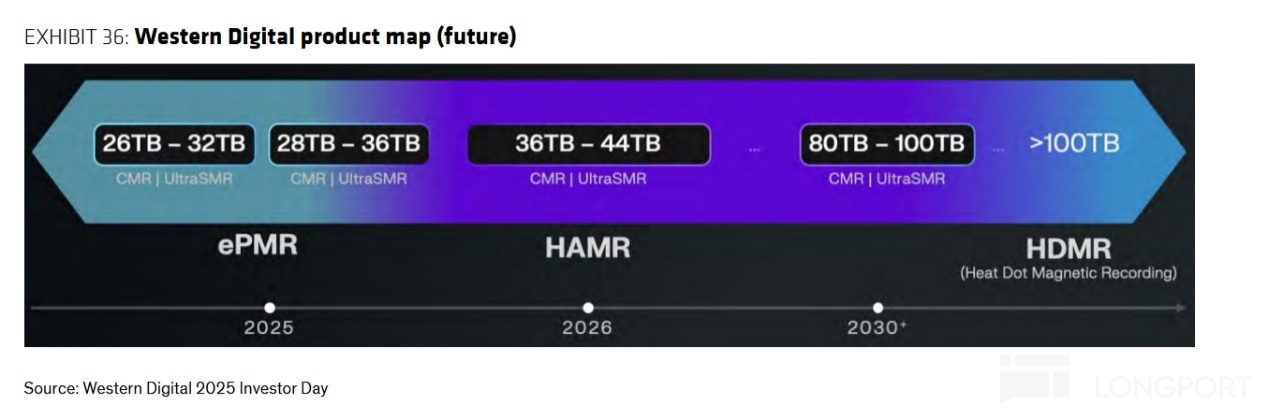
It first favored MAMR/ePMR and only pivoted to HAMR in 2023–2024. Before that, it expanded by adding platters: from 11 disks (26–32TB) to 12 (40TB) to 14 (50TB+).
Western Digital says it trails Seagate in HAMR by ~1 year, but TSR estimates it may only reach ~1mn units per quarter around 2028, implying a roughly two-year lag in practice.
Toshiba: sticking with MAMR, relying on SMR and more platters
Toshiba’s areal density lags materially: by single-platter capacity, Seagate’s HAMR is ~3.0–3.6TB now and 4.0–4.4TB next-gen, Western Digital’s ePMR is ~2.4–2.9TB, while Toshiba’s MAMR is ~2.4TB. Its HAMR won’t fully roll out until around 2029.
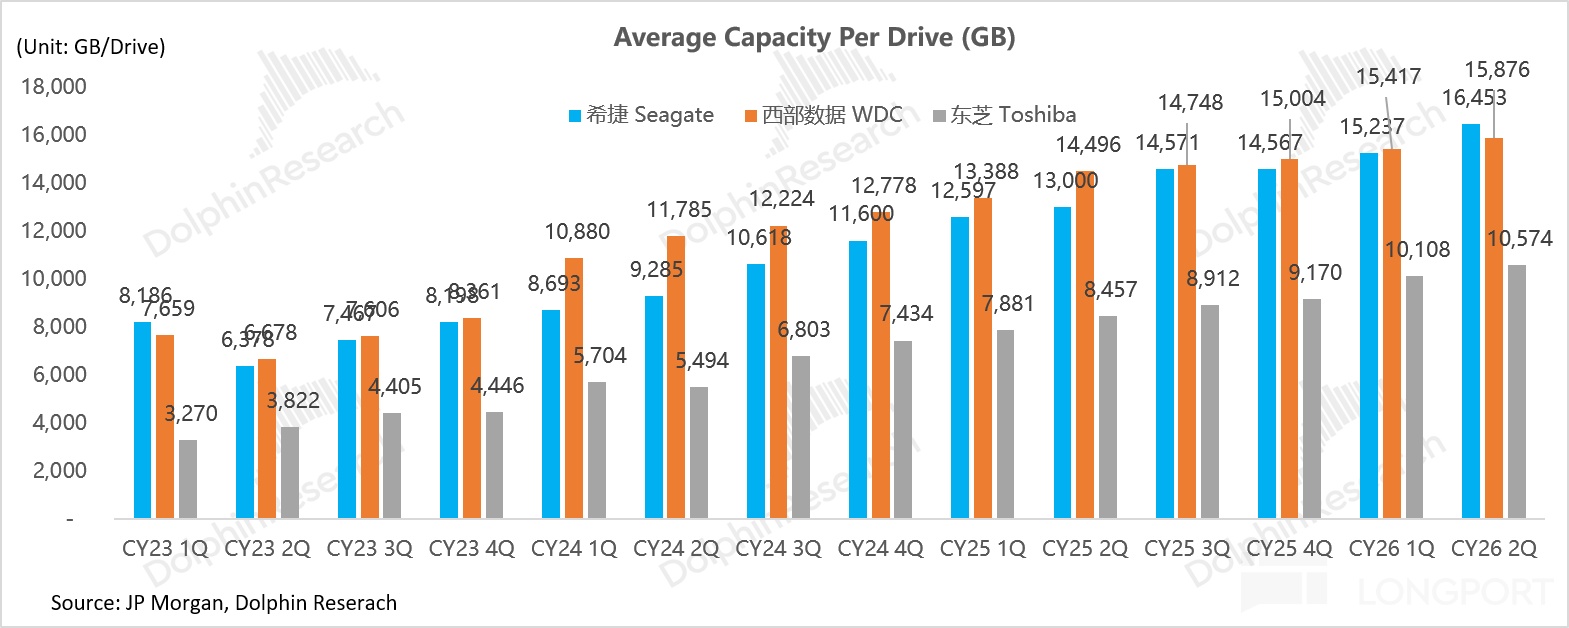
The gap shows in shipments: in Q2 2026, as HAMR ramped, Seagate’s avg. capacity per drive rose to 16.5TB (+27% YoY), surpassing Western Digital’s 15.9TB (+10% YoY) for the first time, while Toshiba was ~10.6TB.
In short, the current playbooks:
a. $Seagate Tech.US focuses on density gains: locking a 10-disk architecture and lifting per-platter capacity via HAMR, delivering the deepest cost-down.
b. $Western Digital.US adds platters: until HAMR matures, it must meet capacity needs with 11–14 disks, limiting cost-down headroom.
c. Toshiba adds platters and lines: trailing in areal density, it relies on capacity additions to chase shipments, with the lowest capital efficiency.
Cost-down matters more in HDD than in NAND:
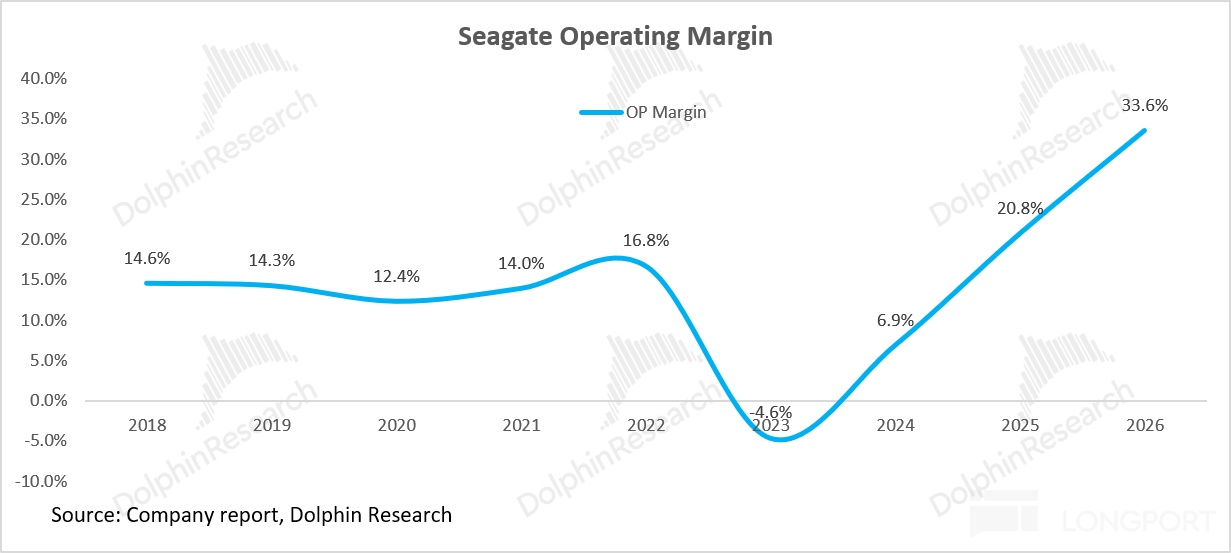
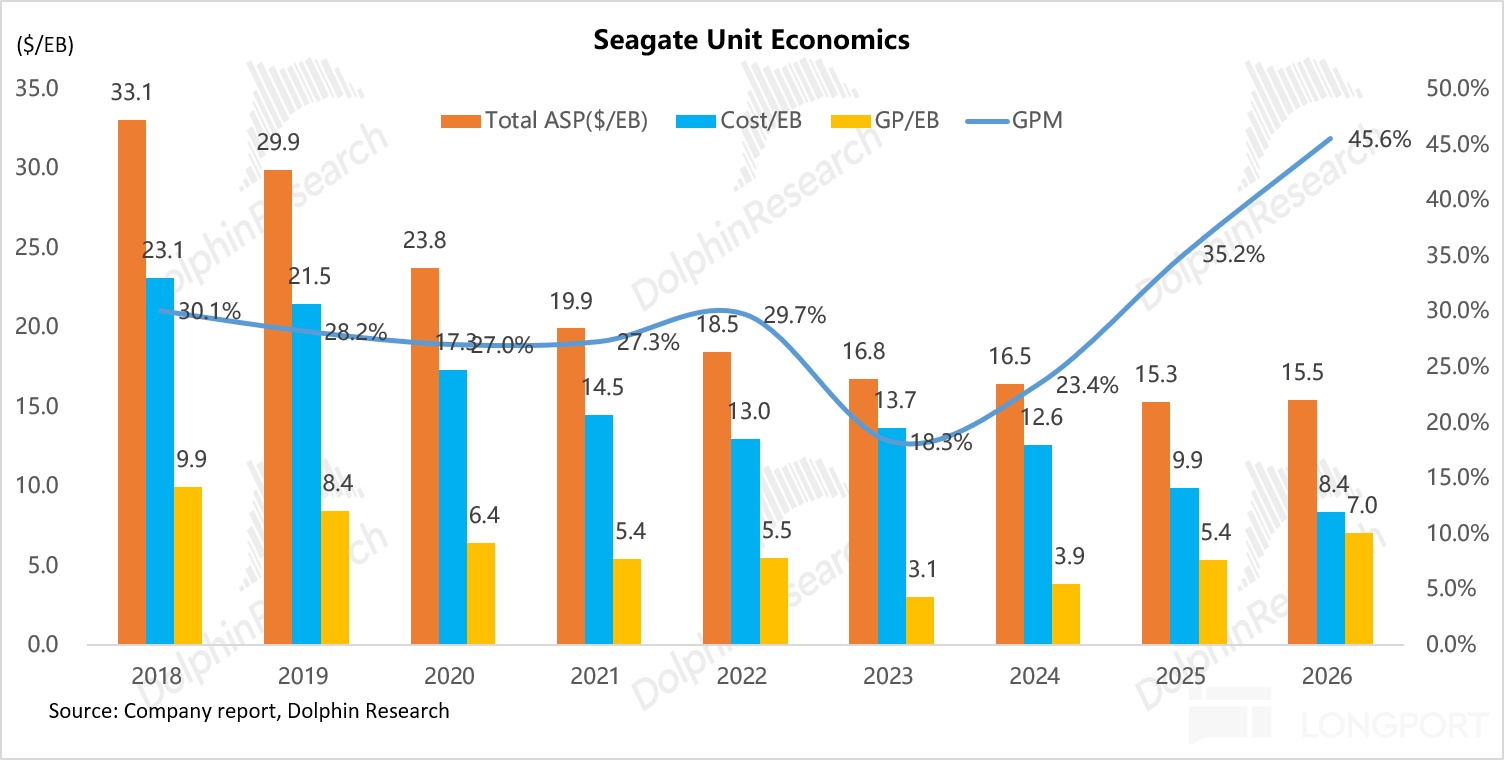
In FY26, SanDisk’s GPM jumped from 30% to 72% on a 139% YoY ASP increase. Seagate’s GPM rose from 35% to 46% with only ~1% ASP increase, driven by roughly 15% per-TB cost reduction.
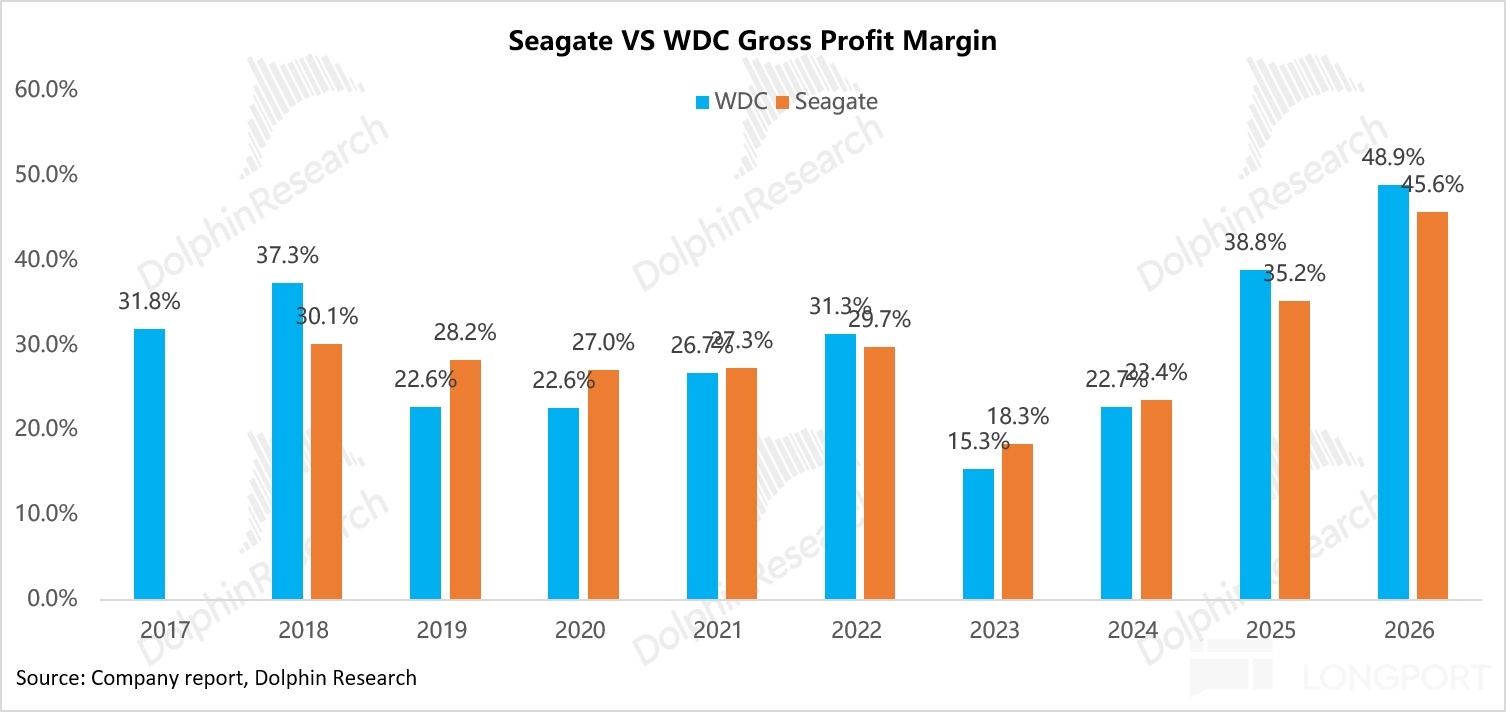
From FY23 to FY26, Seagate’s GPM climbed from 18% to 46%, almost entirely from cost-down. Historically, HDD costs also fell, but prices fell in tandem, passing gains to customers; this time, with prices stabilizing and rising, more cost savings accrue to OEMs.
Under similar pricing discipline, the faster cost reducer earns higher margins, which is the value of areal density leadership. HAMR yields are still ramping, putting per-GB costs roughly on par with ePMR, one reason Western Digital’s GPM is slightly higher than Seagate’s in FY25–FY26.
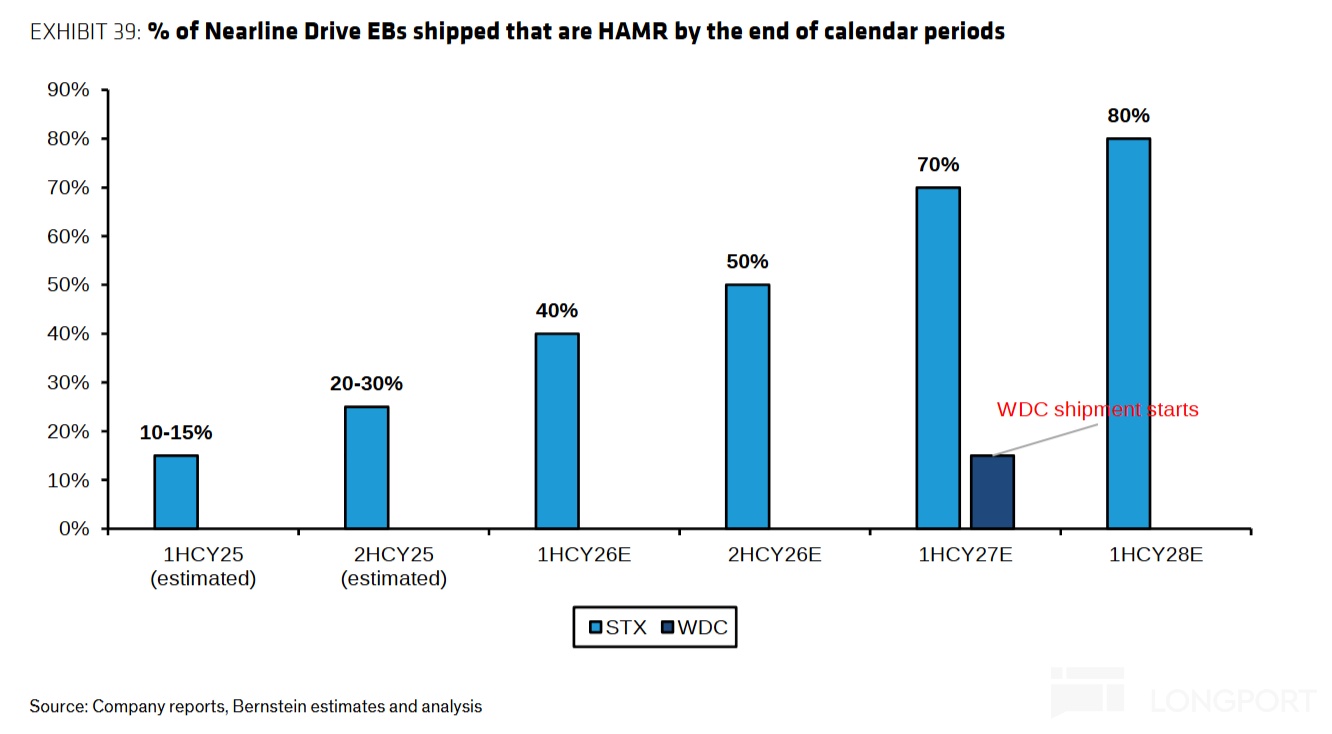
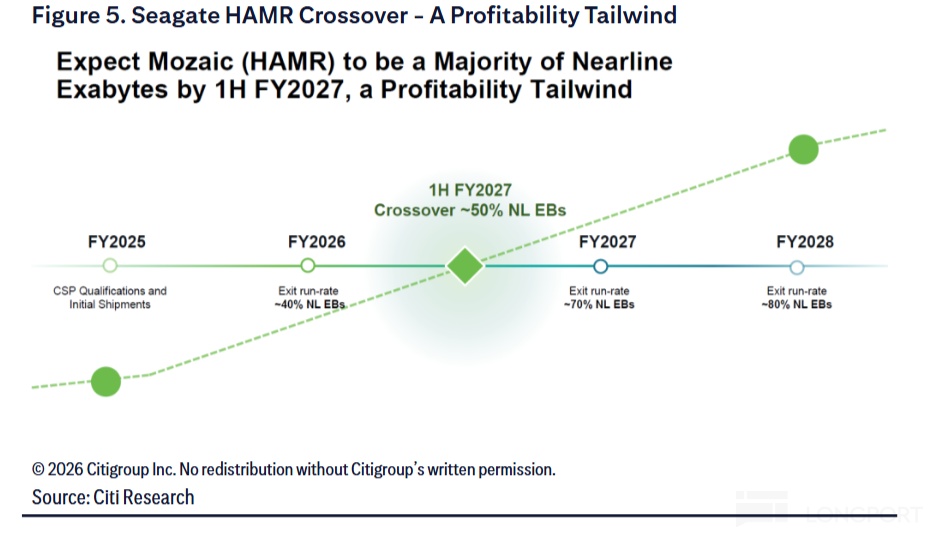
As HAMR scales, this should flip: Seagate expects HAMR to rise from 40% of nearline shipped capacity by end-FY26 to 70% by end-FY27. Its 40TB+ products should also ramp about a year ahead of Western Digital.
2. Bottlenecks: money is not the constraint; components and time are
Despite undersupply, near-term HDD capacity is hard to lift. MS estimates nearline demand growing 40%–50% per year by capacity vs. supply at 30%–35%, implying a ~300EB shortfall in 2026 (10%–15% gap), widening to ~400EB in 2027–2028.
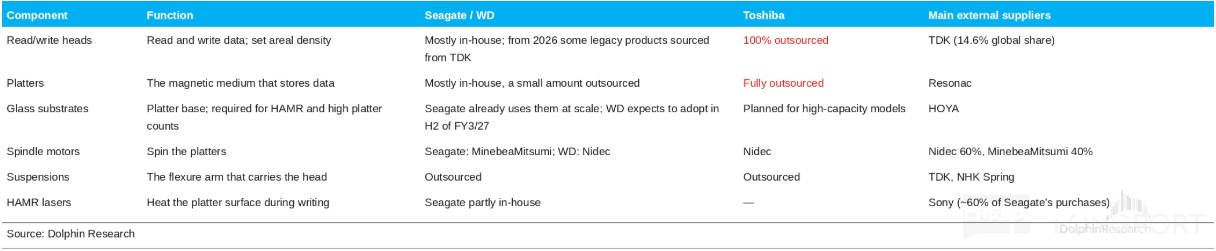
i) Components: in-house is insufficient and outsourcing is hard to scale
Seagate and Western Digital mainly self-supply heads and platters, but their in-house capacity reflects a decade of market contraction. Component demand is now growing faster than system output for two reasons.
Each drive uses more: nearline drives need ~20 heads on average vs. ~12.6 industry-wide. Western Digital’s extra platter strategy requires an extra platter and two heads per add.
Tech transitions absorb internal capacity: HAMR heads integrate lasers and yields are still ramping, so Seagate prioritizes HAMR in-house, suppressing head output for legacy products and pushing some to external sourcing.
Heads and platters are closer to semis and materials, making capacity adds slow:
Heads: thin-film deposition and lithography define read/write elements on wafers, followed by dicing and lapping. Only Seagate, Western Digital and TDK can build them, and each generation requires new designs.
Platters: multi-layer magnetic films are sputtered onto substrates. About 65% of critical sputter tools come from Intevac, now owned by Seagate, while HAMR glass substrates rely largely on HOYA.
Upstream expansions are underway, but effective supply lags announcements:
TDK: guides nearline head shipments up ~50% by FY ending Mar 2027. External supply to Seagate and Western Digital has been ramping since Q2 2026 but mainly backfills their internal shortfalls, with 70%–90% of output going to Toshiba.
Resonac: plans to lift platter capacity from ~160mn/year by ~44% to ~230mn/year by 2029. The 50mn in Singapore ramps from 2027 and is expected to be pre-allocated to Toshiba, leaving little for Seagate and Western Digital.
HOYA glass substrates: a new Vietnam plant (~JPY 50bn) only contributes around 2028.
Deeper down, component vendors hesitate to invest aggressively: system makers hold pricing power, head prices can rise only ~5%–10%, and even tight actuators have not seen big hikes. After a decade-long HDD downcycle, suppliers are cautious.
Dolphin Research believes meaningful easing from component capacity only arrives post-2028. The bottleneck will remain tight until then.
ii) Lines and time: per Seagate management, it takes at least two years from investment to stable mass production for a new factory. Buildings go up fast, but the bottlenecks lie outside the shell.
a. Heads, platters and assembly require cleanrooms, with sputter, deposition, precision assembly and test relying on specialized tools with few suppliers.
b. New lines need lengthy tuning to stabilize yields. Large-capacity drives require full-drive read/write testing, and the larger the drive, the longer the test, making test capacity a hidden bottleneck; HAMR migrations also consume capacity, keeping even status-quo shipments tight.
iii) Tech and qualification: new products must clear lengthy cloud qualifications. Toshiba planned to launch 40TB+ in FY2025–26 but is still sampling 30–34TB, showing that lines do not equal capacity at the high end.
By contrast, funding is not a binding constraint: Toshiba can restart idle lines for about $380mn, far below the multi-billion investments typical for DRAM/NAND.
3) Incentives: Seagate and Western Digital resist expansion; only Toshiba wants to
Seagate and Western Digital explicitly avoid unit additions. Seagate says plants are fully loaded and will not build new factories, targeting ~25% annual nearline capacity growth via HAMR; Western Digital likewise avoids chasing share and guides customers to higher-capacity drives.
Their capex is typically 4%–6% of revenue, for three reasons. a) Unit additions do not lower per-TB cost and can depress prices; density gains are the true cost lever. b) Price increases are more profitable than volume, with incremental GM around 90%.
Large-customer LTAs price around $15/TB, with 2027–2028 targets of $25–30/TB, while non-LTA deals already fetch $30–50/TB. About 70%–80% of capacity is LTA-locked to hyperscalers, with the balance sold at a premium, and pricing locked for 12 months or less to preserve pricing power in tight markets.
c) History: post-flood overcapacity is a fresh memory. Profit-over-share discipline underpinned the doubling of margin midpoints, and there is no incentive to break it.
The exception is Toshiba: on Oct 2, 2026, Toshiba announced plans to nearly double data center HDD capacity (by capacity) vs. FY2025 by end-FY2027 (Mar 2028). Nikkei reported ~JPY 60bn (~$380mn) of investment with a mid-term share goal of 30%.
Toshiba’s logic is clear: it is a pure assembler (heads, platters and glass substrates relying on TDK, Resonac and HOYA). In 2025, HDD revenue was about $2.5bn, roughly a quarter of Seagate or Western Digital, making expansion the highest-return and lowest-cost option given an areal density gap.
But the spend mainly restarts idle tools and eases test bottlenecks, limiting impact. Even if Toshiba doubles nearline capacity, two-year additions are under 150EB vs. a 300–400EB industry shortfall.
Even with Toshiba doubling and Seagate and Western Digital each growing 25%, Toshiba’s share would rise from 11.2% to only 16.8%, and industry supply growth to ~33%, still below demand growth. Products also lag: mainstream data center drives are 26/28TB, one to two generations behind US peers, misaligned with hyperscalers’ preference for higher capacity and fewer spindles.
Execution is a risk: in 2022, Toshiba targeted 25% share but has since slipped from 17% to ~11%. Thus, near-term impact on supply and pricing is limited, but it signals the first crack in oligopoly discipline.
Post-2028, as component expansions arrive, Western Digital and Toshiba scale HAMR, and demand growth normalizes, supply-demand balance will truly test discipline.
4) China-based capacity: unlikely to compete in systems near term
China plays more of a manufacturing base and materials supplier (e.g., rare-earth magnets) role in HDD. There are no domestic system vendors competing with the big three, and attempts by Great Wall/Eastcom, Nanfang Huichong and others relied on imported lines and licenses, ultimately exiting due to quality, IP or funding issues.
Three barriers loom. i) The moat is in heads and media, not in assembly: areal density relies on head/media/substrate materials, processes and decades of IP, with even Western Digital trailing Seagate by ~two years in HAMR mass production.
ii) A closed supply chain: heads, platters, substrates and sputter tools are concentrated among a few US/Japan suppliers with capacity locked to incumbents. Tool leader Intevac is owned by Seagate, making parts acquisition difficult for entrants during shortages.
iii) A small market with strict certification: global HDD revenue in 2025 was only ~$22.3bn, split among three, and nearline customers are hyperscalers requiring long reliability quals. Unlike NAND, HDD’s critical tools and materials lack mature third-party markets, making catch-up via capex buys impractical.
This is why YMTC could enter NAND but there is no 'HDD-version YMTC'. Localization is starting: LeadChina’s RMB 10bn Nansha HDD full-chain project targets 2026 Oct–2028 Sep to build glass substrates and laser R/W components, and some startups showed prototypes.
But these are still at component or prototype stages and unlikely to affect global supply this cycle. The more realistic impact is indirect: if YMTC and others expand and push NAND prices down, SSD vs. HDD price gaps could narrow, though shrinking from ~20x (30TB enterprise, 2026 peak) to 2–3x remains far off.
4) Why are HDDs, long out of favor, becoming the AI-era data terminus?
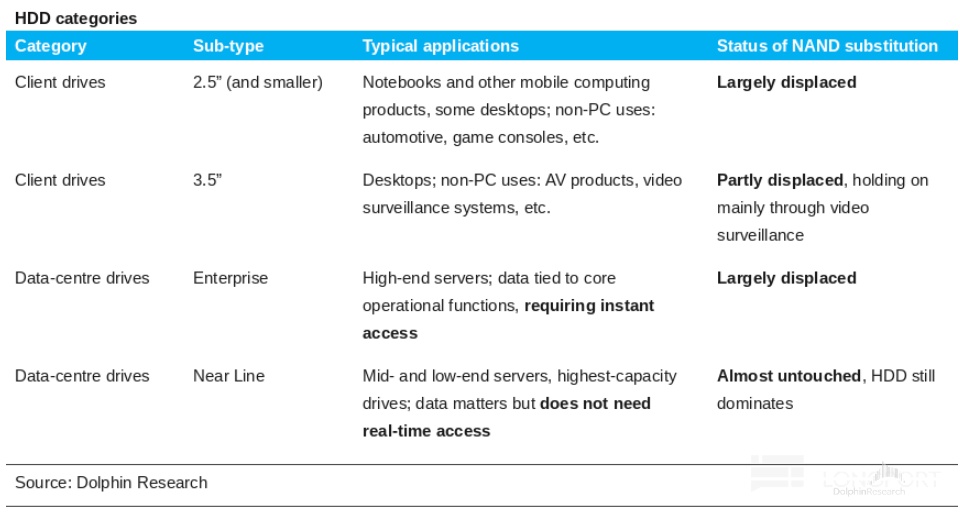
The HDD market has four segments: 2.5' client (notebooks), 3.5' client (desktops and surveillance), enterprise (high-end servers), and nearline—the highest-capacity 3.5' drives storing warm/cold data in data centers. The first three have been largely displaced by SSDs, while nearline remains dominated by HDDs.
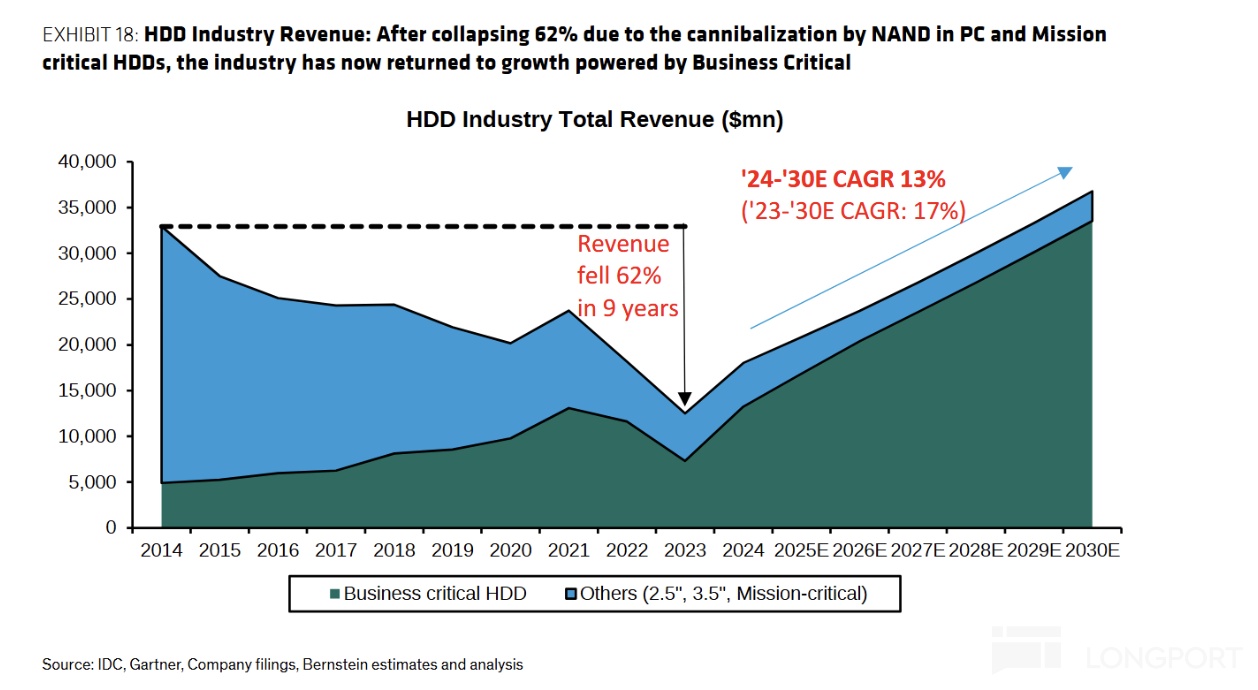
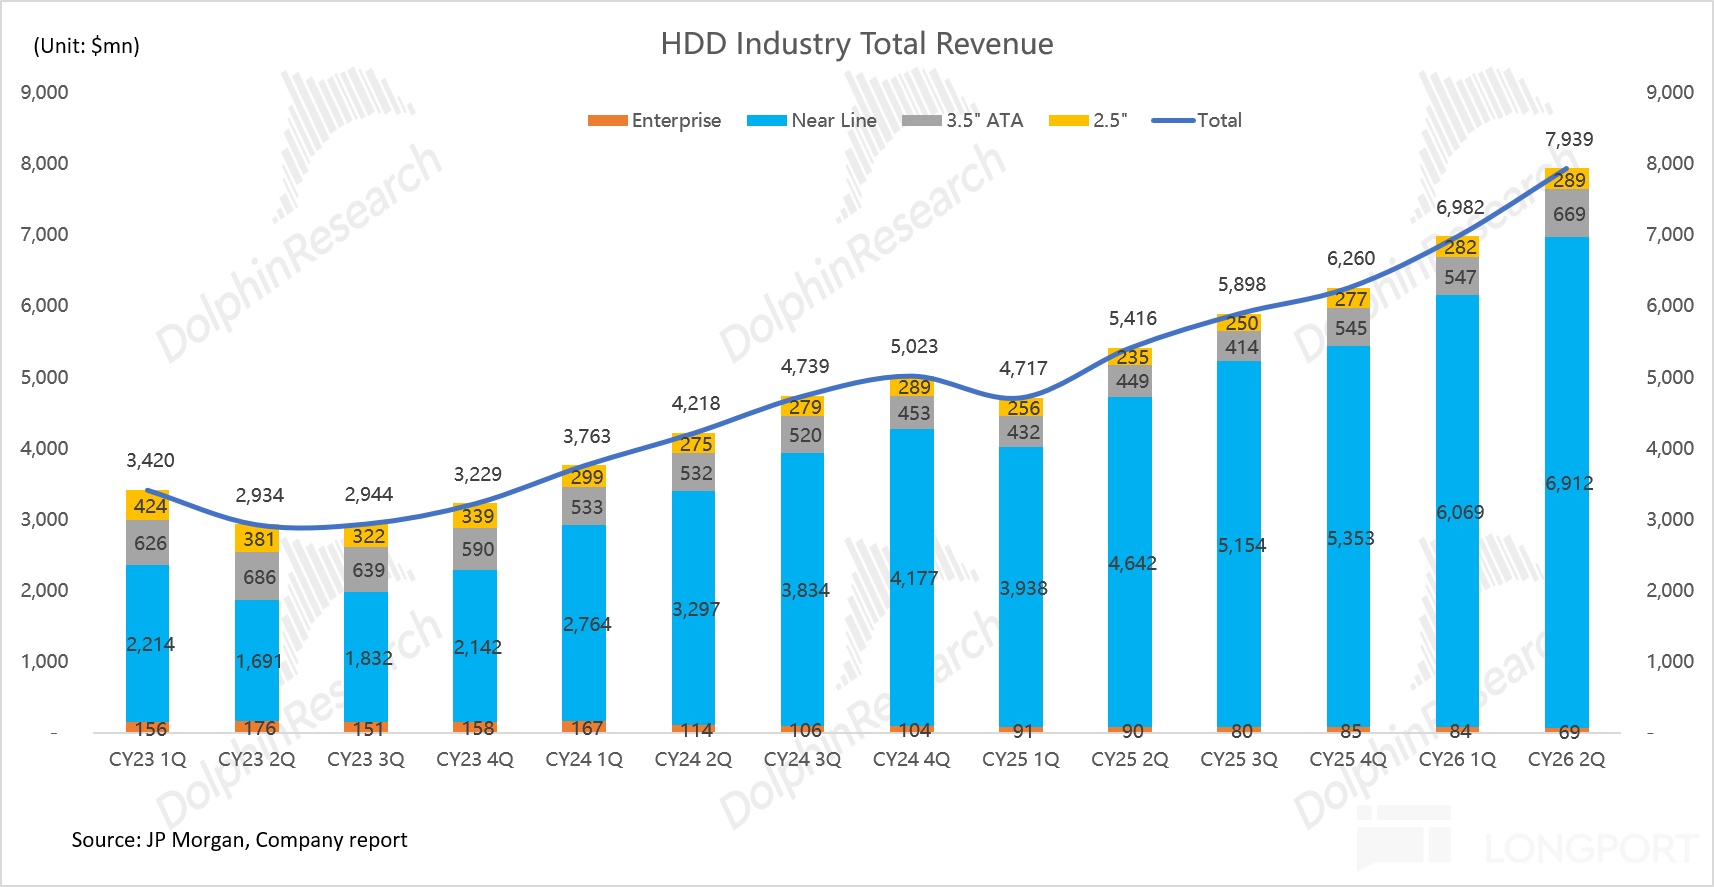
Over the past decade, HDD demand has been reshaped: from 2014–2023, as PC and enterprise drives were replaced, industry revenue fell 62% from $33bn to $12.5bn; from 2023–2025 it rebounded 78% to $22.3bn, with all the growth from nearline. Nearline’s revenue share rose from 63% to a record 86%.
This means the most aggressive NAND encroachment phase is over. HDDs shed their weakest segments and now benefit from the AI data explosion.
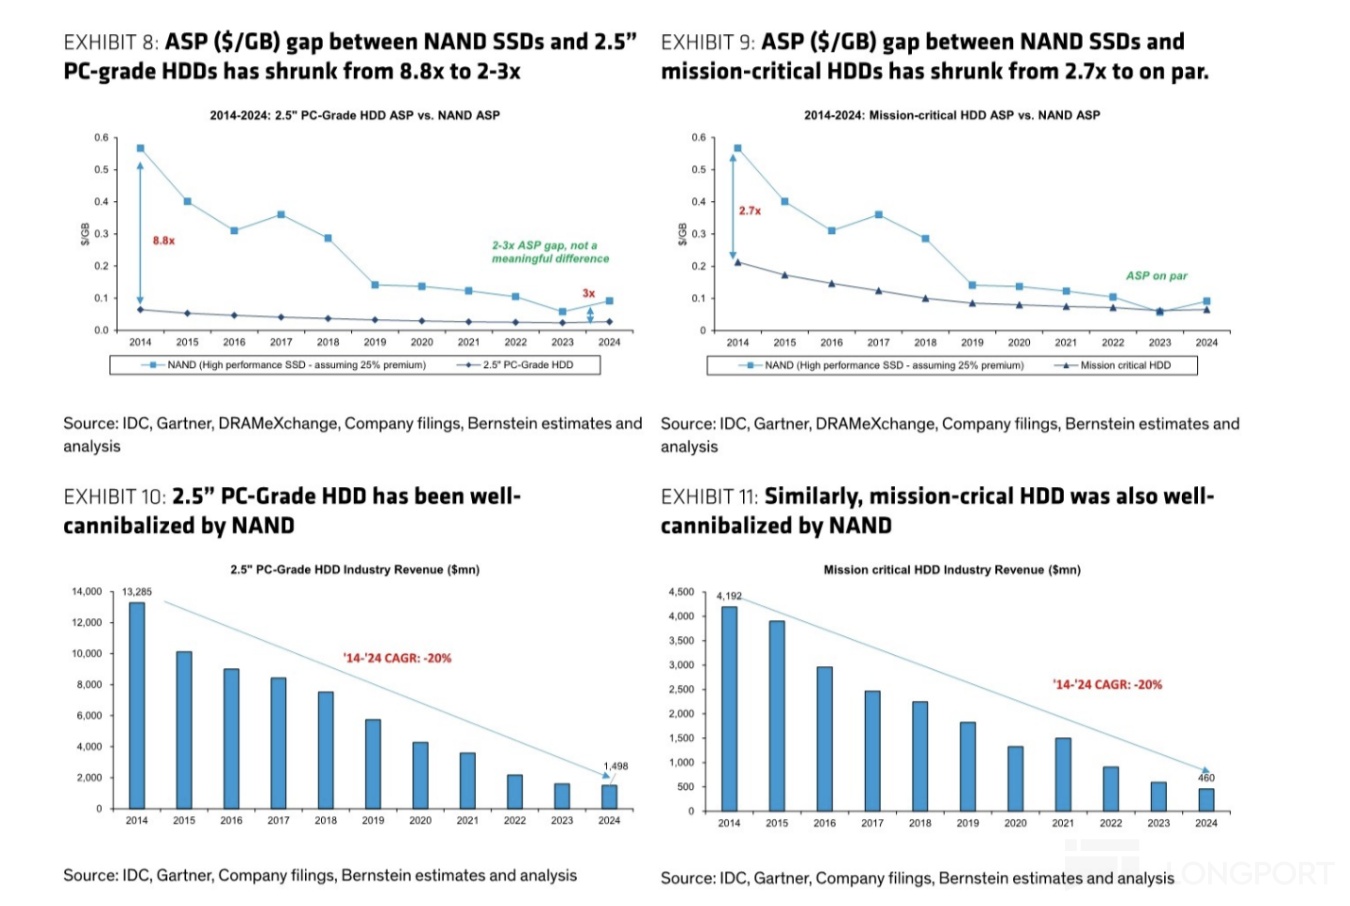
Why do some segments see wholesale disruption while nearline HDD stays firm?
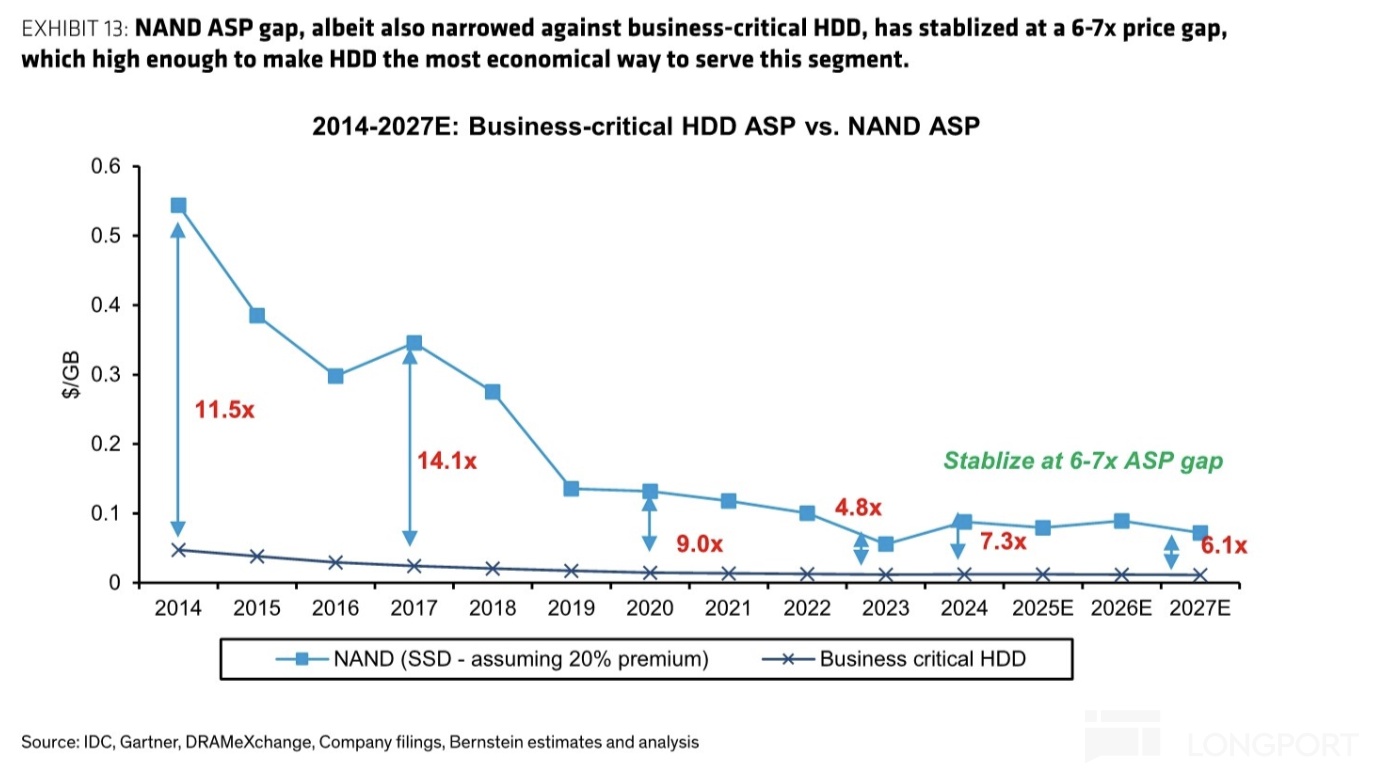
The key is sensitivity to performance and the per-GB price gap versus HDD. Accounting for SSD’s hidden advantages in power and footprint, substitution enters a 'switching zone' when the gap narrows to 2–3x.
2.5' client: notebooks need thin, light, power-efficient and shock-resistant storage. When the gap narrowed to 2–3x by 2019, HDDs capitulated, with revenue plunging from $13.3bn in 2014 to under $1bn by 2025.
Enterprise: core databases and HFT are ultra-latency-sensitive, making substitution irreversible. HDD revenue fell from $4.2bn in 2014 to $350mn in 2025, with SSD share now above 90%.
3.5' client: desktops moved to flash, while surveillance retained some HDD share given large data volumes, cost sensitivity and sequential writes.
Why did substitution stop at nearline?
Even at NAND’s trough in 2023, the gap only fell to ~4.8x, never entering the switching zone. With NAND prices rising sharply in 2024–2026, the gap widened from ~5x to ~20x within two years, making SSD-for-HDD swaps economically moot.
The widening gap is prompting AI data centers to reassess storage architectures, with some demand potentially reverting to HDD. Some hyperscalers temporarily used enterprise SSDs to cover HDD shortages, but those were stopgaps, not architectural shifts.
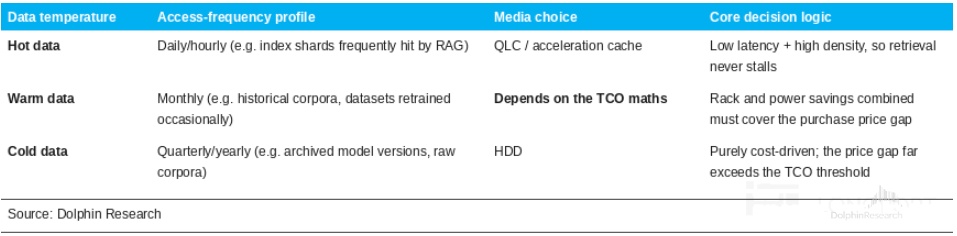
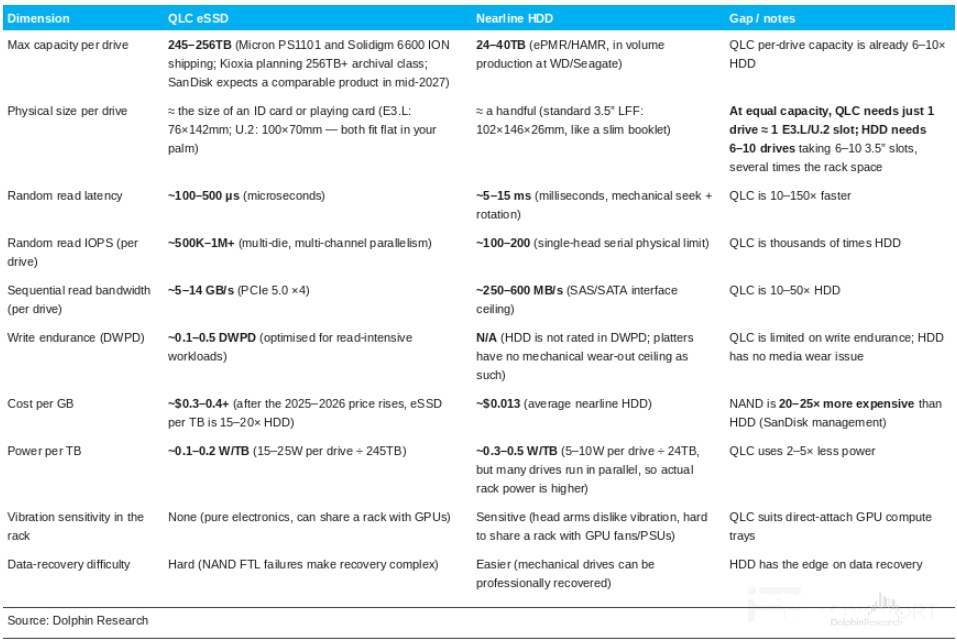
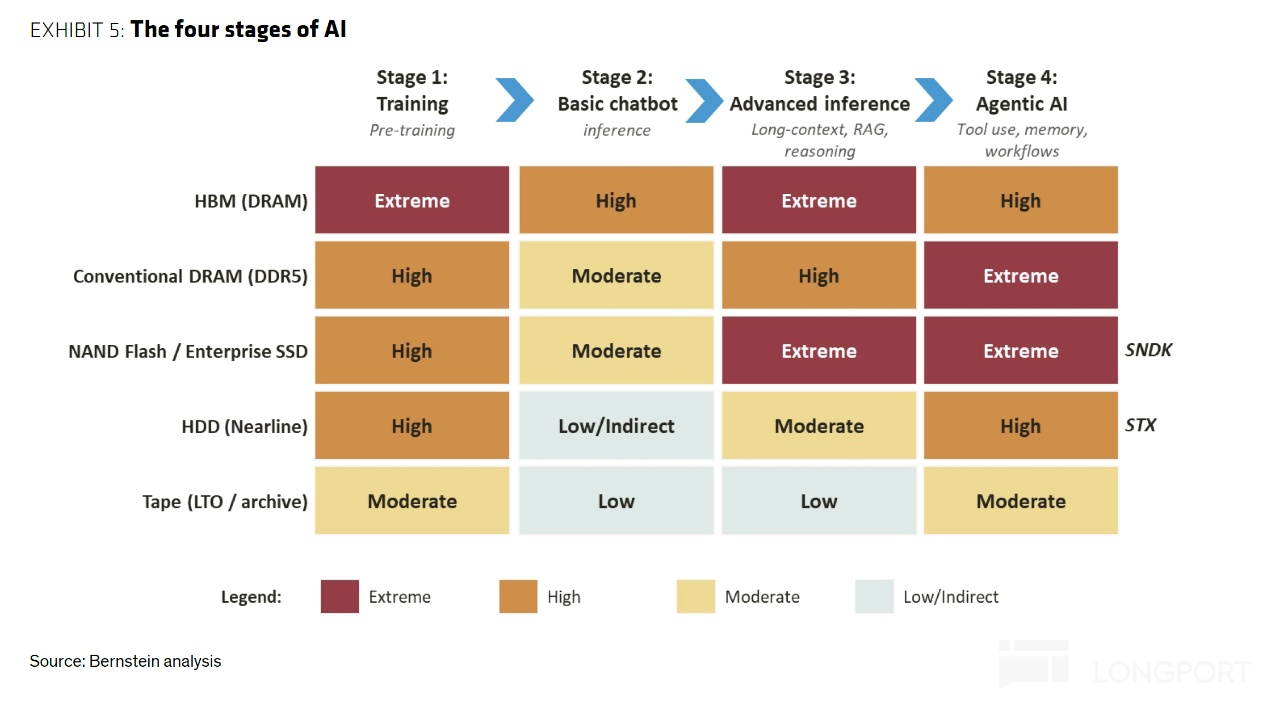
In AI data centers, if HBM and local SSDs are the compute front line, then the data lake formed by nearline HDDs and QLC SSDs is the remote central warehouse. QLC SSDs hold warm data that is occasionally accessed, offering faster retrieval at higher per-TB cost.
HDDs serve as the bulk warehouse, storing three categories. a) Model assets: historical checkpoints and model weights, rarely modified but massive and mission-critical.
b) Corpora and archives: large raw datasets and long-idle histories, while frequently accessed KV caches and vector indices stay in DRAM and SSD. c) Operational logs: system logs, evaluation records and prompt histories, retained long term for compliance, post-mortems and retraining.
There are three reasons these land on HDD. a. Access pattern fit: these datasets are typically 'write once, store long, read back in bulk', aligning with HDD’s 250–300MB/s sequential strengths, where SSD’s microsecond latency adds little.
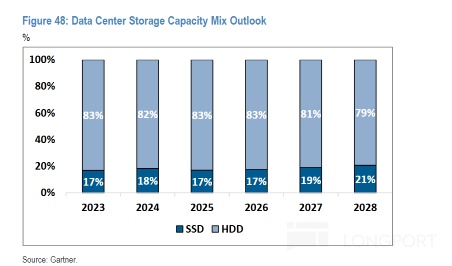
b. Cost: in 2026, SSDs cost ~20x per GB vs. HDDs, while HDDs account for roughly 80% of cloud storage capacity. Swapping all to SSDs would be prohibitive capex.
c. Write durability: large QLC SSDs typically allow only hundreds to low-thousands of P/E cycles, while HDDs have no P/E wear, making them ideal for continuous log ingestion.
Summary
HDDs are more sunset and peripheral than NAND, yet their AI-era comeback rests on five pillars. i) Concentrated structure with controllable supply: after M&A and the Thai floods, three players remain, with Seagate and Western Digital together near 90% by revenue, and capacity expansion driven by areal density, not new lines, keeping profit discipline and cost-down gains with OEMs.
ii) Cheap, high-capacity, write-friendly, but slow: per-GB HDD cost is about 1/20 of enterprise SSDs, single-drive capacity exceeds 40TB and there is no P/E limit, at the cost of millisecond latency. Thus, HDDs hold the warm/cold tier as the AI data terminus.
iii) Expansion constrained, with only Toshiba willing to expand: tight components and lengthy plant/HAMR ramps cap supply growth through 2028. Seagate and Western Digital prefer pricing over volume, Toshiba’s additions cannot fill a 300–400EB gap and China, constrained by tech, IP and closed supply chains, is unlikely to compete in systems this cycle.
iv) Technological divergence with starker gaps than NAND: Seagate’s HAMR leads single-platter capacity by ~20%–30%, Western Digital trails by ~two years and Toshiba most of all. Areal density leadership translates directly into per-TB cost advantage and higher GPM.
v) The substitution line is a 2–3x price gap: nearline never reached the switching zone, with the trough gap at ~4.8x and now ~20x after NAND price hikes, halting substitution and even pulling some demand back to HDD.
This reversal is not merely cyclical: on supply, oligopolists meet demand via density, not unit growth; on demand, AI makes data grow-only, while NAND inflation reinforces HDD’s cost edge. The real watchpoint is post-2028 when component capacity lands and Toshiba’s expansion cadence is tested.
In the next piece, we will focus on why HDD and NAND cycles differ sharply, how long HDD pricing strength can last, and whether Seagate and Western Digital still have room to run. Stay tuned.
<End here>
Risk disclosure and disclaimer: Dolphin Research disclaimer and general disclosure
Updated analysis:
I. Dolphin Research AI storage series
DRAM sector:
Storage power takes the baton from compute, why did HBM stand out?
From HBM limits to NAND capacity, NVIDIA vs. storage power: who controls whom?
Single names:
SanDisk (Part 1): AI inference boom: can 'unlucky' SanDisk be reborn?
SanDisk (Part 2): NAND’s prolific DNA: how does SanDisk keep 80% GPM?
SanDisk (Part 2): From supporting role to star: how AI inference rewrites NAND’s fate?
SanDisk (Part 3): AI can’t change the DNA: how long can SanDisk’s strength last?
II. Dolphin Research AI DC interconnect series:
CPO industry
AI hyper-connect era: a sprint to optics? 'Copper' queen stays: CPO, real opportunity or mirage?
Network architecture
NVIDIA networking: DC interconnect in the AI era: teaming up above the single chip, is there a China opportunity?
DC networking AMD vs. NVIDIA: AMD arm-wrestles NVIDIA: is Helios up to it?
Google networking: Challenging NVIDIA’s dominance: what underpins Google’s 'optical' network?
Single names
Lumentum (Part 1): From optical interconnect veteran to 'all-around water seller': why Lumentum?
Lumentum (Part 2): Lumentum: capacity crunch, what core strengths remain?
III. Dolphin Research AI XPU series
Agents and CPUs: Muse goes viral: is it the ChatGPT moment for CPUs?
...For more, visit the Longbridge Dolphin Research site