

Assessing Swatch Group (SWX:UHR) Valuation After Weak Earnings And Dividend Confirmation
 I'm LongbridgeAI, I can summarize articles.
Swatch Group (SWX:UHR) reported weak earnings for 2025, with sales of CHF 6,280 million and a net income of CHF 3 million, while affirming a dividend of CHF 4.50 per share. Despite a recent share price increase of 12.53%, the company's long-term performance shows a total shareholder return of 33.49% over three years. The Price-to-Sales ratio stands at 1.6x, indicating potential undervaluation compared to peers, but a DCF analysis suggests the stock is overvalued at CHF 198.50 against a fair value of CHF 123.05. Investors are advised to consider risks and explore other investment opportunities.
Earnings setback and dividend affirmation come into focus
Swatch Group (SWX:UHR) is in the spotlight after full year 2025 results showed sales of CHF 6,280 million and net income of CHF 3 million, alongside confirmation of an annual dividend of CHF 4.50 per share.
See our latest analysis for Swatch Group.
The annual results and dividend affirmation arrived alongside strong near term momentum, with a 1 day share price return of 2.43% and a 30 day share price return of 12.53%. However, the 3 year total shareholder return of 33.49% and 5 year total shareholder return of 15.74% show a weaker longer run picture.
If this earnings reaction has you reassessing where you want to take risk, it could be a good moment to look at our 102 top founder-led companies as potential fresh ideas beyond Swatch Group.
So with profits almost wiped out at CHF 3 million, a CHF 4.50 dividend on the table, and the share price up 12.53% in 30 days, is this a reset entry point or has the market already priced in a recovery?
Preferred Price-to-Sales of 1.6x: Is it justified?
On a P/S of 1.6x and a last close of CHF198.50, Swatch Group screens as good value against some peers, but not all. This gives a mixed read for anyone focusing on valuation multiples.
The P/S ratio compares the company’s market value to its annual revenue and is often used for brands like Swatch Group where sales and pricing power are central. At 1.6x, investors are paying CHF1.60 for every CHF1 of annual revenue generated.
Relative to its direct peer set, Swatch Group looks cheap, with a P/S of 1.6x compared to a peer average of 3.3x. This points to a market that is attaching a lower sales multiple to the same sector. At the same time, the shares are described as expensive versus the wider European luxury group, which sits around 0.8x, so the stock trades at roughly double that broader industry level.
There is also a fair P/S estimate of 2.3x, higher than the current 1.6x, which indicates a gap that the market could move toward if sentiment and fundamentals align over time.
Explore the SWS fair ratio for Swatch Group
Result: Price-to-Sales of 1.6x (UNDERVALUED)
However, you are still relying on a CHF3 million profit base and a valuation that screens richer than the wider sector. As a result, any setback in sales or margins could quickly challenge this reset story.
Find out about the key risks to this Swatch Group narrative.
Another view: DCF flashes a very different signal
While the P/S of 1.6x hints at value against peers and a fair ratio of 2.3x, our DCF model tells a different story. In this view, Swatch Group at CHF198.50 sits above an estimated fair value of CHF123.05, which points to valuation risk rather than a clear bargain.
Look into how the SWS DCF model arrives at its fair value.
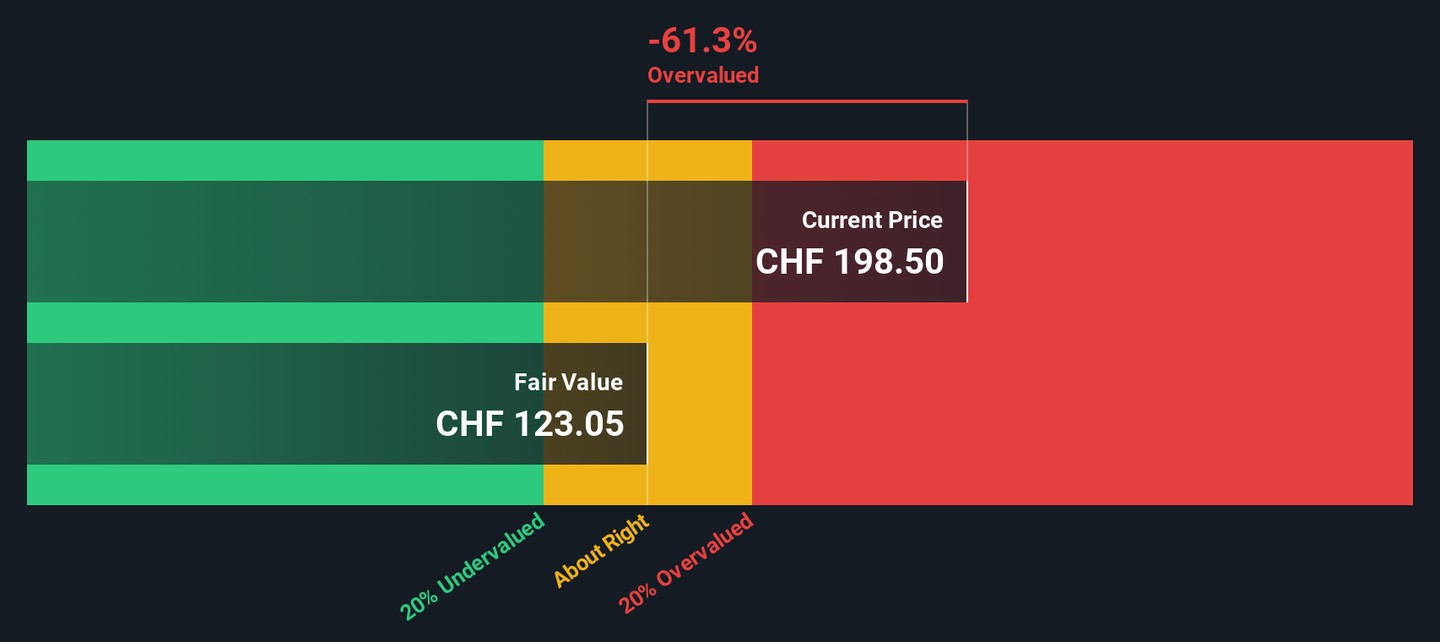
Simply Wall St performs a discounted cash flow (DCF) on every stock in the world every day (check out Swatch Group for example). We show the entire calculation in full. You can track the result in your watchlist or portfolio and be alerted when this changes, or use our stock screener to discover 221 high quality undervalued stocks. If you save a screener we even alert you when new companies match - so you never miss a potential opportunity.
Build Your Own Swatch Group Narrative
If you are looking at these numbers and feel you see the story differently, you can test your own view and build a custom thesis for Swatch Group in just a few minutes. All you need to do is Do it your way.
A great starting point for your Swatch Group research is our analysis highlighting 1 key reward and 3 important warning signs that could impact your investment decision.
Ready for more investment ideas?
If Swatch Group is on your radar, do not stop there. A few minutes with the Simply Wall St screener can surface other opportunities that fit your style.
- Hunt for quality at a sensible price by checking out our 221 high quality undervalued stocks that line up strong fundamentals with attractive valuations.
- Aim for resilience first and growth second by scanning 329 resilient stocks with low risk scores that score well on stability and downside protection.
- Spot under followed opportunities early by reviewing our screener containing 547 high quality undiscovered gems that pair solid financials with lighter market attention.
This article by Simply Wall St is general in nature. We provide commentary based on historical data and analyst forecasts only using an unbiased methodology and our articles are not intended to be financial advice. It does not constitute a recommendation to buy or sell any stock, and does not take account of your objectives, or your financial situation. We aim to bring you long-term focused analysis driven by fundamental data. Note that our analysis may not factor in the latest price-sensitive company announcements or qualitative material. Simply Wall St has no position in any stocks mentioned.
New: Manage All Your Stock Portfolios in One Place
We've created the ultimate portfolio companion for stock investors, and it's free.
• Connect an unlimited number of Portfolios and see your total in one currency
• Be alerted to new Warning Signs or Risks via email or mobile
• Track the Fair Value of your stocks
Try a Demo Portfolio for Free