

With interest rate hikes implemented and the SEC's approval, what's missing for a full-fledged BTC bull market?
 I'm LongbridgeAI, I can summarize articles.
Following the Fed's 25bps rate hike and SEC approval of tokenized securities, BTC rebounded from $75K to $82K. Market analysis indicates short squeezes drove the rally, with buying pressure temporarily overtaking selling. Institutional inflows into spot Bitcoin ETFs expanded to include Fidelity alongside BlackRock, signaling renewed institutional interest. Despite this momentum, BTC faces resistance at $83K, leaving uncertainty regarding a full bull market breakout.
Author: Mr. Xiaolong; Source: X, @Dragonhau66
This week has been packed with information: the Fed raised interest rates, the SEC approved tokenized securities, and the rate hike didn't bring down BTC; instead, it had a "bad news priced in" feel, stimulating the BTC price to rise from around 75K to around 82K.
However, 82K hasn't been breached yet. Can BTC break through the 83K resistance level in mid-to-late September and officially open the window to a full-blown bull market? Today, we'll break these issues down thoroughly.
I. Two Major Events This Week: Interest Rate Hike and SEC Approval

Two major events occurred this week, one expected and one completely unexpected.
Let's start with the interest rate hike.
On September 16, the Federal Reserve announced a 25 basis point interest rate hike, raising the benchmark interest rate to 3.75%-4.00%.
This is the first interest rate hike since July 2023, and Warsh's first major move since becoming chairman. The dot plot indicates one more rate hike is expected this year. Warsh made a crucial statement at the press conference: "Inflation remains too high, and has been going on for too long." He also said, "Financial conditions are not restrictive," which translates to: interest rates are not high enough. BTC briefly dipped to 75K after the decision but quickly rebounded, holding above 75K. Now, let's talk about the SEC. On September 17th, the SEC suddenly issued an "innovation exemption," allowing eligible tokenized securities to trade on-chain, a five-year temporary framework with restrictions on the underlying asset, size, and disclosure. This timing is very delicate. Just two days ago, the Senate failed to advance the CLARITY bill by a 49-50 vote. SEC Chairman Atkins directly addressed the issue in a statement: "As Congress failed to advance the CLARITY bill, the SEC has taken an important step within its statutory authority." The market reaction was immediate. The DeFi sector led the gains, with UNI rising over 25% and NEAR rising approximately 30%. BTC surged from 75,000 to around 82K. This week's market review: Interest rate hikes cannot stop the bull market's momentum, unless there is a cumulative effect from multiple consecutive rate hikes! II. Bullish and Bearish Volume Analysis: Shorts squeezed out, have the bulls taken over?

Short squeeze is the primary driving force.
The rebound from 75K to 80K was primarily driven by short liquidation. On-chain data shows that the liquidation pressure oscillator surged from +0.48 a day ago to +54.52. In the past 24 hours, BTC short liquidation reached $45.31 million, while long liquidation was only $9.13 million. A large number of leveraged short positions were squeezed out during this rebound.
**Bull buying pressure drives prices up.** The active order book pressure oscillator rose from -1.88 to +0.86, indicating that buying pressure has temporarily surpassed selling pressure. The bid-ask depth ratio reached 1.87, showing a clear advantage for buyers. However, it's important to note that this positive indicator only lasted about 4 hours, and the buying advantage has not yet been fully confirmed. Looking at the bullish volume curve in the chart below, Friday's four-hour bullish volume is not considered a major or minor volume in the past two months. The subsequent decline in both bullish and bearish volume over the weekend suggests that recent bearish volume has been extremely weak, easily crushed by a slight push from the bulls!
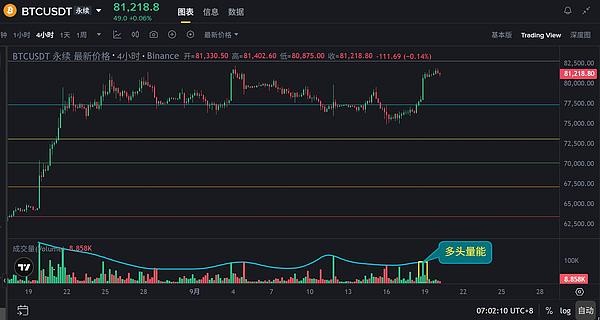
Volume Assessment: Short selling pressure drove the rebound, and bullish buying began to take over, confirmed by increased volume on Friday. The volume structure shifted from "short covering" to a mixed drive of "short selling pressure + active buying." However, the buying advantage has only been established for a short time, and bullish volume is not very strong. The area around 83K is a key short-term resistance level.
III. On-chain Data Analysis: Who is buying and who is selling?

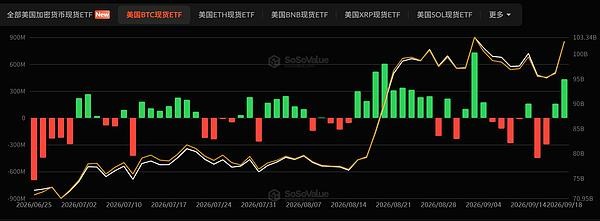
Net inflows of funds into ETF spot trading institutions have spread from one to two.
On September 18, the US spot Bitcoin ETF saw a net inflow of $433 million, 2.7 times the $159 million of the previous day.
More importantly, there has been a structural change:: Fidelity FBTC led with a net inflow of $311 million, while BlackRock IBIT saw a net inflow of $108 million.
This is completely different from the situation on September 17th, when "only IBIT saw inflows." The inflows have expanded from one major product to two, signaling a full return of institutional buying.
Whales didn't systematically sell off, but there was some position rotation.
In early September, Glassnode data showed that whales did indeed turn to net selling, with their cumulative trend score dropping to 0.37, the first time since early June.
Over the past week, data shows that the share of large wallets is declining, while small wallets are accumulating.
Meanwhile, 11 new wallets sold 602 BTC and bought 18,780 ETH on Hyperliquid. This is a rotation of positions rather than an exit, and ETH performed remarkably well. A more accurate statement is that whales did not engage in large-scale liquidation, but reduced their holdings during the rebound, with some funds rotating into ETH. This is different from a "systemic sell-off." The selling pressure from short-term holders has been released. The number of tokens held for less than 155 days flowing into exchanges rose from 19,400 to 33,100 BTC, of which 23,200 BTC arrived at exchanges at a loss, the highest in a month. This represents large-scale retail selling. However, this wave of "capitulation selling" is over. The current price is well above the cost line for short-term holders (approximately $71,000), and no new selling pressure has been triggered. However, there is another signal worth noting. A wallet that had been dormant for over 10 years transferred 1,260 BTC, worth approximately $100 million, with a cost basis of about $652. While whales may not necessarily be selling, unusual activity in older coins warrants attention. On-chain analysis: ETF institutional buying has temporarily returned; whales reduced their holdings during the rebound but did not liquidate their positions; selling pressure from short-term holders has been released. The on-chain structure is improving, resonating with the increased trading volume. IV. Structural Form and Spatial Position Analysis

The weekly bottom structure has been confirmed, and the bull market has started.
The large bullish weekly candlestick on August 17th directly signaled the end of the weekly 5-wave downward structure. The weekly chart has risen above the 50-week EMA for the first time since November 2025. The 57,800 level precisely touched the 200-week moving average, a level that has historically confirmed a bottom after four touches.
... The convergence of three signals indicates the first confirmation signal of a bull market has appeared. The bear market is over, the bull market has begun, and we are currently in the initial stage. I maintain this view unchanged! The large-cycle Fibonacci retracement indicates resistance levels and upward target prices. [Image of 0 axis = 15,500 (starting point of the upward trend), 1 axis = 126,800 (upward target), range 111,300.] The 0.382 level corresponds to 58,000, which has been broken. The 0.5 level corresponds to 71,200, a reference level for the current retracement depth. The 0.618 level corresponds to 84,300 (around 84K), a strong resistance level. The 0.786 level corresponds to 103,000, the next target. The 1-axis level corresponds to 126,800, the ultimate target. Current price position: The current price is in the 81K-82K range, testing the key resistance below the aforementioned large-cycle Fibonacci retracement 0.618 level (around 84K). 82K-82.5K is the most crucial confirmation level at present. If the BTC price breaks through and holds above this level, it will open up space towards 84K. Support lies at 79K-80K, and further down at 77K-77.5K. This week's weekly chart is highly likely to close positive, near 81K-82K. Compared to last week's negative candle, this week's positive close is a positive signal, especially with increased volume, further confirming the short-term bullish structure. Structural Judgment: Short-term strength, medium-term positive. 82K-82.5K is a key confirmation level; a breakout and hold above this level with increased volume would confirm the full-scale start of the bull market; failure to hold would lead to a pullback to 79K-80K and continued consolidation. V. What's still missing for a full-scale BTC bull market?

Missing a "breakout with increased volume above 82500".
82500 is the midpoint of the channel and the convergence zone of horizontal resistance. The rebound from 75K to 82K has already seen increased volume, but 82500 is a more crucial technical level. A sustained breakout will open up space towards 84K-90K; rejection may lead to continued consolidation.
Missing a "sustainable net inflow into ETFs".
Missing a "sustainable net inflow into ETFs".
... On September 18th, ETFs saw a net inflow of 433 million, with the inflow expanding from IBIT to both FBTC and IBIT, a positive sign. However, several consecutive days of net inflows are needed to confirm a full return of institutional investors. A key factor is the resolution of macroeconomic uncertainties. The dot plot indicates one more interest rate hike this year, and the failure of the Clarity Act delays regulatory certainty. Without resolving these two uncertainties, funds will be hesitant to enter the market aggressively. A sustained buying momentum in the spot market is also needed. The current rebound is driven by short-selling pressure, active buying, and ETF inflows. However, the advantage of active buying has only been established for a short time, requiring sustained buying momentum in the spot market for the rebound to shift from "short-selling pressure" to "trend initiation."
VI. Key Variables and Price Forecast for Next Week

Key variables for next week are as follows:
The US August PCE data (September 26th) is the main focus. The flurry of speeches by Federal Reserve officials is also worth noting. Oil price trends and the Middle East situation continue to unfold. ETF fund flows need to be monitored daily.
The US August PCE data (September 26th) is the highlight. The numerous speeches by Federal Reserve officials are also worth paying attention to. Oil price trends and the Middle East situation are still developing. ETF fund flows need to be monitored daily.
... BTC Price Movement Forecast: Baseline Scenario: After testing 82500, BTC consolidates within the 78K-82.5K range. If PCE data is moderate and ETFs continue to see inflows, BTC may fluctuate repeatedly within the 78K-82.5K range, awaiting a breakout above 82.5K with significant volume. Optimistic Scenario: A direct breakout above 82500 with significant volume. If PCE data is lower than expected and ETFs see net inflows for several consecutive days, BTC may break out above 82500 with significant volume, opening up space towards 84K-86K. Pessimistic Scenario: A pullback to 75K-77K. If the PCE data exceeds expectations and oil prices rise again, BTC may retrace to the 77K or even 75K support level. The interest rate hike didn't cause a significant drop in BTC prices, so it's highly unlikely that the price will continue to fall sharply. The probability of it dropping to 67K is extremely low. Those hoping for BTC prices to fall back to the 60K range are likely to be disappointed. Therefore, our spot BTC bottom-fishing strategy is modified as follows: 79,000-80,000: Core entry zone, 30% position. 77,000-78,000: Add-on zone, retain 30% position. 73,500-75,000: Strategic averaging-up zone in extreme situations, remaining position. If the price breaks through 84K, we can continue to add to our position. **Build positions in batches, don't wait for the lowest point, wait for stabilization signals.** VII. Conclusion of this article. The bear market is over, the early stages of the bull market have begun, and a full-scale surge awaits confirmation with a breakout above 83K with significant volume. Patiently wait for the BTC price to break upwards; it's only a matter of time!