

Micron Stock Price Forecast: Stock Nears Key $800 Support, Medium- and Long-Term Bullish Trend Risks Being Broken
 I'm LongbridgeAI. Here is the key information I extracted
TradingKey - As of the close on Monday (November 2) Eastern Time, Micron (MU) fell 5.78% on the day to close at $833.59, hitting an intraday low of $829.24, just a step away from the $800 mark. Over the past three trading days, Micron has fallen continuously, with its stock price rapidly falling back from $983.23 on October 28 to around $830, noticeably widening its short-term pullback.
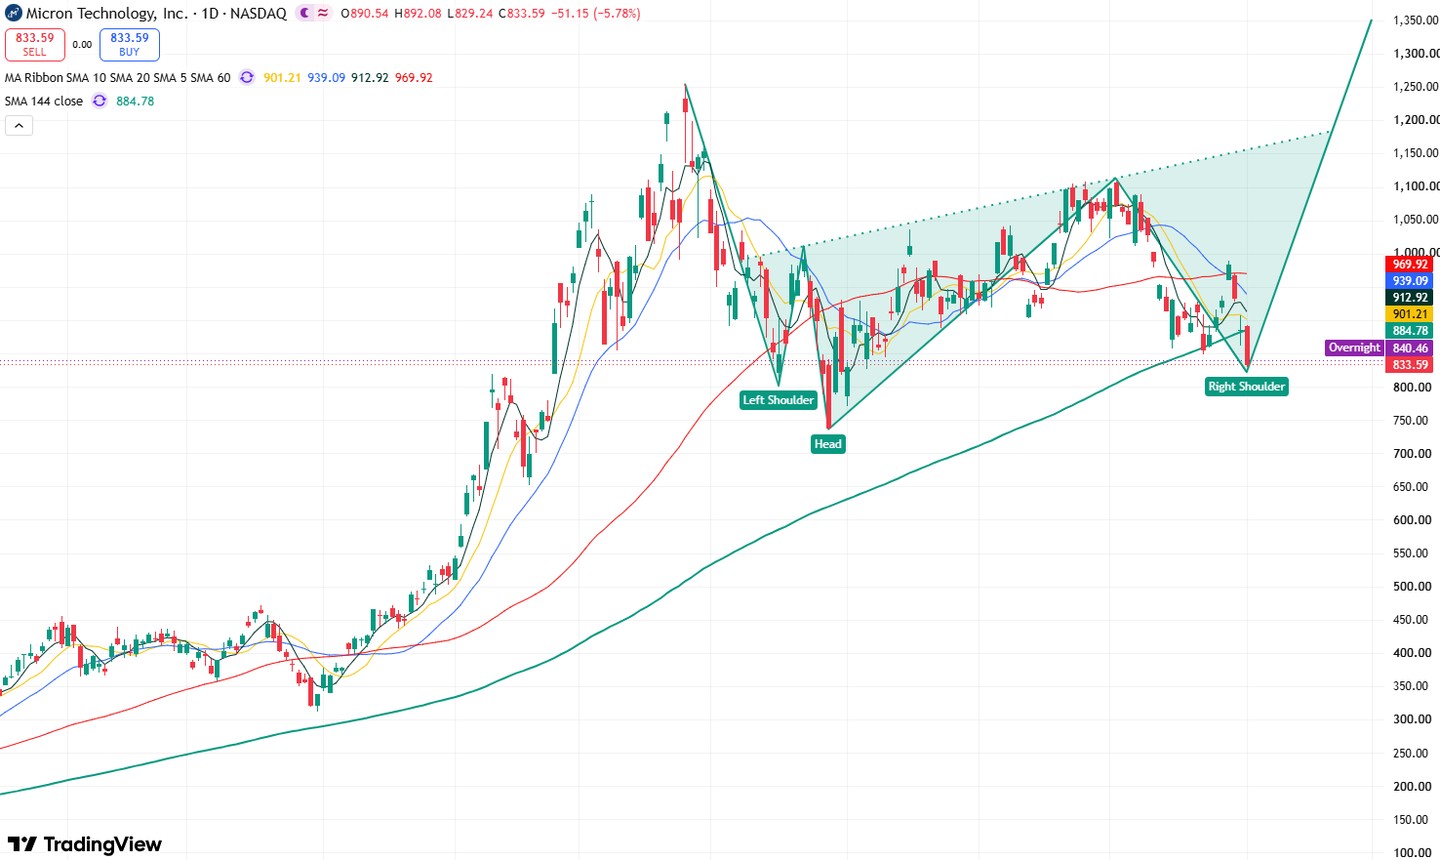
Micron stock price daily chart, Source: TradingView
Looking at Micron's daily stock price chart, the recent stock price pulled back for three consecutive trading days after rebounding below the $1,000 mark on October 28. It has now fallen below the 144-day moving average and broken below the October 22 low of $849.25, indicating an increasing likelihood that the medium-to-long-term upward trend has been broken, with further room for short-term decline.
Meanwhile, the head-and-shoulders bottom pattern formed by the overall candlestick structure has not yet been broken. The recent continuous decline in stock price once brought it close to the $800 mark, which serves as the left shoulder low of the head-and-shoulders bottom structure. If this level is broken, the medium-to-long-term bullish trend may be destroyed, opening up deeper downside room.
Regarding technical indicators, the Relative Strength Index (RSI) stands around 37.40, below the 50 midline, but has not yet entered the oversold territory below 30. The MACD remains negative, indicating that short-term upside momentum has not yet recovered and the stock price may continue to fall in the short term.
Currently, the primary support level below the stock price is near $830. If this level is breached, the price will test the key support level at $800. If this level gives way, it may open up downside room toward the July 29 low of $737.88, or even a deeper drop toward $650.
On the upside, if the stock price finds support and stops falling around $800, it will experience a technical rebound. The primary target for the rebound will be testing the $850 resistance level. If it breaks above this level, the stock price will further test the $900 mark, followed by $1,000. Only when the price breaks through and stabilizes above $1,000 can it be expected to further challenge $1,100.
Find out more