

Calendar Strategy Now Live on Longbridge! Broadcom Results Night: How Does Wall Street Really “Punt” on Earnings?
 I'm LongbridgeAI, I can summarize articles.
Some good news first: Longbridge’s multi-leg options now include the Calendar Spread, officially live, with both legs placed in a single one-click order.
This strategy is Wall Street’s routine move for results night. The night before $Broadcom(AVGO.US) reported, the comments section split into the usual two camps. One side bet on a rally, the other on a sell-off. But there was a third group at the Wall Street table. They couldn’t care less about up or down. They were betting on something else altogether: that Broadcom would stay inside the range the market had already drawn for it by the next morning. The name sounds technical, but what the trade actually does is run an insurance company. Below, we set up this “insurance company” using the calendar strategy on Longbridge, so you can see exactly how it works.
Setting Up an Insurance Company That Covers One Night Only
First, let’s see where the market drew the range for Broadcom.
At the close of the last trading day before results, the 370-strike call and put expiring 4 September added up to US$29.66. Divide that by the share price of 367.24 and you get roughly 8%. This figure is called the Implied Move. It’s the market’s expectation, voted on with real money: this set of results will most likely move Broadcom no more than 8% either way, so somewhere between US$338 and US$397.
So how do you set up the insurance company? Two steps.
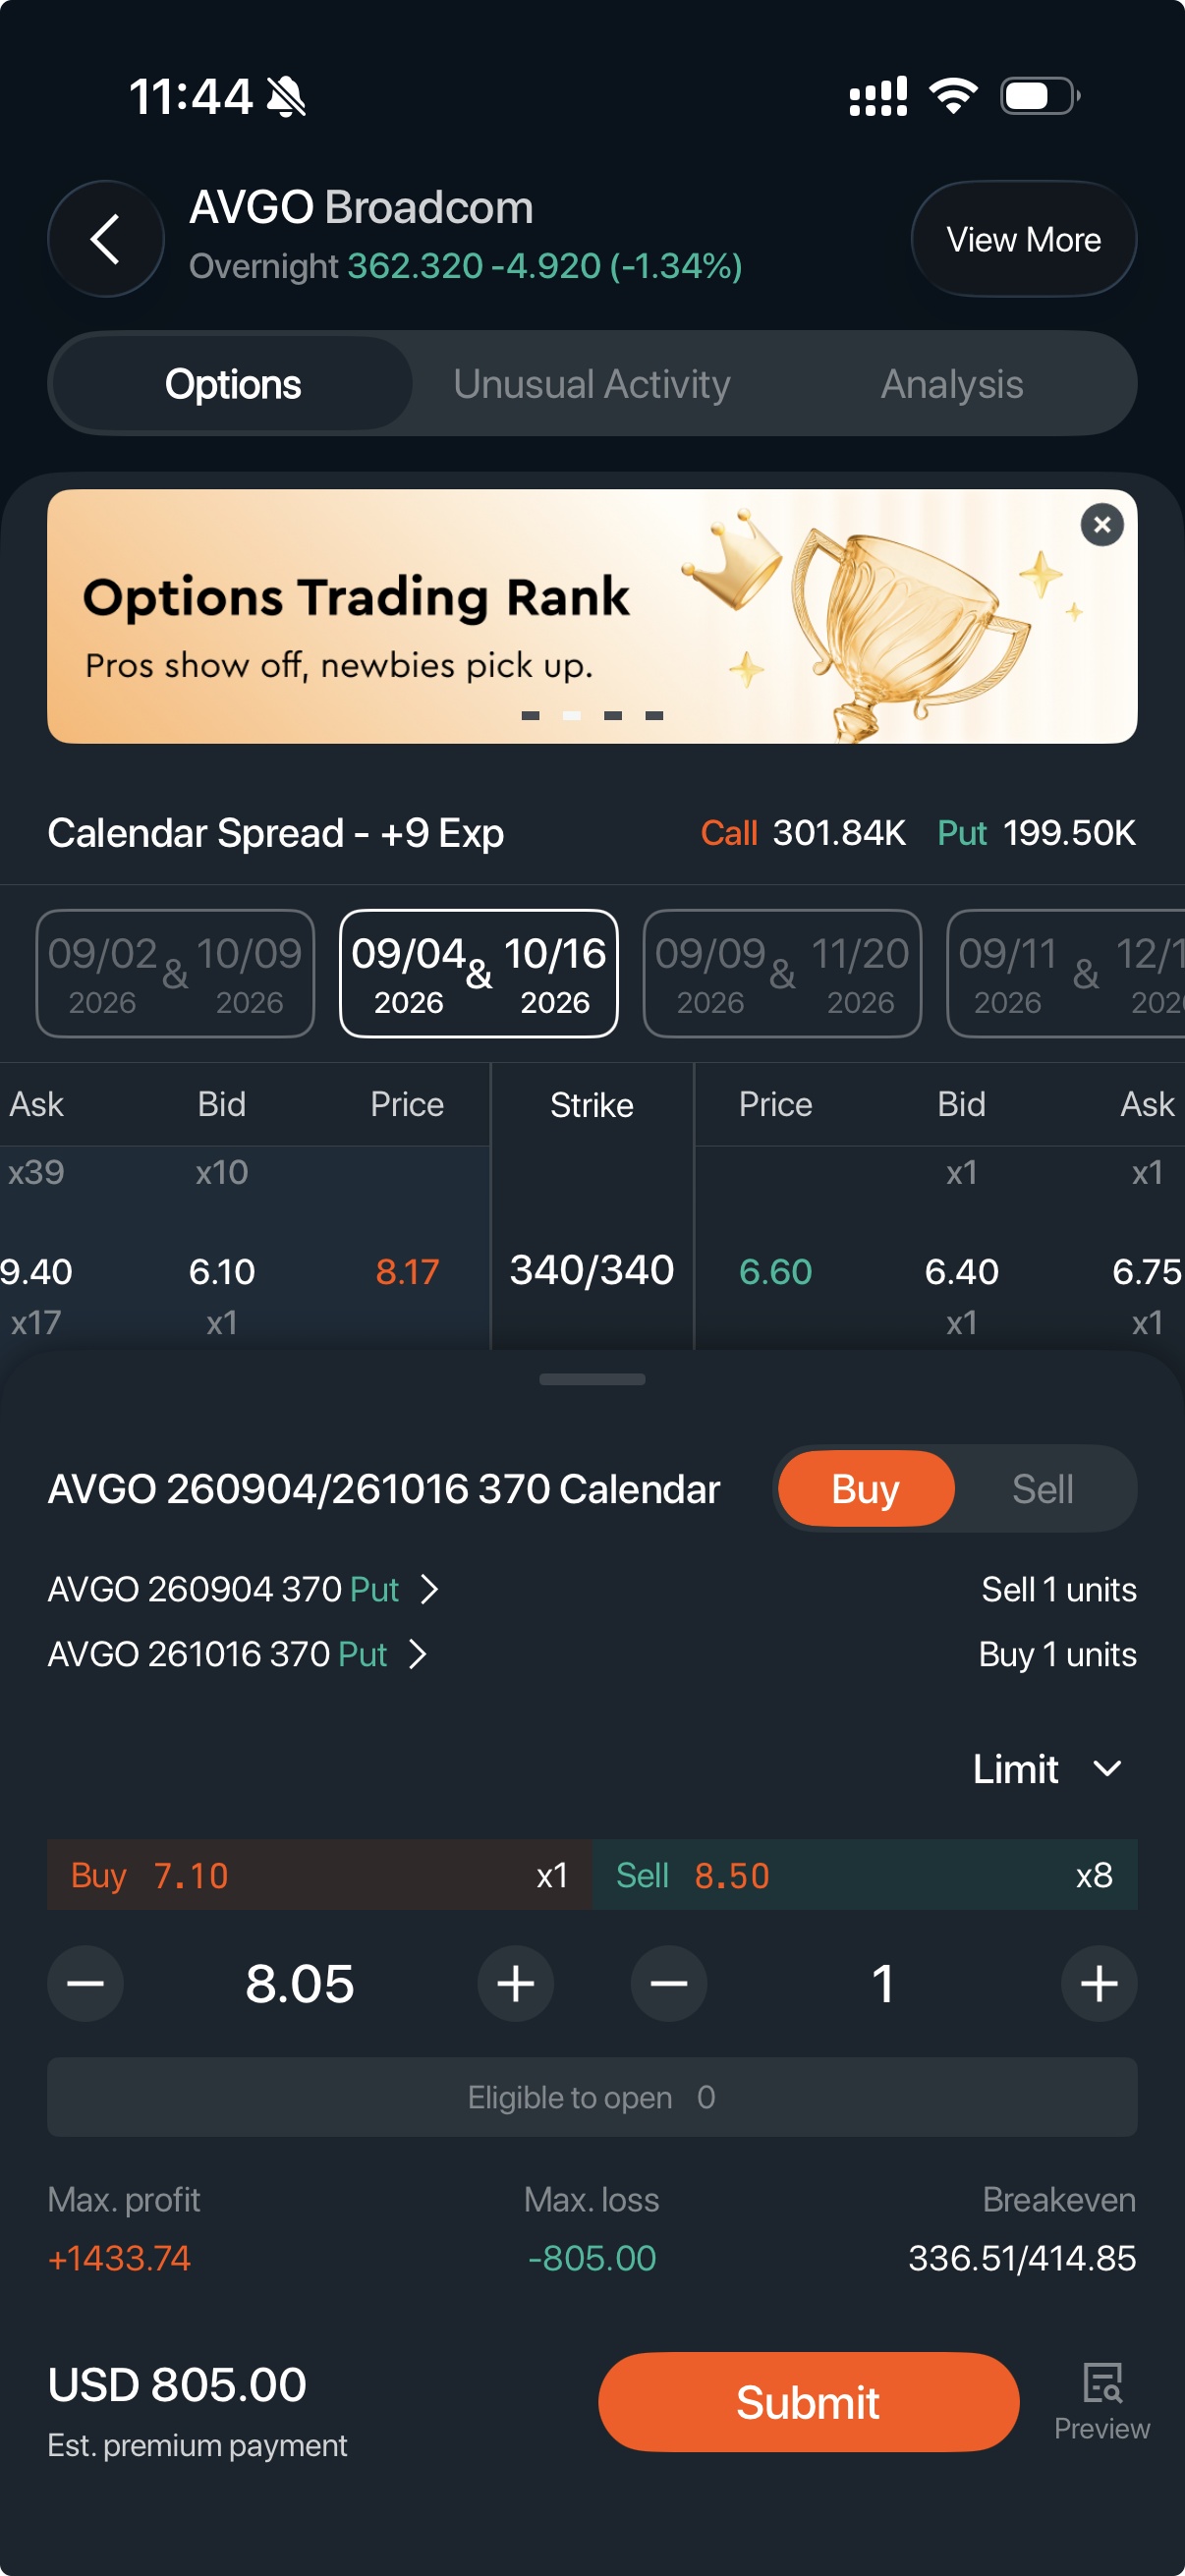
Step one: sell the 370-strike put expiring 4 September and collect US$16.00. This is you underwriting results night. Other people are worried the stock will break out of the range, so they pay you a premium for cover.
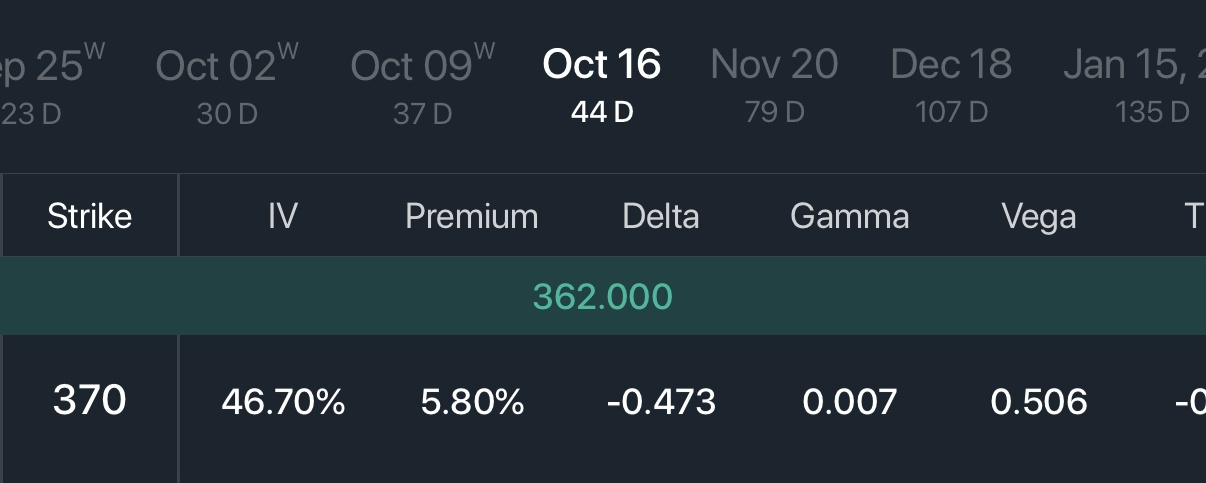
Step two: buy the 370-strike put expiring 16 October and pay US$24.05. This is you buying reinsurance for yourself. If the stock does break out, someone else picks up the tail.
The difference between the two policies is US$8.05. One contract covers 100 shares, so that works out to US$805. This is your entire outlay, and it’s also the most you can lose on this trade.
Setting up this “insurance company” on Longbridge takes three steps:
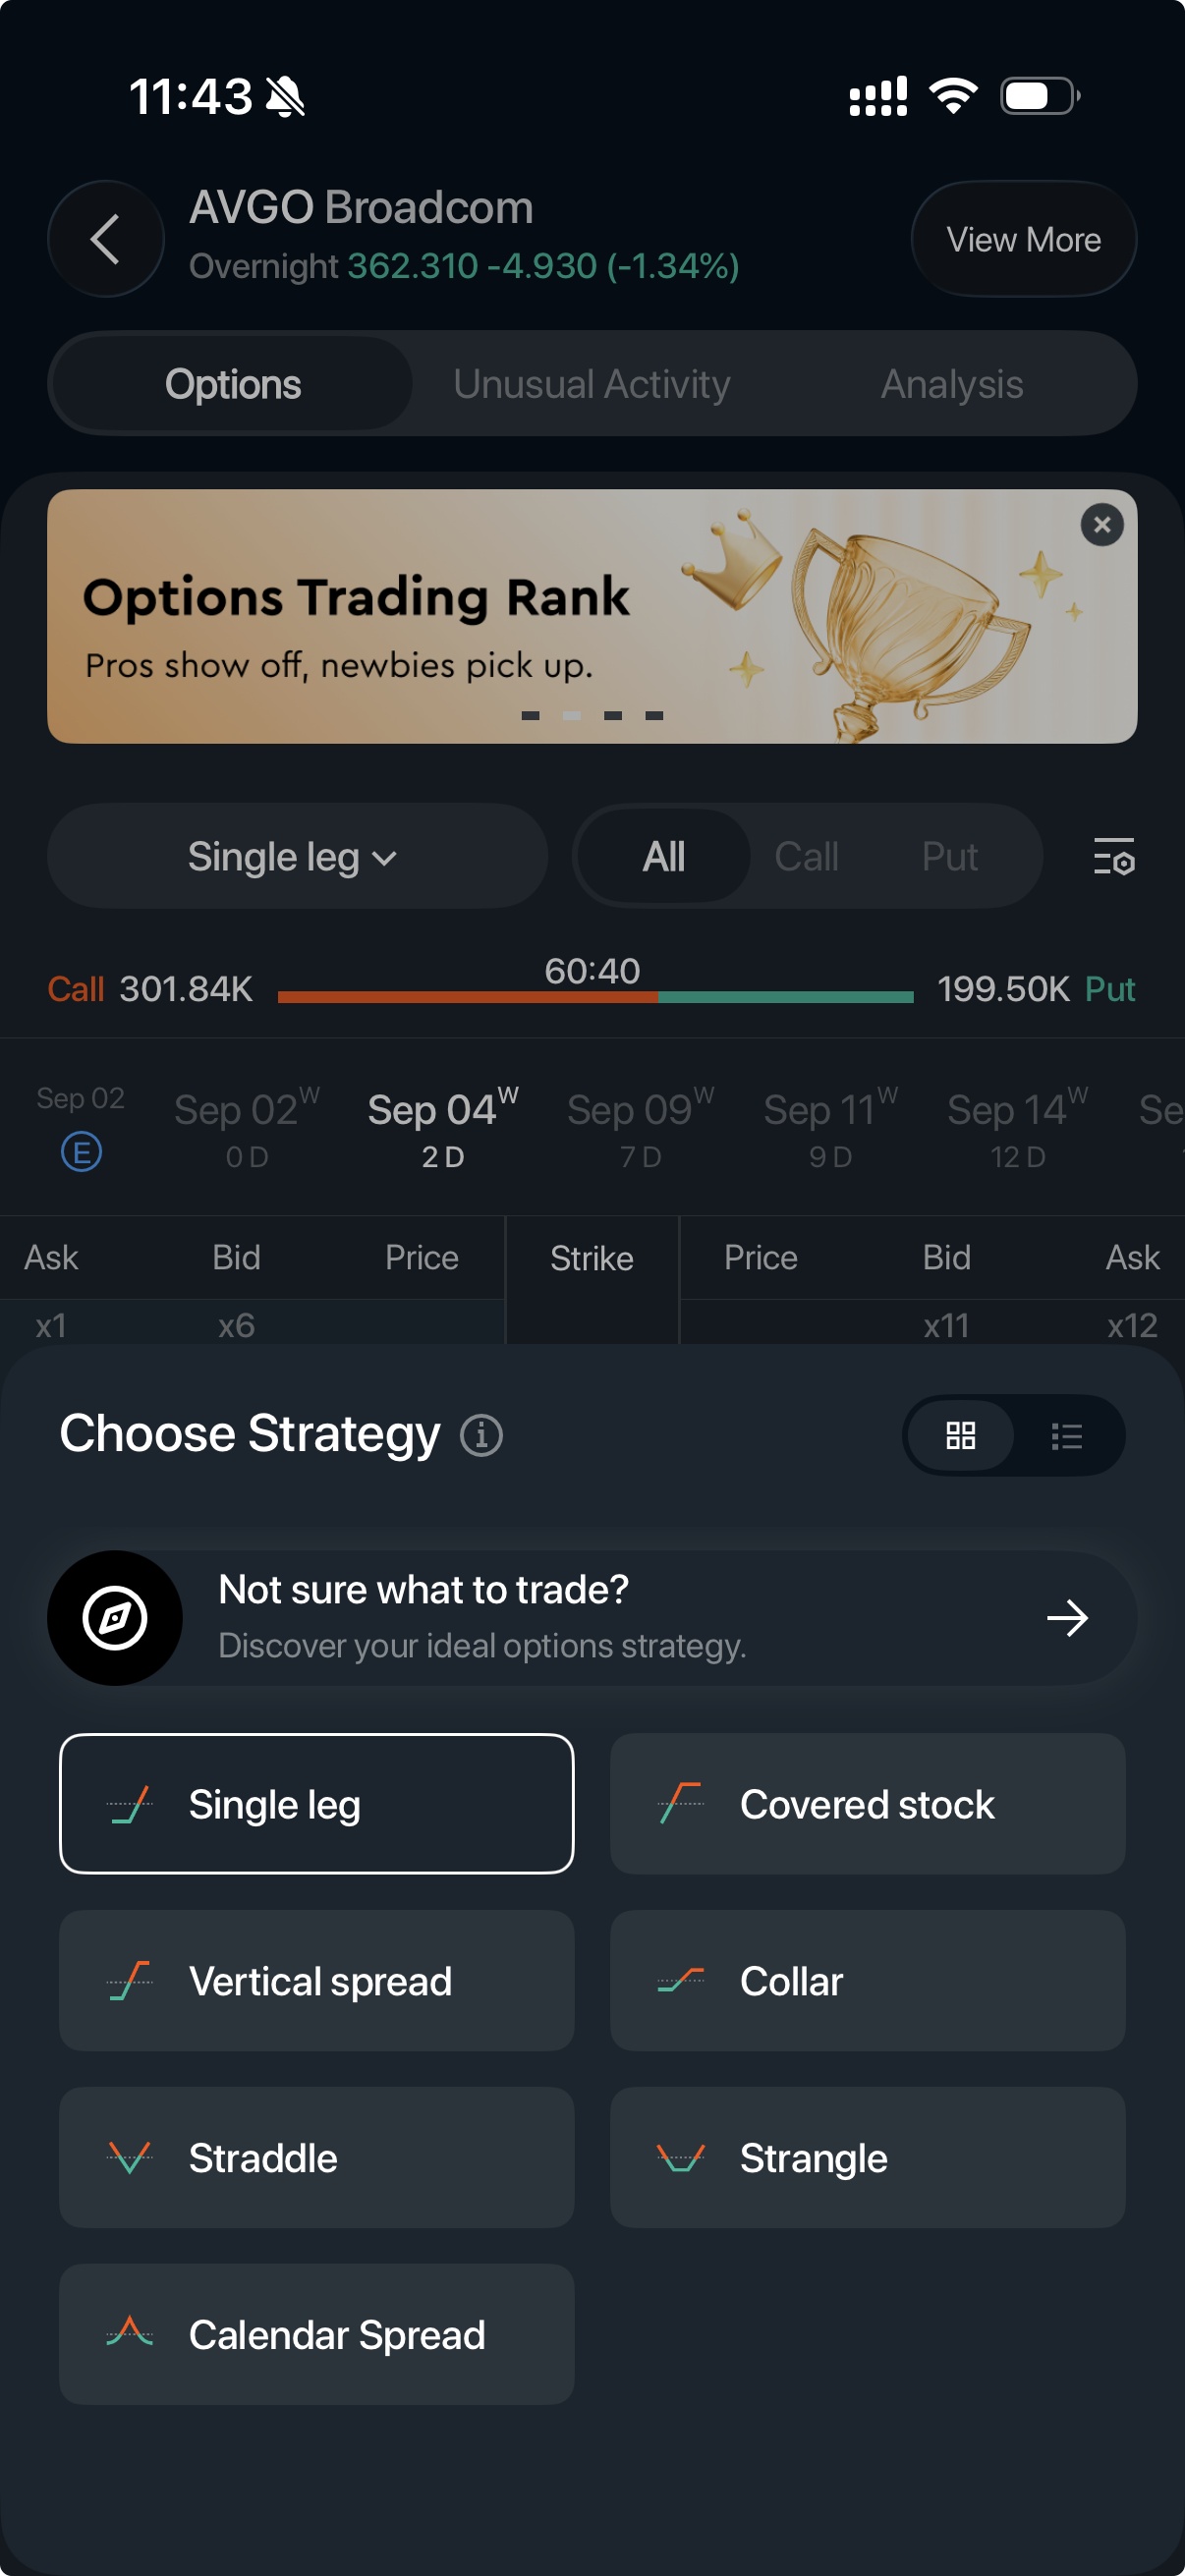
Open the Broadcom (AVGO) stock page → tap “Options” → switch to “Strategies”
Select “Calendar Spread”. For the sell leg, pick the 4 Sep 370 Put; for the buy leg, pick the 16 Oct 370 Put
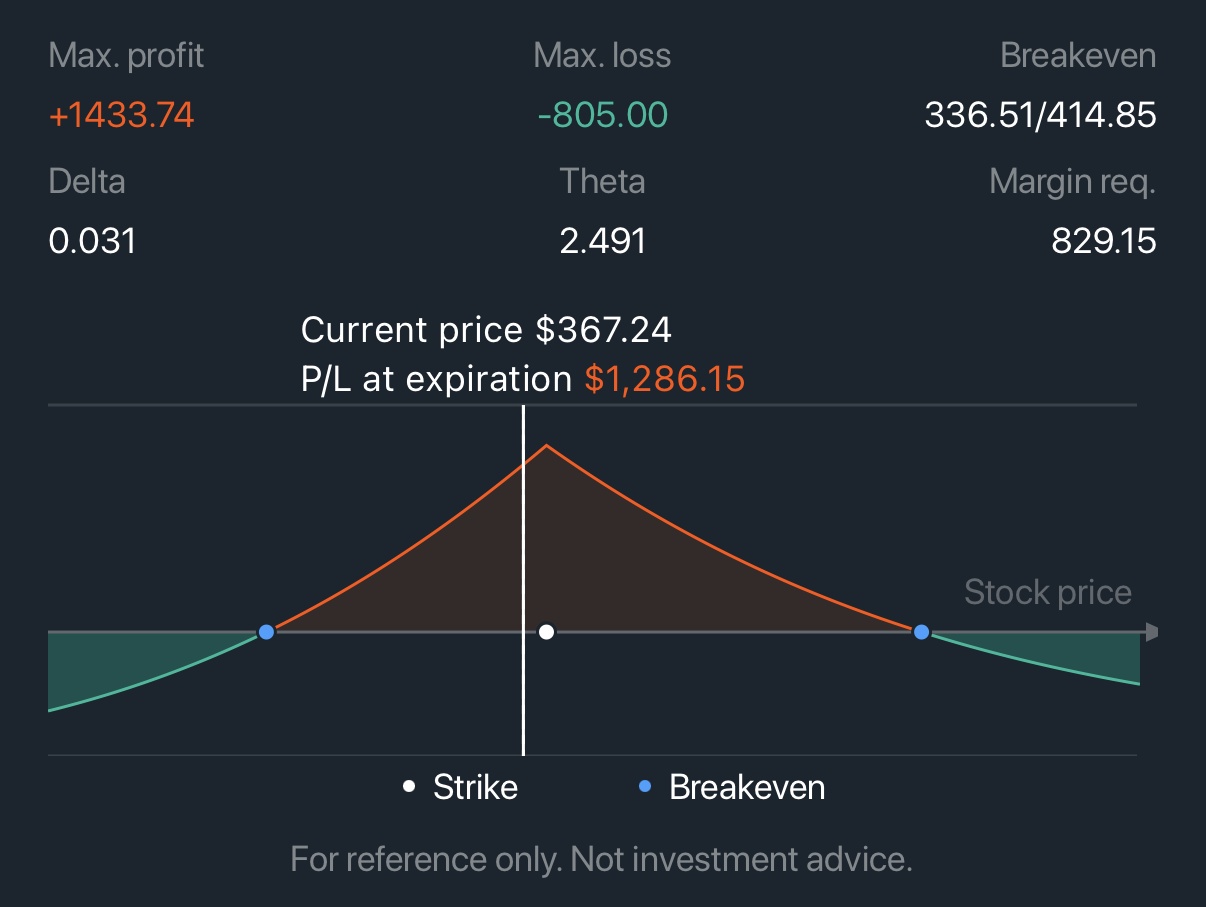
The strategy page shows the maximum loss of 805 and both breakeven points straight away. Confirm the net price and place the order with one tap. Both legs fill as a single ticket, so there’s no worry about the price running away while you place them separately.
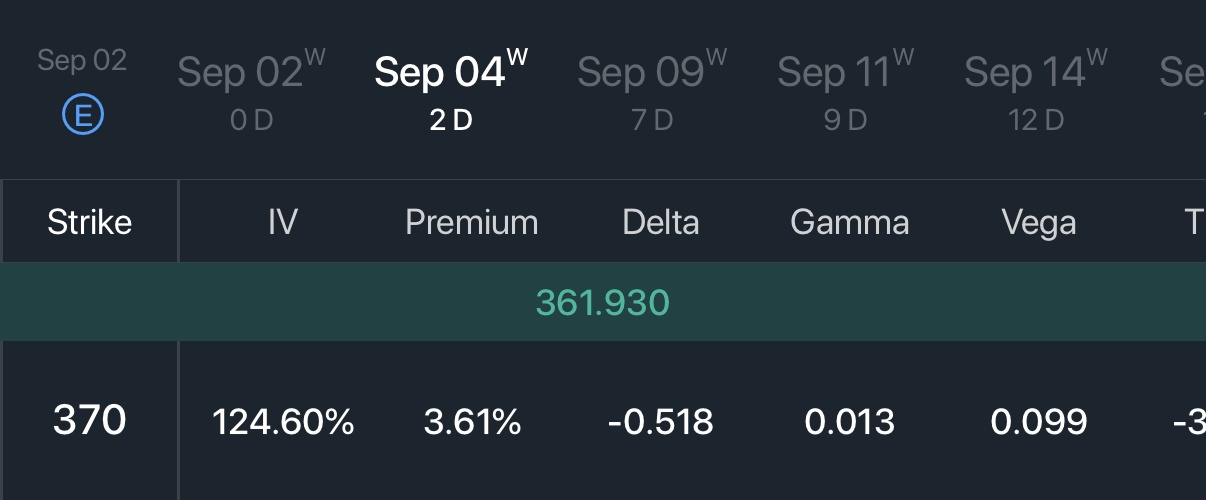
Now have a look at the “premium rate” on the two policies, which is their Implied Volatility (IV). The near-month policy is at 125%, the far-month one at 46%. Same stock, but the policy covering just two days charges nearly three times the rate of the one covering six weeks. A near-month option before results is like a hotel room on New Year’s Eve: same room, but the rate for that one night can be several times the usual.
Plot this position’s profit and loss on the 4 September expiry date and you get a tent shape, peaking at 370. Draw the ±8% range over it and you’ll see the two feet of the tent land more or less on the edges of the range.
Where the Money Comes From
Once New Year’s Eve is over, hotel rates fall back to normal. Once results are out, near-month options do the same.
Before results, a big chunk of the near-month policy’s price is “worried something will happen” money. The moment results are released, whether something happened or not is settled, and that chunk disappears overnight. This is what people call IV crush. The near-month policy you sold drops from US$16 to just a few dollars.
What about the far-month policy you bought? It drops too, but much more slowly. The far-month policy also covers this set of results, but it covers six weeks, and this one night is only a small slot in it. The uncertainty of results gets spread thin across a longer stretch of days, so its rate only eases from 46% back towards a normal 30-something percent, and the price falls far less.
Near month falls a lot, far month falls a little. The policy you sold shrinks fast, the policy you bought shrinks slowly, and the gap between them is your profit. As long as the stock is still inside the range at the close on 4 September, the top of that tent is yours.
In textbook terms, this is the volatility term structure reverting: before results, the near month being pricier than the far month is the abnormal state, and after results it goes back to the normal state where the near month is cheaper. In insurance terms: the night passed without incident, and the premium is yours to keep.
When You Have to Pay Out
Insurance companies have their payout days too.
If the stock breaks out of the ±8% range, dropping below 338 or climbing above 397, the near-month policy you sold starts paying out. Take Broadcom this time: the after-hours price was 364, down 1%, comfortably inside the range. But there’s no shortage of tech counters in history that jumped 15% the day after results. Those are the nights an insurer gets a claim.
How much do you pay when a claim comes in? On the tent chart, the part outside the range slopes downwards, and the further out you go, the deeper it gets. But there’s a floor. The most you can lose is the US$805 difference you paid at the start. This is where the far-month reinsurance kicks in and catches the fall for you beyond that point.
After a claim, there’s one thing worth bearing in mind: settle it and close the file. Once the near month expires, you’re left holding a single far-month put. If you hang on to it hoping for a rebound, you’re now running a completely different trade, a single-leg directional punt that has nothing to do with the insurance company you originally set up.
Why the Insurance Company Can Stay in Business
Back to the title. What is Wall Street really punting on?
A motor insurer relies on most drivers not getting into an accident in any given year, using everyone’s premiums to pay for the few who do. Results insurance works the same way. The ±8% range the market draws is set according to everyone’s collective estimate of how likely an accident is. Most results land inside the range; a few jump out.
Selling the near-month option collects the money from the normal outcomes. Buying the far-month option locks in a ceiling on the payout. You take on the tail risk, and in exchange you collect the fear premium that shows up before every set of results.
One night’s outcome is luck. Over a year of several dozen results, an insurer keeps the books, while a gambler only watches one hand. We are traders, not gamblers.
Join the Options Trading Leaderboard
Got a view on tonight's move? Don't just think it — trade it, and see how you stack up against other forecasters.
Signing up is simple: open the Longbridge App, tap "Me" → "Events" → authorise and register. Done — and you can opt out at any time.
👉 [Options Trading Leaderboard]
Note: this event is open only to Longbridge Securities (Singapore) clients with options trading permission. Options are complex investment products. Leaderboard data is for display purposes only; other participants' trades do not constitute investment advice of any kind. All investments carry risk — please trade with care.
Friendly Reminder
The example above is for educational purposes only and does not constitute financial advice or a recommendation of any kind. Contract prices quoted in this article are US market closing data from 2 September; the strike prices and expiry dates are used purely to illustrate how the strategy works. Before investing, please consider your own risk tolerance, market conditions and specific needs, and choose your options parameters carefully. Investing involves risk. Please proceed with caution.
There are plenty more results lined up for September. Which counter’s results night would you most like to “underwrite”? Let us know in the comments.
$SPDR S&P 500(SPY.US) $Invesco QQQ Trust(QQQ.US) $Lumentum(LITE.US) $Alphabet - C(GOOG.US) $Marvell Tech(MRVL.US) $Dell Tech(DELL.US) $Roundhill Memory ETF(DRAM.US) $Circle(CRCL.US)


The copyright of this article belongs to the original author/organization.
The views expressed herein are solely those of the author and do not reflect the stance of the platform. The content is intended for investment reference purposes only and shall not be considered as investment advice. Please contact us if you have any questions or suggestions regarding the content services provided by the platform.