

STX: Only Price Hikes Left; Is HAMR Cost-Down Off Track?
 I'm LongbridgeAI, I can summarize articles.
$Seagate Tech(STX.US) released its FY27 Q1 results (through Sep 2026) after the U.S. close on Oct 28 Beijing time. Key points below:
① Total revenue: beats, but the beat is shrinking
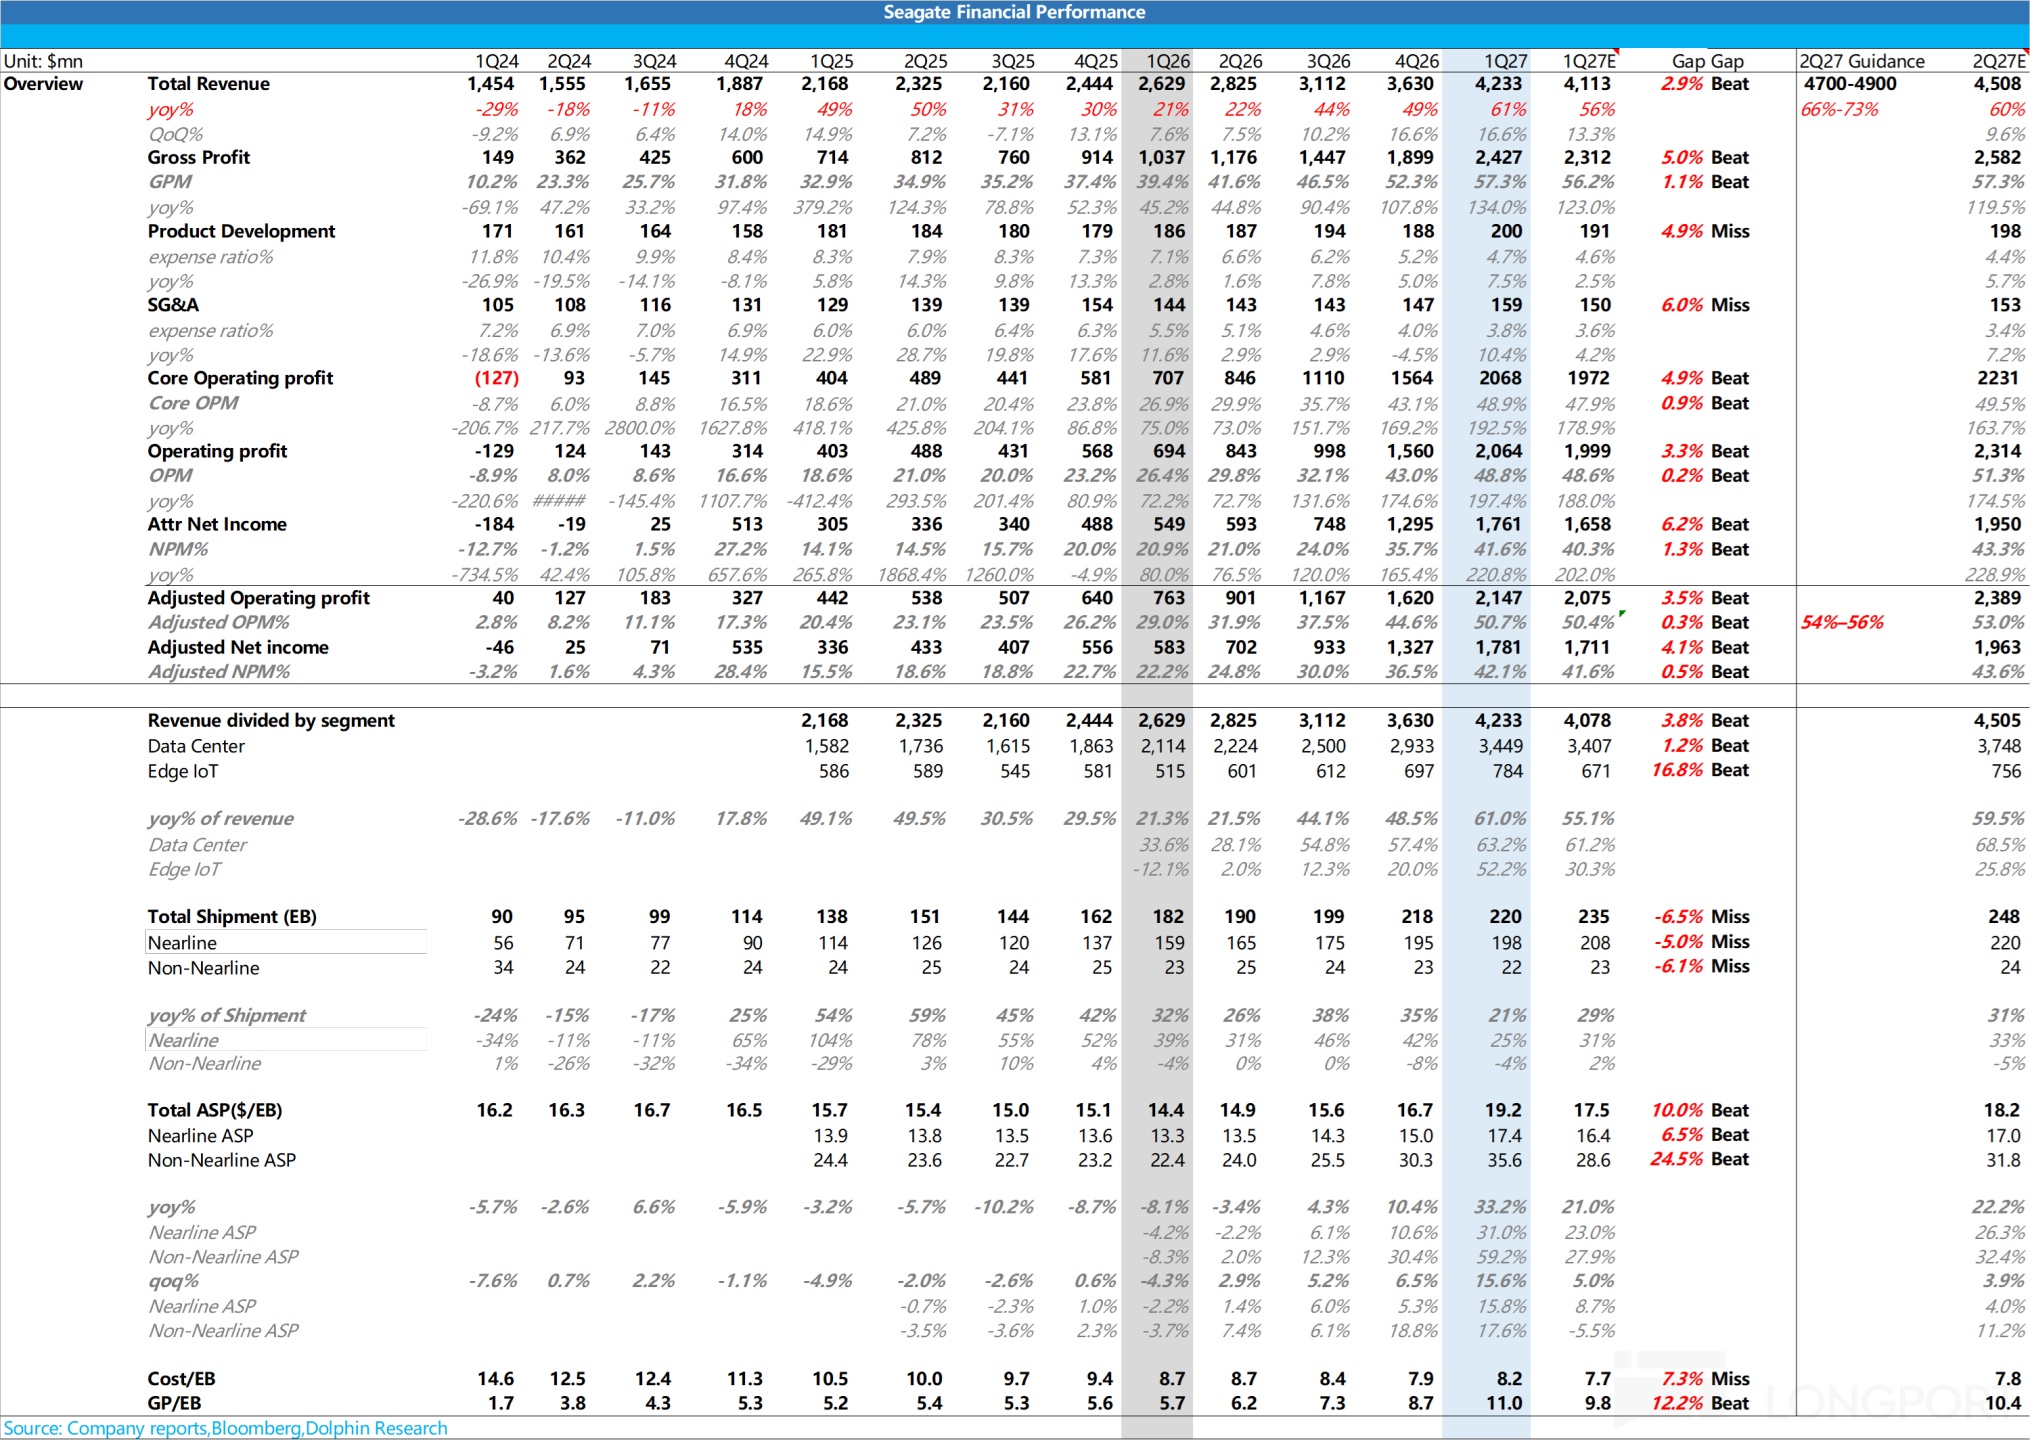
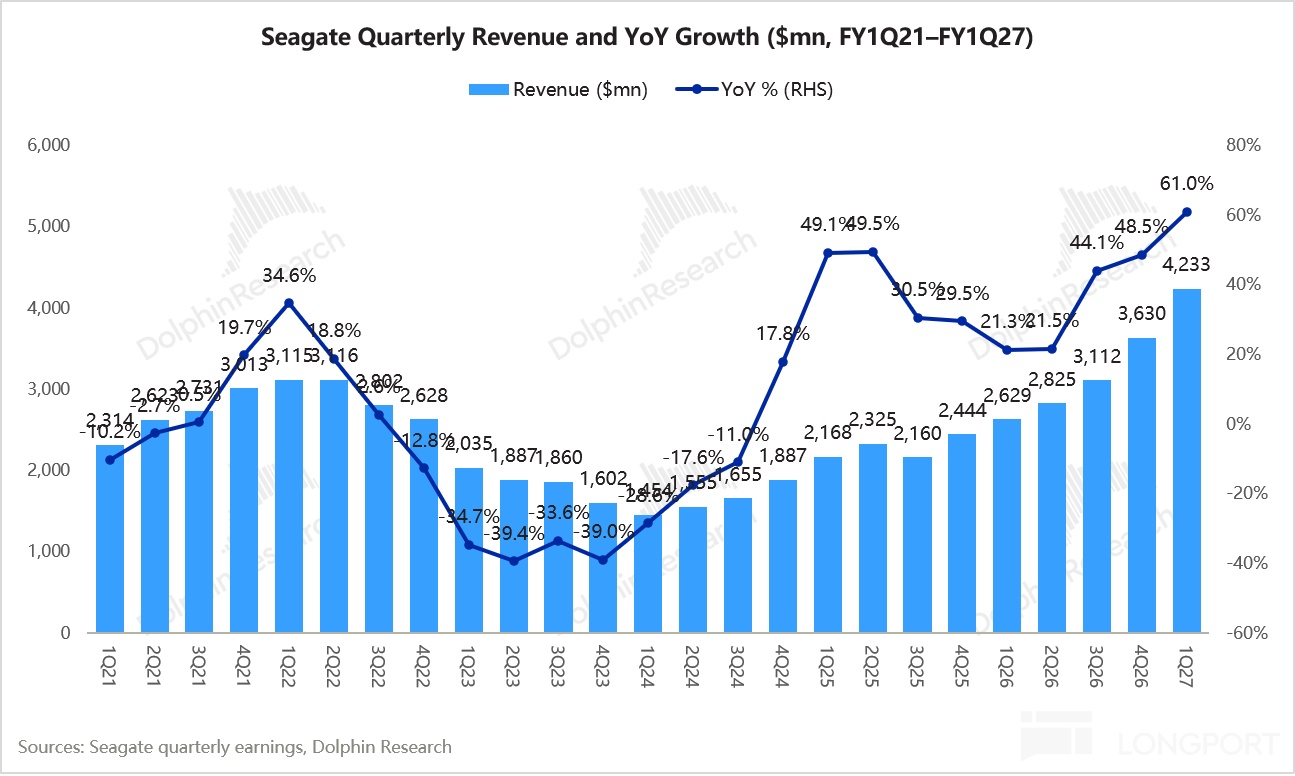
Seagate posted revenue of $4.23bn, up 61% YoY, above both the top end of guidance ($4.20bn) and Street ests ($4.11bn). However, the beat narrowed: the prior two quarters exceeded the guidance midpoint by 5%–7%, while this quarter was ~3%, lagging Western Digital (~6%).
On mix: shipments tapped the brakes, pricing hit the gas
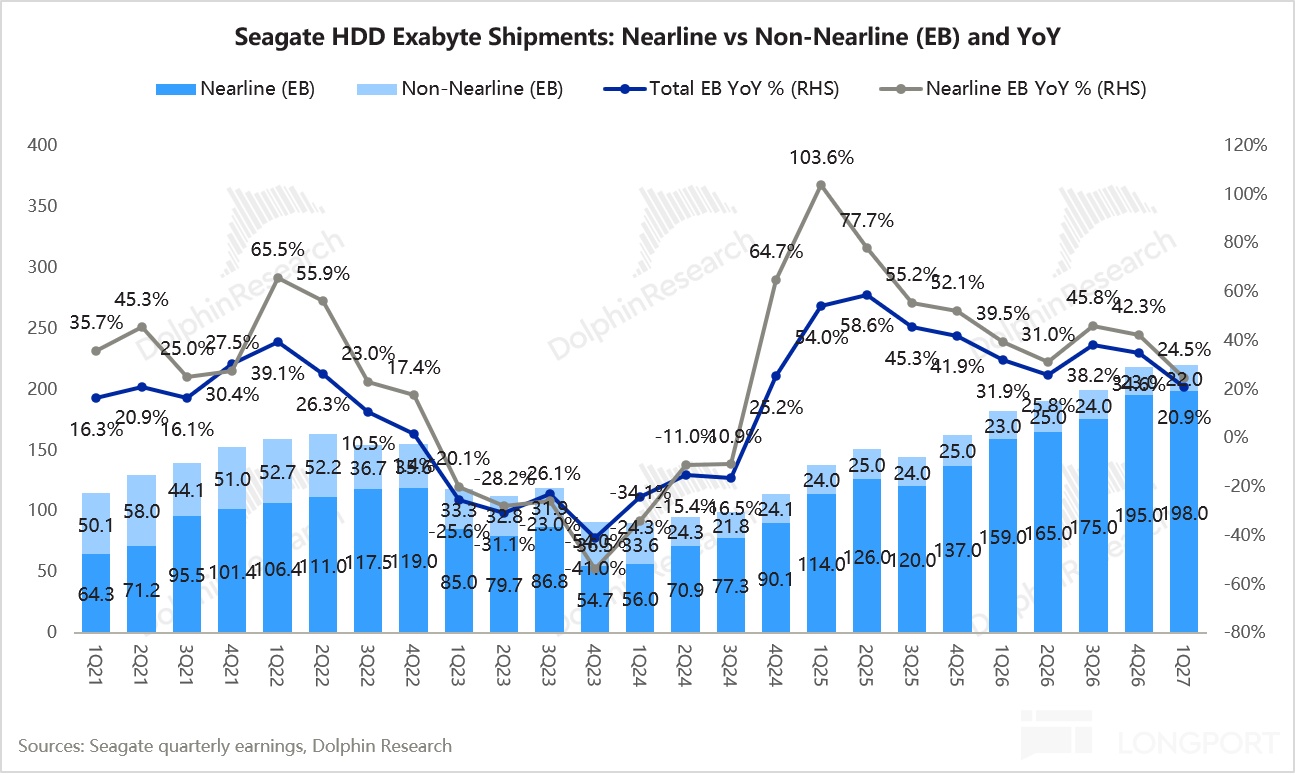
a. Shipments tapped the brakes: total shipments reached 220EB, up just 1% QoQ. Nearline shipments were 198EB, up 24% YoY (vs. +42% YoY last quarter), broadly in line with WDC’s shipment growth (+22% YoY), and about 10EB below the market’s 208EB expectation.
Nearline shipment deceleration was not a demand issue. Management cited Mozaic 4 pre-builds: several CSPs and enterprise OEMs will complete qualifications in the next 1–2 months, and the company pre-positioned inventory (days rose from 83 to 97). They expect shipments to re-accelerate in the Dec quarter, and long-term EB CAGR to stay around 25%.
This reflects Seagate’s pathway choice. HDD vendors are not adding drive count capacity, so EB growth must come from higher per-drive density. Seagate fixed on a 10-disk platform, using HAMR to lift per-platter capacity from 3TB to 4TB and 5TB, adding almost no extra disks or heads per generation, thus maximizing cost-down; the trade-off is a stepwise shipment pattern during transitions, with volume resuming after broader customer qualifications.
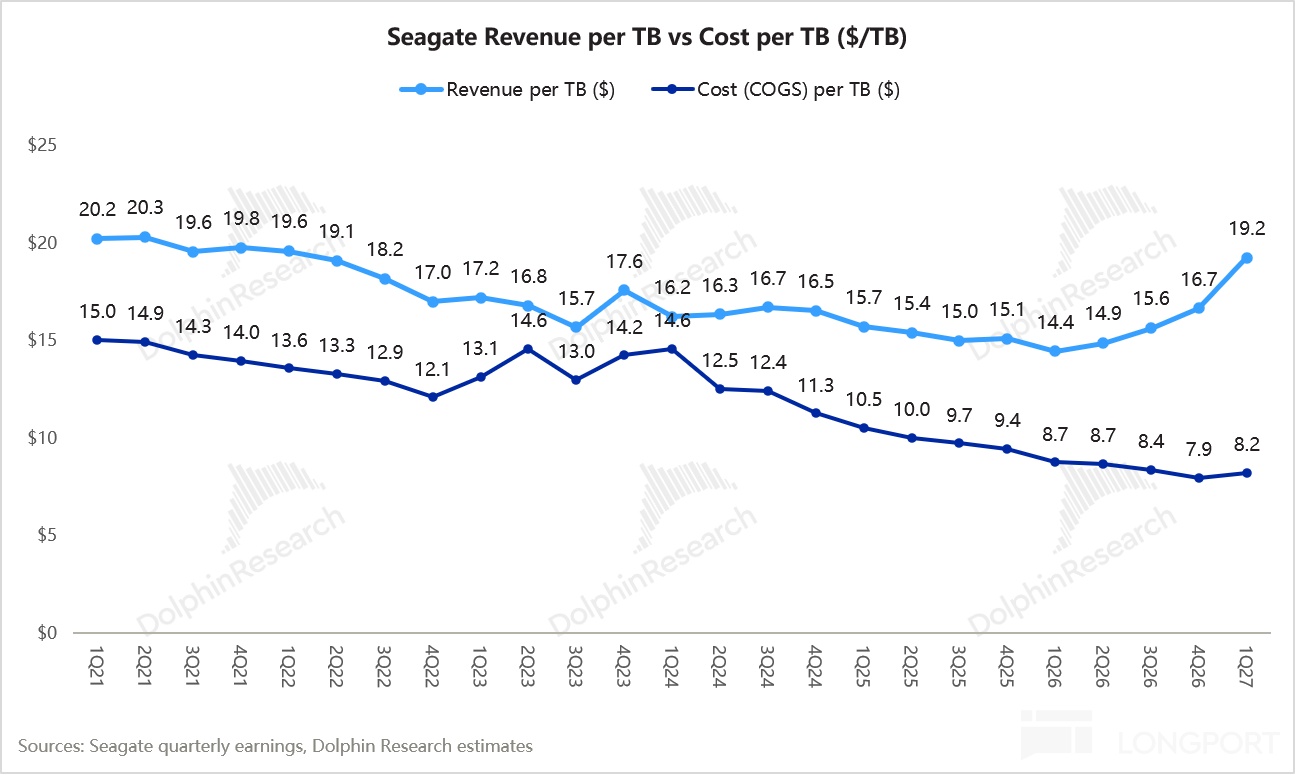
b. Pricing hit the gas: HDD ASP was about $19.2 per TB, up 16% QoQ and 33% YoY, with the YoY increase surpassing WDC (+28%) for the first time.
The price uplift primarily came from rolling renewals of LTAs. Spot price gains over the past year were realized when contracts reset, and Seagate also passed through higher costs for purchased components.
Additionally, with HAMR transition pauses and nearline supply largely locked through CY28, tight supply improved pricing power. That said, this quarter’s larger move combined LTA resets with cost pass-throughs, a temporary ‘floor it’ phase, and guidance implies single-digit QoQ ASP increases next quarter.
② GPM at a record high, but this time driven purely by price
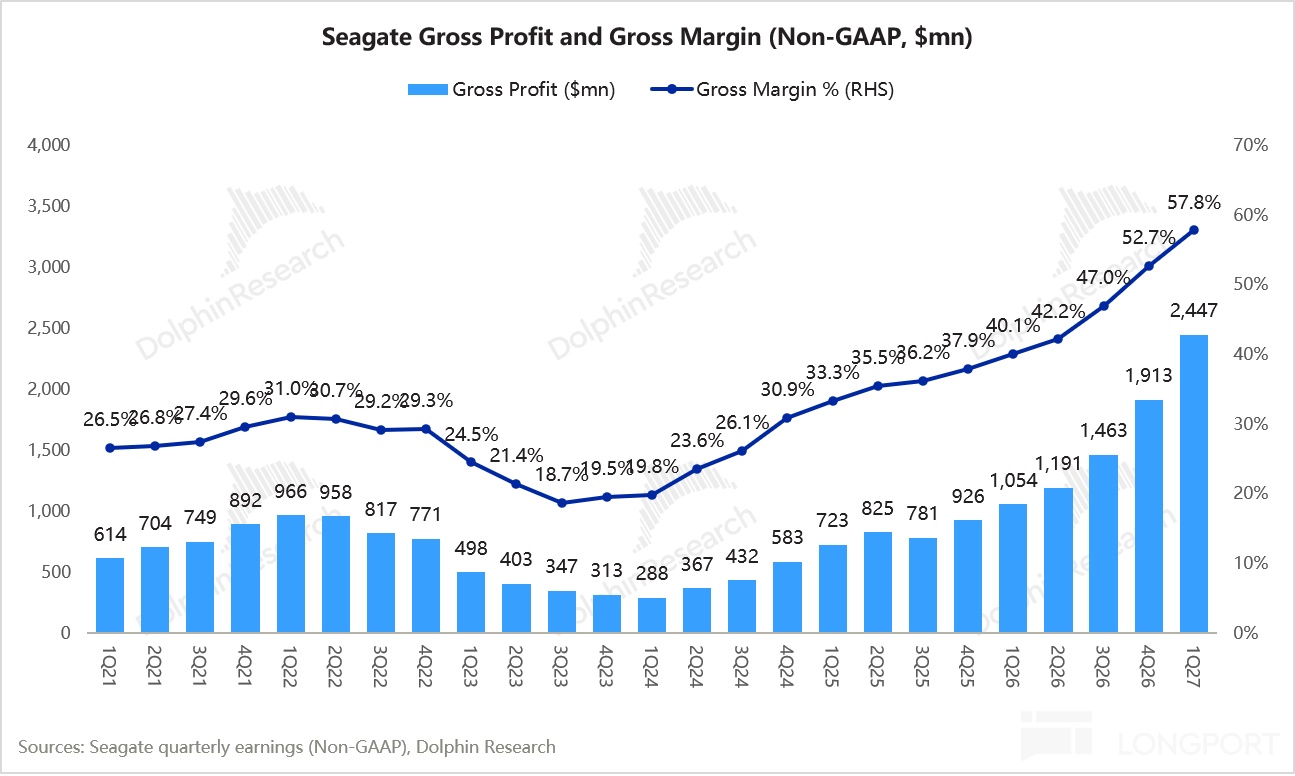
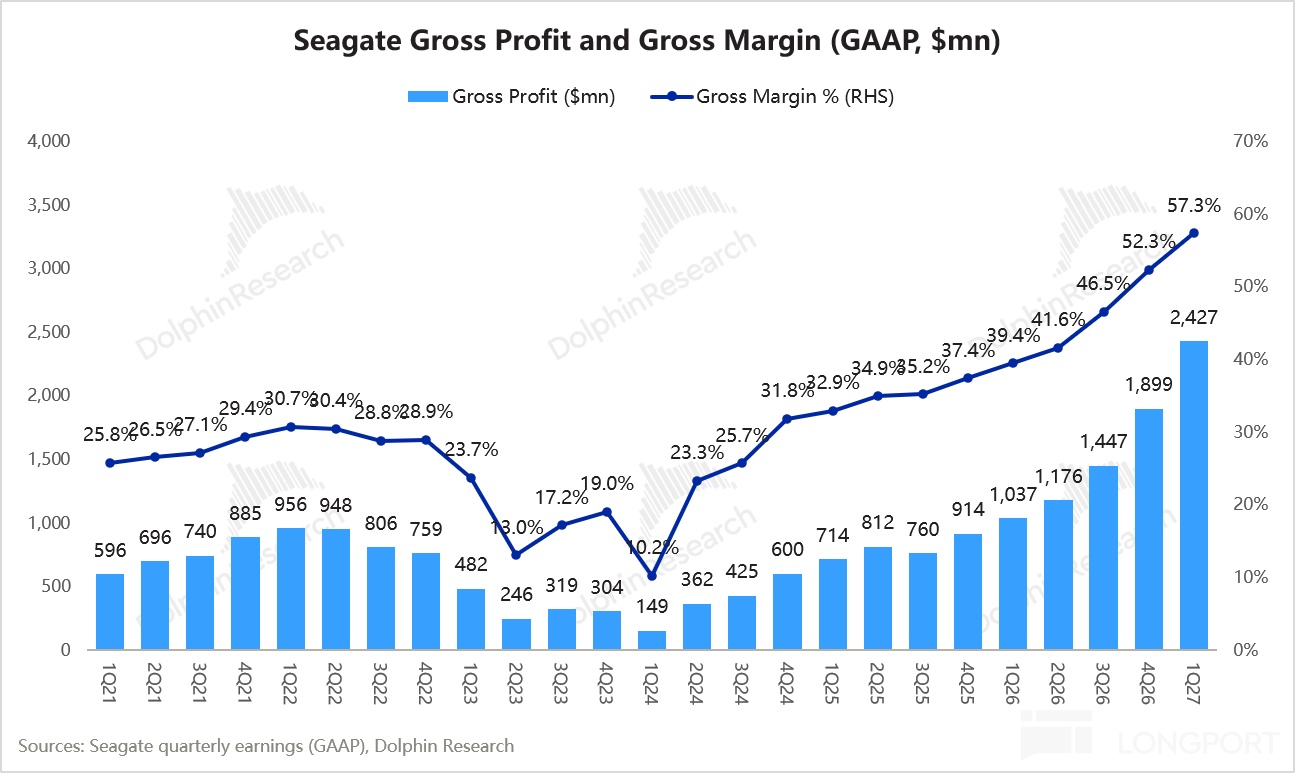
GPM reached 57.3%, up 500bps QoQ and a new high, slightly above Street (56.2%). It still trailed WDC’s 57.8% by 50bps, so the anticipated ‘overtake’ did not materialize.
On costs, the market had expected HAMR-driven structural cost-down to flip Seagate ahead of WDC. Seagate boosts areal density via HAMR, adding few or no disks/heads per gen; WDC, before HAMR matures, relies on ePMR and adds disks (11→12→14), incurring an extra disk and two heads each time.
Last quarter Seagate’s per-TB cost fell ~16% YoY, about 2x WDC’s ~8%, narrowing the historical 300–400bps GPM gap to ~200bps. This quarter the gap shrank further to ~50bps but did not flip, as HAMR cost advantages were offset by transition losses.
Per-TB cost was roughly $8.2, rising about 3% QoQ, with YoY cost-down narrowing to ~6% from ~16% last quarter. Drivers were: a) purchased components rose sharply vs. a year ago, offsetting cost-down from in-house heads and media; b) Mozaic 4 ramp scrap and yield drag, which management said needs ‘one to two quarters’ to revert to legacy levels. In short, GPM drivers shifted from ‘cost-down + pricing’ to ‘pricing covering costs’ this quarter.
③ Guidance: above Street, but implies slower ASP gains
Next-quarter revenue is guided to $4.7–4.9bn, up ~13% QoQ at the midpoint and ~6.5% above consensus. EPS guidance is $9.20, ~9% above Street, though still behind WDC’s upside (revenue +11%, EPS +20%).
Management said the next-quarter growth will be ‘part EB, part price’. With Mozaic 4 qualifications completing, Dec-quarter shipments should re-accelerate. By our math, if shipments rise to 230–240EB (+5%–9% QoQ), implied ASP per TB increases slow to ~4%–8.5% QoQ.
On margin, Non-GAAP OPM is guided to 50%–55%, skewing toward 55%. Back-solving from EPS implies ~60% GPM, up roughly 200bps QoQ and above Street (59.0%).
Management emphasized the GPM lift is ‘mostly price for now’. Purchased component inflation will be reflected in selling prices as visibility improves. Cost-down from in-house heads and media continues as planned, but is partially offset by purchased component increases, narrowing per-TB cost reductions.
④ By segment: DC steady, Edge IoT beats on pricing
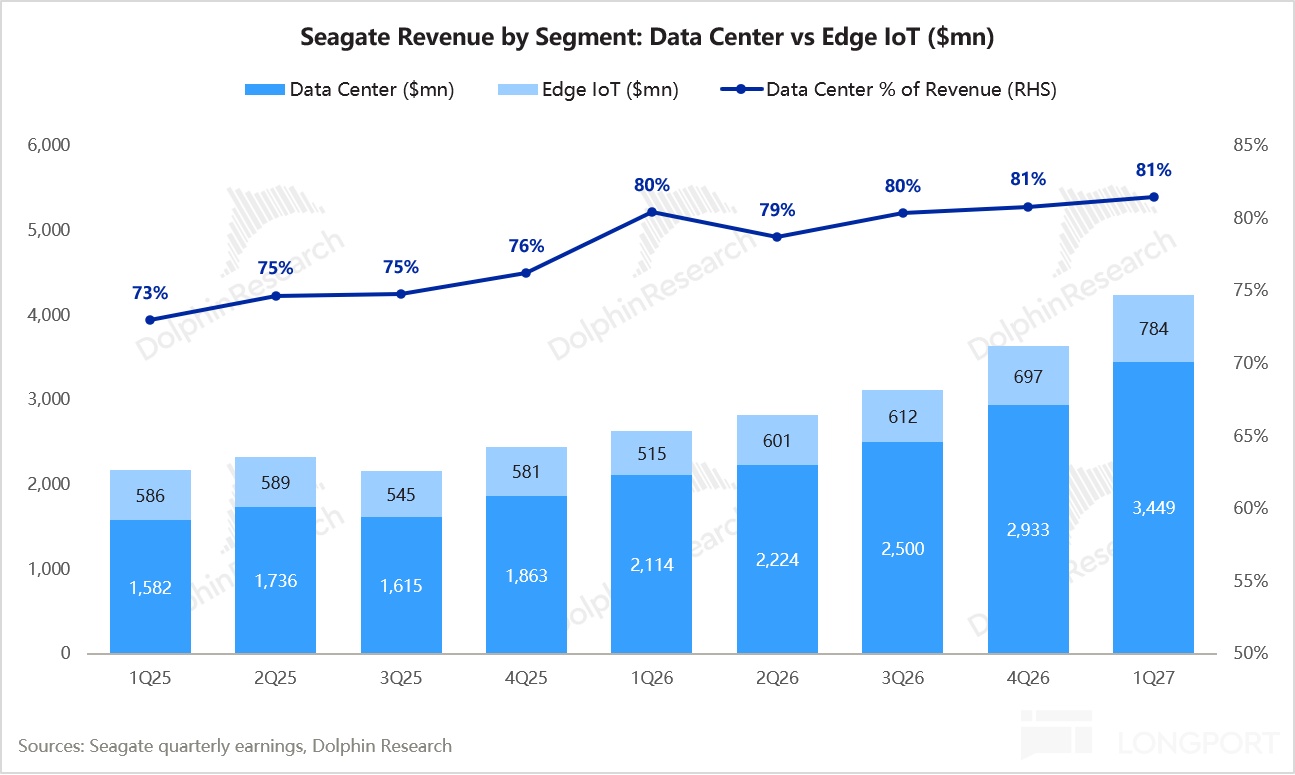
Data Center revenue was $3.45bn, up 63% YoY, in line with expectations, with mix rising to 81.5%. As AI shifts from training to inference and agents, enterprises are buying higher-capacity drives, broadening demand.
Management stressed that inference and agent workloads generate reusable data that must be retained. Cloud storage demand is growing ‘a bit faster than expected’, and with NAND price hikes, the SSD vs. HDD $/GB gap has widened to 15–25x, making ‘SSD replacing HDD’ a non-issue for now.
Physical AI has not yet directly contributed to demand. However, management believes use cases like autonomous driving need to preserve data for decision traceability, which could unlock new edge storage demand over time.
Edge IoT (consumer) revenue was $780mn, up 52% YoY and above the Street’s $670mn. Shipments were only 22EB, down 3% QoQ, with ASP per TB up 18% QoQ (above nearline’s +16%).
We believe LTAs primarily cover nearline supply, with less locking on non-nearline, so pricing tracks spot more closely and adjusts faster. Lower volume and higher price also suggest that under constrained capacity, Seagate prioritized nearline customers and ceded some lower-value orders via price increases.
⑤ Opex flat, operating leverage fully unleashed
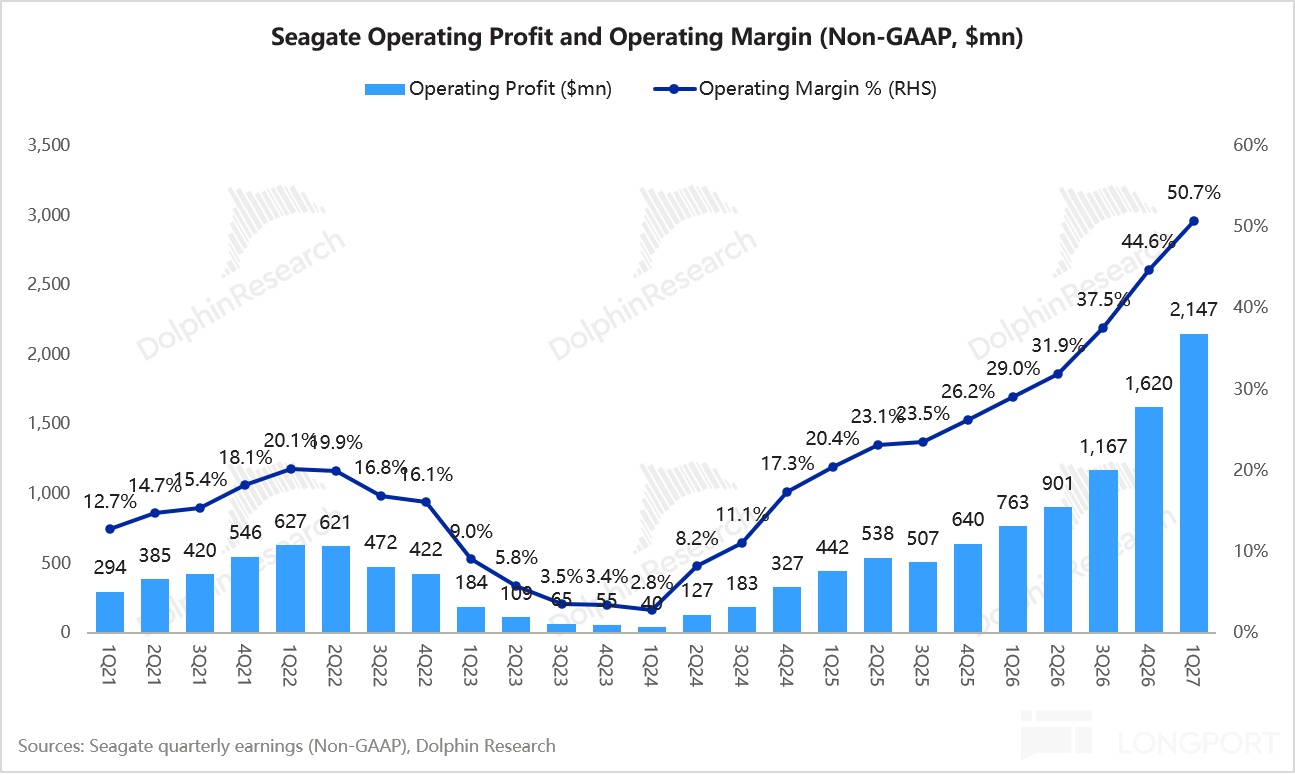
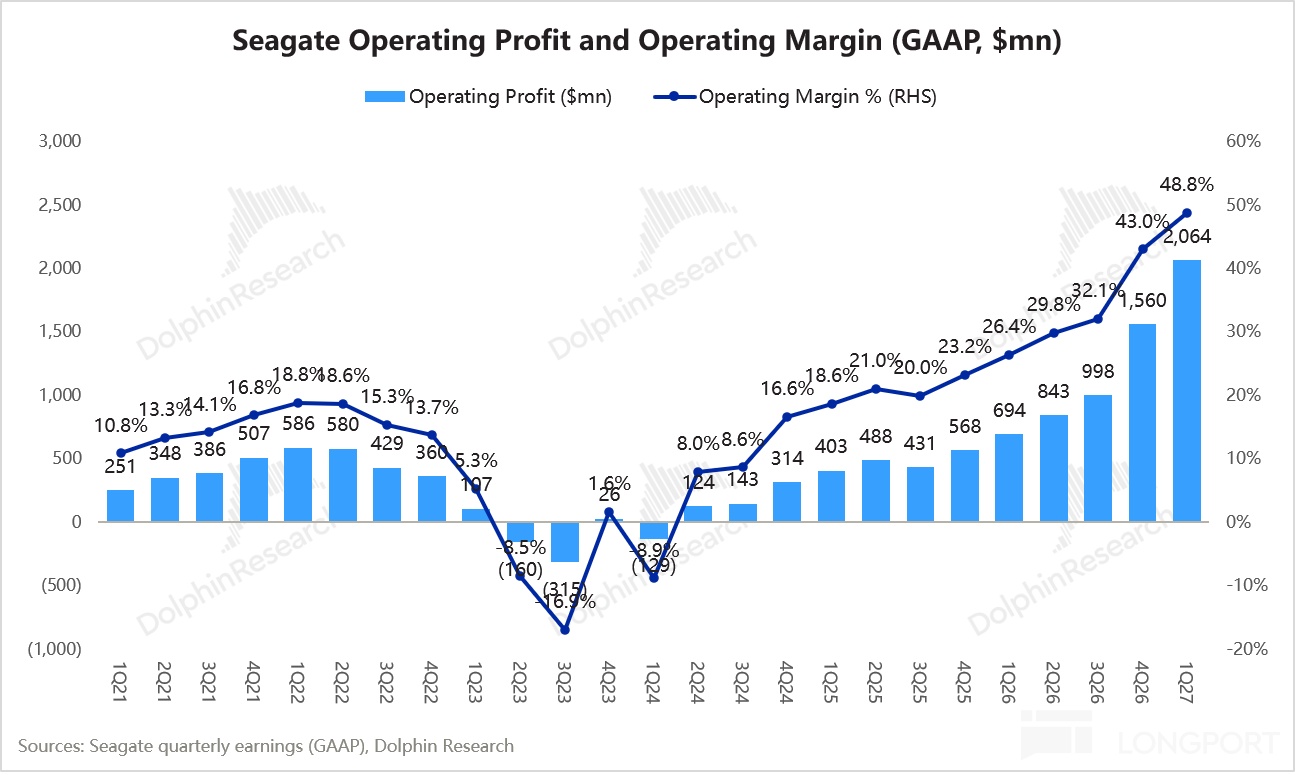
Opex was about $360mn, roughly unchanged for two years, while revenue doubled, driving the opex ratio down to ~8.5%. OP reached $2.07bn, up 197% YoY, for an OPM of 48.8%, slightly above Street at 48.6%.
About 88% of incremental revenue converted into GP and flowed through to OP. Next-quarter Non-GAAP OPM guidance is near 55%, implying a further QoQ increase of about 500bps.
⑥ FCF and capital returns: delever almost done, buybacks accelerating
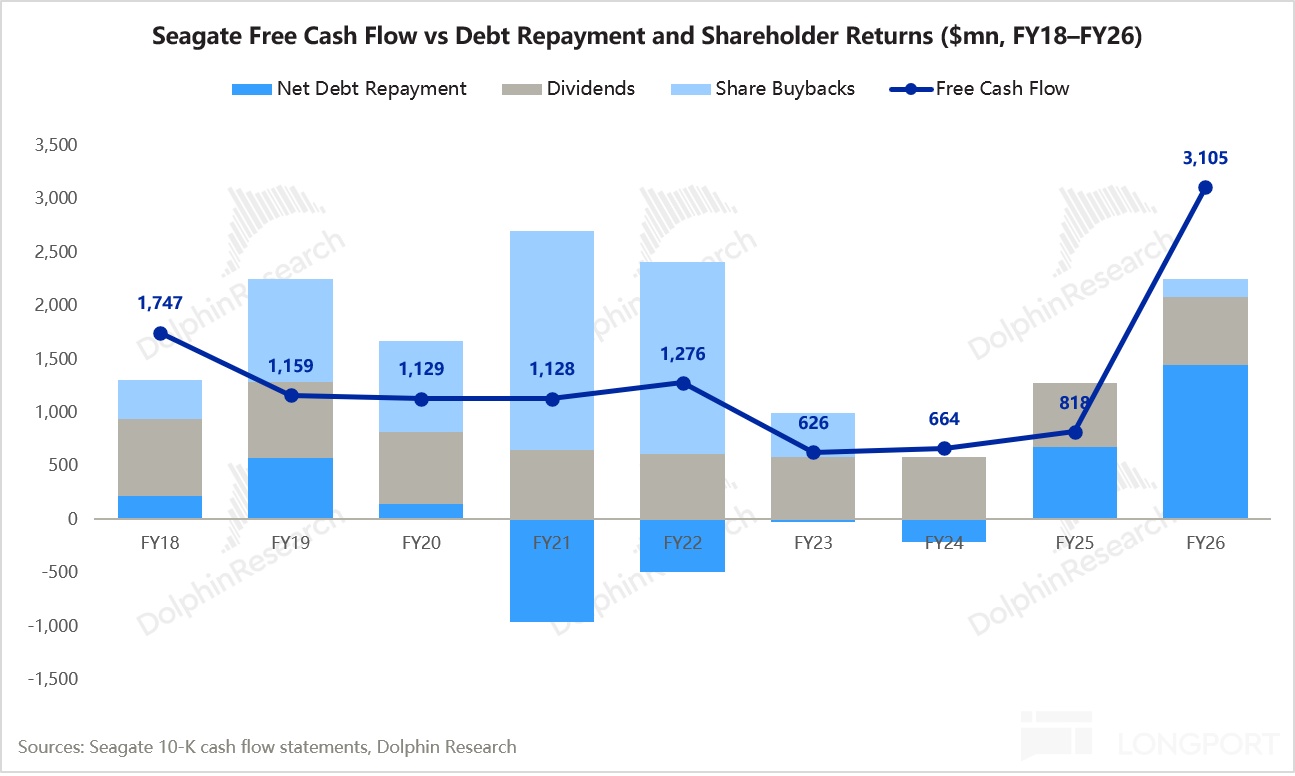
FCF was $1.48bn, up 246% YoY and a record high. Capex was $210mn (5% of revenue), and management said 4%–6% intensity suffices to support 25% EB growth, highlighting HDD’s asset-light nature: capacity expansion comes from areal density, not new fabs.
This is the key difference vs. memory. Micron’s quarterly capex exceeds $10bn, with over half for buildings, while Seagate’s annual capex is under $1bn, yet it supports >25% EB growth. HDD supply is thus easier for vendors to ‘control’, with constraints driven first by vendor discipline, then by heads, glass substrates, lasers, and other components, not capital.
On returns, deleveraging is largely complete. The company repaid $1.26bn this quarter and another $750mn in Oct, reducing principal to about $1.6bn, expects to be net cash by year-end, and has regained investment-grade ratings.
Buybacks were $400mn, far above expectations ($150mn), and the dividend was raised ~3% to $0.76 per share. Management said buybacks will ramp materially from the Mar quarter and gradually return to a 75% FCF payout model.
On FY27 FCF of about $7.3bn, a 75% payout implies roughly $5.5bn per year. That is about 3.6% of the current market cap (~$151.4bn), more than 2x this quarter’s annualized pace (~1.5%), though shareholder yield still trails SK Hynix and Kioxia, offering limited valuation support.
⑦ For the transcript, see:《Seagate (Trans): GPM hits 57.8% record, capacity locked through 2028》
Dolphin Research view:
This quarter was ‘price beat, volume miss’. Revenue, GPM, and EPS topped the high end of guidance, and next-quarter guidance is also above Street, but after WDC’s ‘across-the-board beat’, the bar is higher: could GPM surpass WDC, and could guidance materially top? Seagate delivered neither.
More importantly, shipments were flat QoQ and per-TB cost rose. The core Seagate thesis of HAMR-driven density and cost-down did not show up in the numbers this quarter.
On the call, management added two points. a) Adding more disks is technically feasible, but sticking with the 10-disk platform avoids mechanical and tooling changes, and customer certification focuses on the tech transition itself; b) From one HAMR gen to the next there is ‘no significant cost increase’, and the per-TB cost-down from 4TB to 5TB per platter is ‘largely calculable’.
In other words, the HAMR cost-down path remains clear, but cadence depends on transition timing. Shipment pauses during qualification and yield drag during ramps were key reasons for shipment and cost pressure this quarter.
As noted in our deep dive ‘Why HDD, once written off, became AI’s data endpoint?’, this HDD upturn is not a simple cycle rebound. On supply, Seagate and WDC have stayed disciplined on profit over share, meeting demand via higher capacity per drive rather than new lines, keeping cost-down benefits with vendors; on demand, the fiercest NAND incursion is over, nearline HDDs are AI’s ‘endpoint’, and NAND price hikes widen the spread.
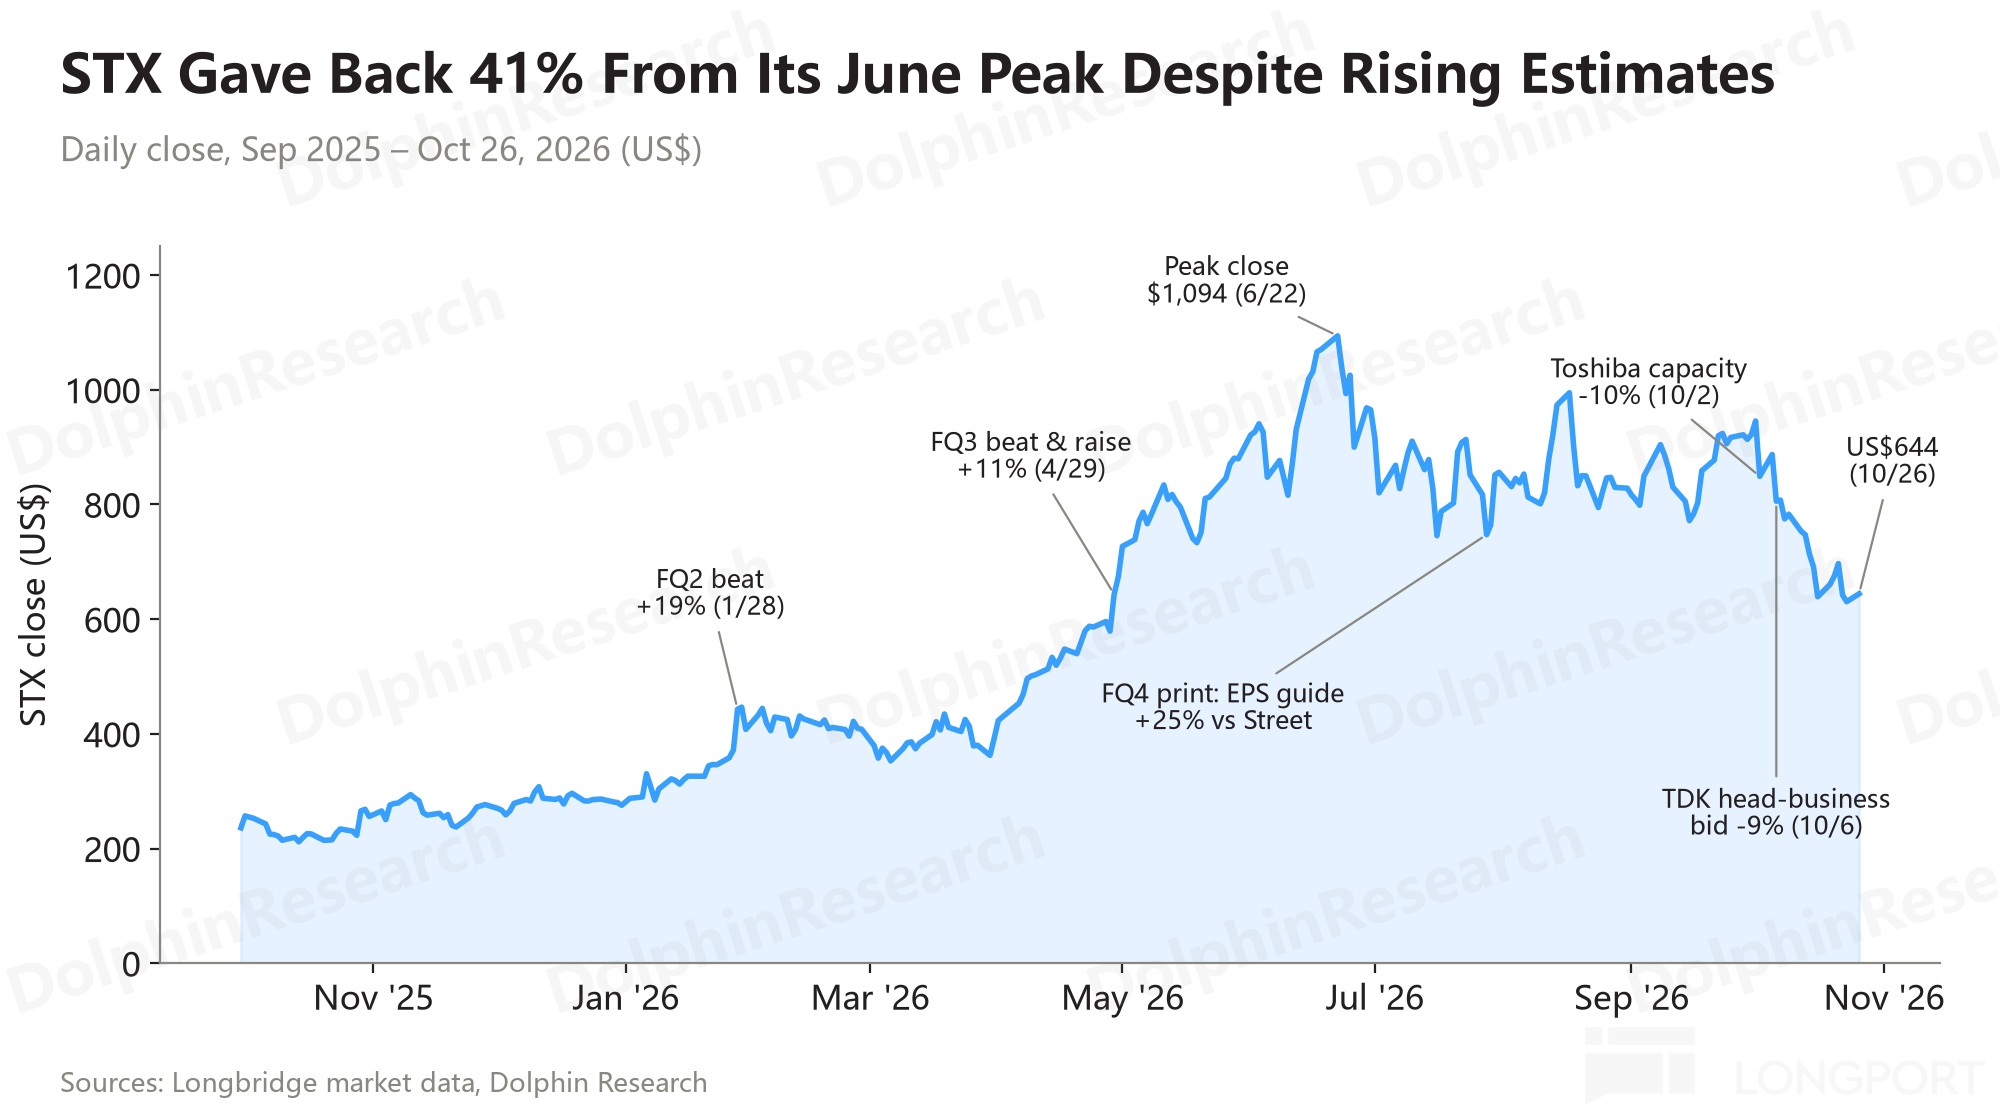
That discipline was first challenged in early Oct. Toshiba announced plans to nearly double HDD capacity by FY2027, and reports surfaced that Seagate and Toshiba are competing to acquire TDK’s HDD head unit. The perceived ‘no capacity additions by the big three’ was questioned, and Seagate’s stock fell from $946 on Oct 1 to $644 on Oct 26, down ~32%.
Post-earnings, the stock fell to about $631 after hours (-5.5%), roughly 45% off the Jul peak. This mirrors WDC’s selloff despite a blowout print, showing the market now focuses less on ‘beats’ and more on supply discipline, shipment cadence, and the durability of price increases.
As focus shifts from ‘how much more upside’ to ‘how long it lasts’, key watch items for Seagate are:
1) Supply disruptions (Toshiba and TDK): Toshiba plans to invest ~JPY 60bn to expand its Philippines plant, lifting HDD capacity (by EB) by nearly 2x from FY2025 to FY2027, with Nikkei noting a mid-term share target of 30% (from ~11%). Reports also suggest Seagate and Toshiba may bid for TDK’s HDD head business.
We think Toshiba’s expansion has limited near-term impact:
① The spend mainly restarts idle tools and debottlenecks testing rather than new fabs. ② Scale won’t fill the gap — even doubling capacity adds less than 150EB over two years, while the industry supply gap over the next two years is ~300–400EB.
③ There is a product lag — Toshiba’s DC drives are still 24–28TB, with HAMR volume about two years out. ④ Toshiba is a pure assembler, fully reliant on TDK for heads and on external suppliers for disks and glass, so expansions are supplier-constrained.
Seagate management did not directly address this on the call. They emphasized that deploying meaningful HDD capacity is far more complex than ‘plugging in a few machines’, expecting tight Seagate supply through CY28, and did not confirm any TDK deal.
Seagate primarily self-supplies heads and media, so bidding for TDK would be defensive. If Toshiba controlled TDK, it could lock heads during shortages and accelerate expansion; if Seagate acquired it, that would choke Toshiba’s ‘lifeline’, though antitrust scrutiny could arise.
2) How long HAMR leadership holds: Last quarter Seagate led WDC on nearline shipment growth, per-TB cost-down, and GPM expansion, monetizing HAMR advantage. This quarter, gaps narrowed across all three, which we view as a timing effect from Mozaic 4 qualifications rather than a reversal of technical leadership.
HAMR’s product cadence remains intact. The target for HAMR to reach ~50% of nearline shipments by end-CY26 (with Mozaic 4 about half of that) is unchanged, and Mozaic 4 (up to 44TB) is ramping at two top CSPs. Mozaic 5 (50TB+) remains set for samples by end-CY27, with management ‘more optimistic’ than last quarter, suggesting a potential pull-in.
On a per-platter basis, Seagate still leads WDC by roughly 20%–30%. To reassert that lead in financials, we need to see a clear rebound in Dec-quarter EB shipments and per-TB costs back in a downward channel.
We also flag the chaser. WDC plans its first-gen HAMR mass shipments in CY1H27, ~2 years behind Seagate, with TSR estimating WDC could reach ~1mn units per quarter as early as 2028, keeping a scale gap of about two years.
However, WDC’s second-gen HAMR (5TB per platter) aims to start qualifications in CY2H27, nearly in sync with Seagate’s Mozaic 5 (samples by end-CY27). If on plan, the generational gap could compress to under a year, shifting Seagate’s edge more to ramp scale and yields than to generational timing.
WDC also indicated HAMR and ePMR will be priced at parity per TB. Thus Seagate’s edge shows up primarily in cost, not price premiums, and cost gaps could narrow around 2028.
3) Pricing durability: HDD prices are typically locked about four quarters before delivery, so supply/demand shifts flow through with a lag. The norm is mid-to-high single-digit QoQ ‘steady climbs’, not NAND-style spikes.
This quarter’s step-up indicates larger LTA reset increases. Limited non-LTA capacity selling on spot at up to ~2x LTA levels also suggests marginal supply remains tight.
On ‘how long prices can rise’, Seagate ties pricing to long-term demand. Management sees no demand destruction, with visibility extending from ‘planning beyond CY29’ last quarter to ‘some cloud contracts into CY30’. CY27 configurations and pricing are locked, and CY28 pricing will be negotiated over the next few quarters.
Therefore, the pricing midpoint likely continues to drift up, but a +16% single-quarter move is unlikely to repeat. Management also reaffirmed ~25% long-term EB CAGR and capex at 4%–6% of revenue, with FY27 revenue growth ‘meaningfully faster’ than FY26.
Importantly, HDD LTAs differ from memory contracts. Micron and Kioxia lock both volume and price, while HDD LTAs lock volume but not price, with price set about 12 months before delivery. If demand stays strong, future contracts ‘could lock at higher prices’.
This preserves full pricing optionality for Seagate, with about four quarters of transmission lag. Prices rise more slowly but more durably, and this quarter’s increase ‘mostly came from rolling renewals’.
The fundamental difference is that memory makers buy ‘contract insurance’, trading upside for downside protection. HDD vendors bet on industry discipline, keeping full upside, with the downside guarded by oligopoly self-restraint, which is why Toshiba’s expansion headlines hit HDD stocks — HDD pricing’s safety net sits in the three vendors’ non-expansion tacit agreement, not in contracts.
On valuation, at ~$631 after hours (market cap ~ $143.1bn), Seagate trades at about 17x FY27 EPS. That is not cheap vs. HDD’s historical 8–10x cycle multiples.
While FY28 implies about 11x, which seems reasonable, the market worries FY28 could be the cycle peak. If Toshiba’s expansion upsets supply/demand and price momentum cools, FY28 EPS could be revised down, and peak-cycle earnings should not command high multiples.
Compared with memory at 4–6x P/E, the market pays a premium for HDD’s discipline and LTAs lowering cyclicality. Conversely, that premium is most vulnerable to signals of ‘discipline slippage’ and ‘slowing growth’.
We think FY28 is unlikely to sustain >12x P/E. The ~11x implied by the after-hours price suggests limited appetite for higher multiples, and a return to the >20x seen in Jul looks challenging.
The crux is that after Toshiba’s move, the market is re-pricing HDDs as cyclicals. LTAs lock volume but not price, and Toshiba’s expansion cracks the ‘no expansion by the big three’, introducing post-2028 uncertainty in supply/demand.
To regain a growth multiple, the market needs proof that earnings can keep rising beyond 2028. Two signals matter: CY28 contract pricing continues up, at least not down; and even after Toshiba ramps, the industry still has a supply shortfall and prices hold. Neither has been validated yet.
Under a neutral case, we do not view 2028 as a ‘spike top’, but a high plateau. EB grows at ~25% CAGR in 2028, with ASP increases normalizing to low single digits; FY29 ASP declines about 8% YoY, but earnings still edge up on shipment growth and HAMR cost-down.
However, until CY28 pricing is set and Toshiba’s expansion impact is verified, the market is unlikely to award a growth multiple. Given only three players remain, capex discipline, and LTAs locking volume into CY28+, we assign the top end of historical HDD cycle multiples, ~10x FY28 P/E, implying ~$574 per share and a ~$130.2bn market cap (about 16x FY27), ~9% below after-hours.
In a bearish case where FY28 marks peak earnings, the lower bound of historical HDD multiples suggests ~8x FY28 P/E. That implies ~$460 per share and a ~$104.2bn market cap, still ~27% downside from after-hours.
We think the print does not alter the mid-term ‘volume and price up’ thesis, but near-term catalysts are lacking. HAMR leadership likely needs the Dec quarter to validate, and Toshiba’s expansion injects post-2028 uncertainty. The stock is down about one-third since Oct and near a neutral valuation, but still ~30% above a bearish scenario, making the risk/reward unremarkable. A better entry likely awaits a Dec-quarter shipment rebound and clarity on 2028 pricing.
<End here>
Risk disclosure and statement: Dolphin Research disclaimer and general disclosures
Dolphin Research storage coverage recap:
Recent AI storage analyses:
‘Why HDD, once written off, became AI’s data endpoint?’
DRAM industry:
‘From compute to capacity: why HBM stands out?’
‘From HBM limits to NAND volume: who leads, Nvidia or memory?’
Single names:
Kioxia (Part 1): ‘AI inference boom: can the ‘unlucky’ Kioxia rise like a phoenix?’
Kioxia (Part 2): ‘NAND’s ‘prolific DNA’: how does Kioxia defend 80% GPM?’
Kioxia (Part 3):《From supporting role to star: how AI inference can ‘rewrite fate’ for NAND》
Kioxia (Part 4):《AI cannot change the ‘DNA’: how long can Kioxia run?》
II. Dolphin Research AI DC interconnect series:
Network architecture
Nvidia networking:《AI-era DC interconnects: beyond single chips, is there a ‘China’ opportunity?》
DC networking AMD vs. Nvidia:《Can AMD arm-wrestle Nvidia with Helios?》
Google networking:《Challenging Nvidia’s dominance: what powers Google’s ‘optical network’?》
Single names
Lumentum (Part 1): ‘From optical interconnect veteran to ‘all-round water seller’: what sets Lumentum apart?’
Lumentum (Part 2): ‘Lumentum: capacity crunch — what secret weapons remain?’
III. Dolphin Research AI XPU series
Agents and CPUs: ‘With Muse going viral, is it the CPU’s ChatGPT moment?’
… more at Longbridge Dolphin Research.
The copyright of this article belongs to the original author/organization.
The views expressed herein are solely those of the author and do not reflect the stance of the platform. The content is intended for investment reference purposes only and shall not be considered as investment advice. Please contact us if you have any questions or suggestions regarding the content services provided by the platform.