


$Gold.com(GOLD.US)
🏆 [Weekly] Gold Watch: Can Bulls Hold the $3,945 Line?
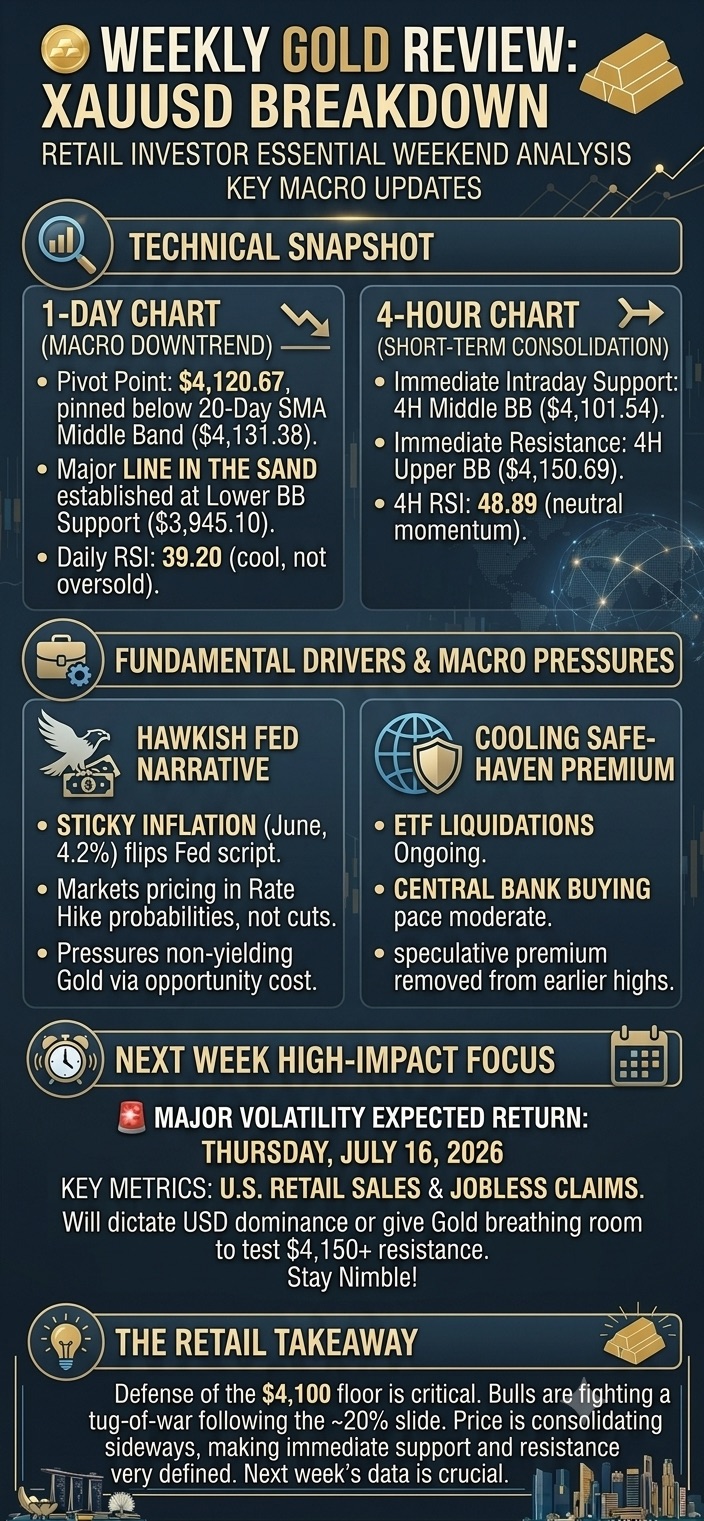
Gold (XAUUSD) is locked in a tight battle to steady itself, after falling 20% from its January peak. Below is your clear weekend breakdown of technical levels and market forces.
🔷Technical Snapshots
🟢 Daily Chart
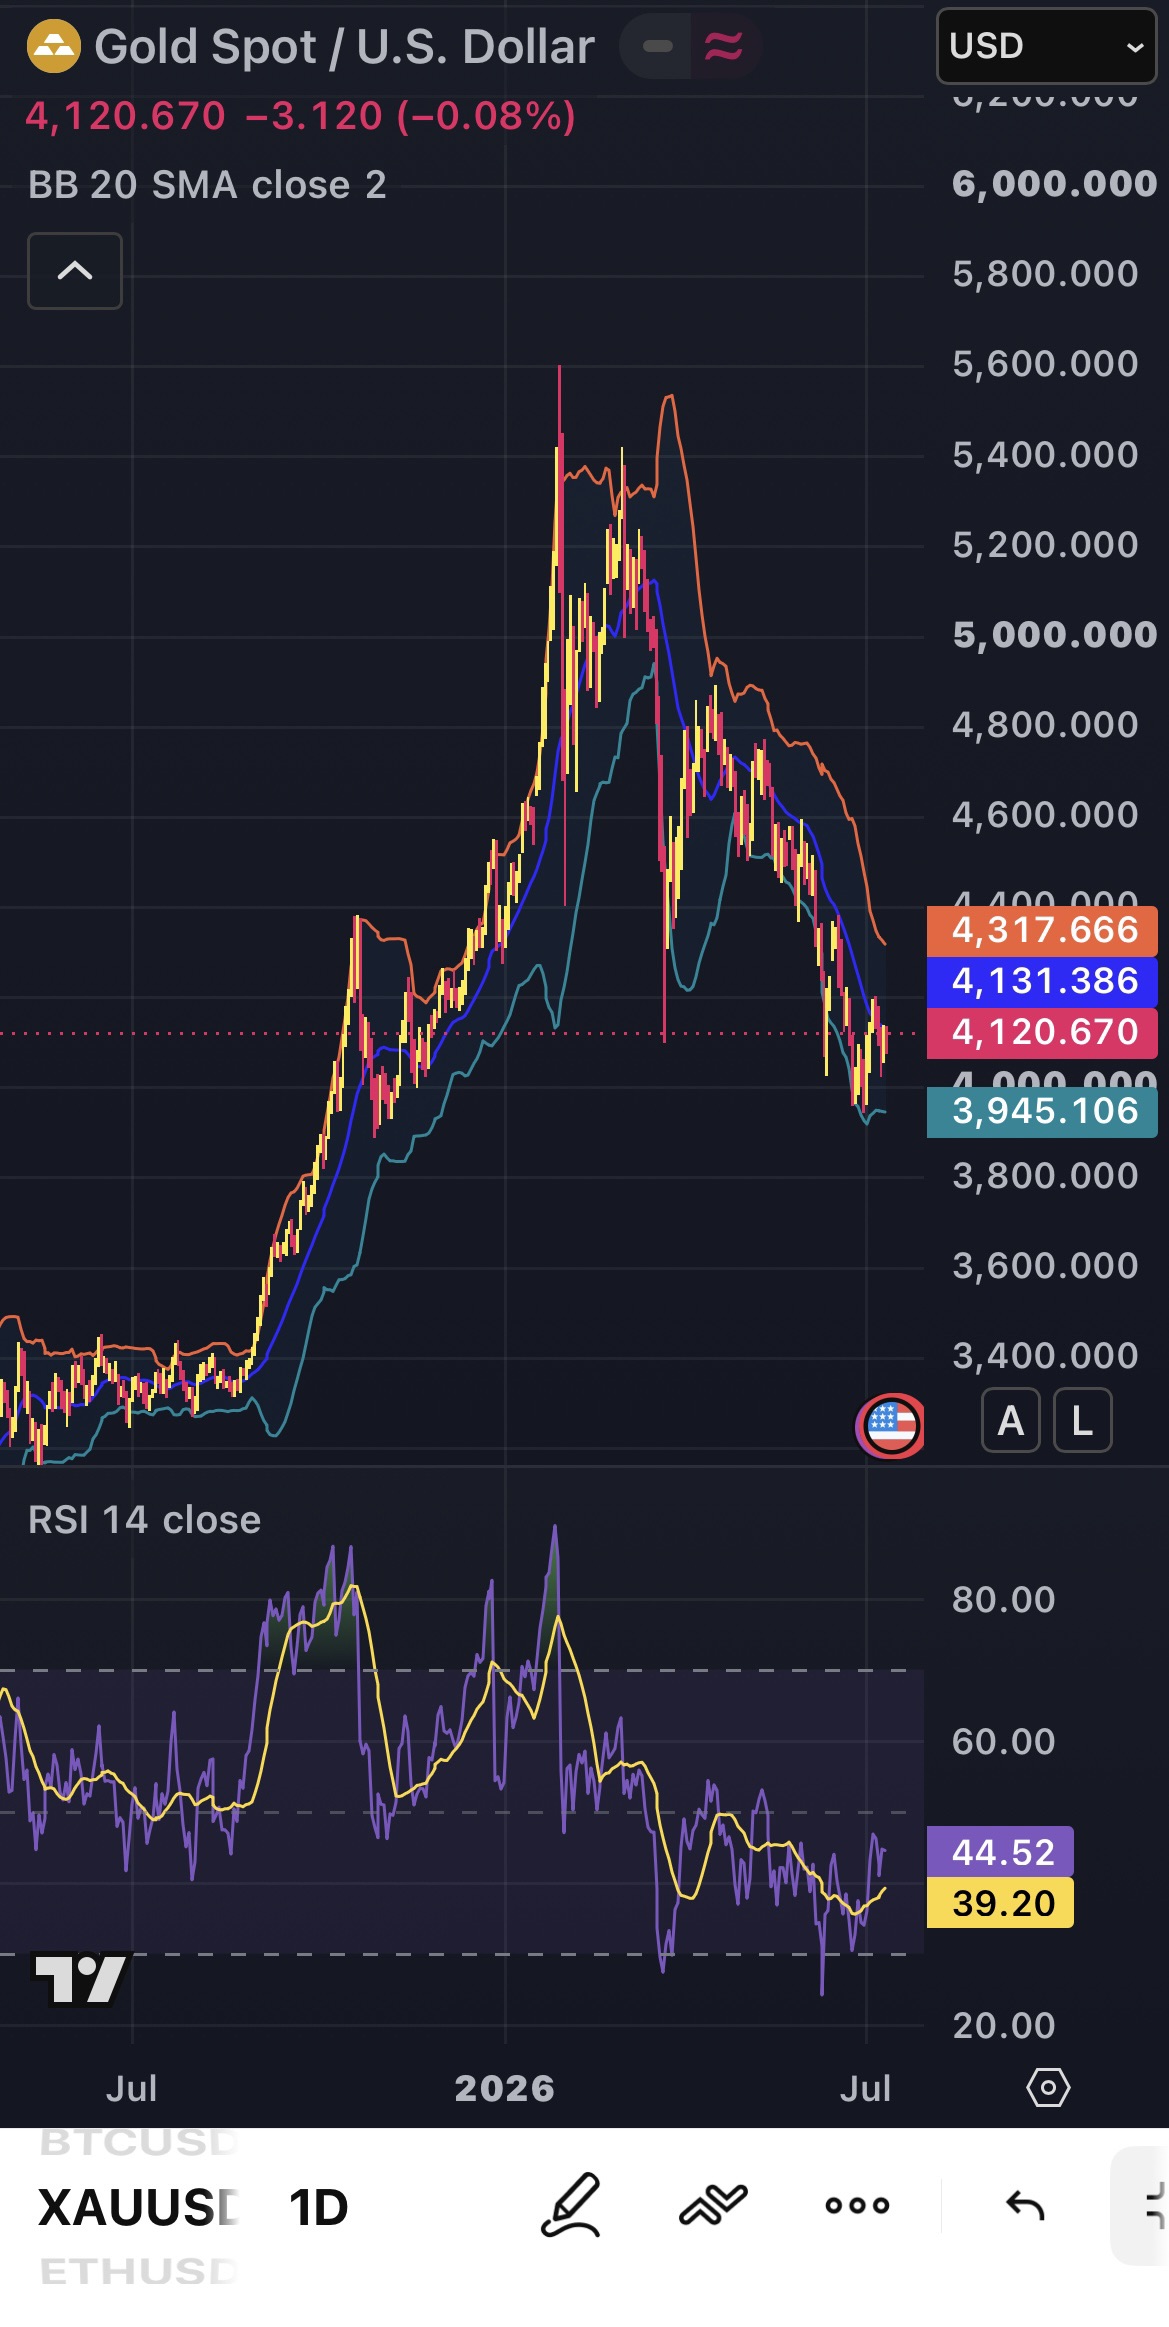
• Gold is in a clear downtrend overall, currently trading around $4,120.67
• Stuck below the 20-day moving average ($4,131.38) – bears still have the upper hand for now
• Critical support sits at $3,945.10 (lower Bollinger Band) which has held strong.
• Daily RSI at 39.20: no longer oversold, but not yet showing strength
🟢 4-Hour Chart
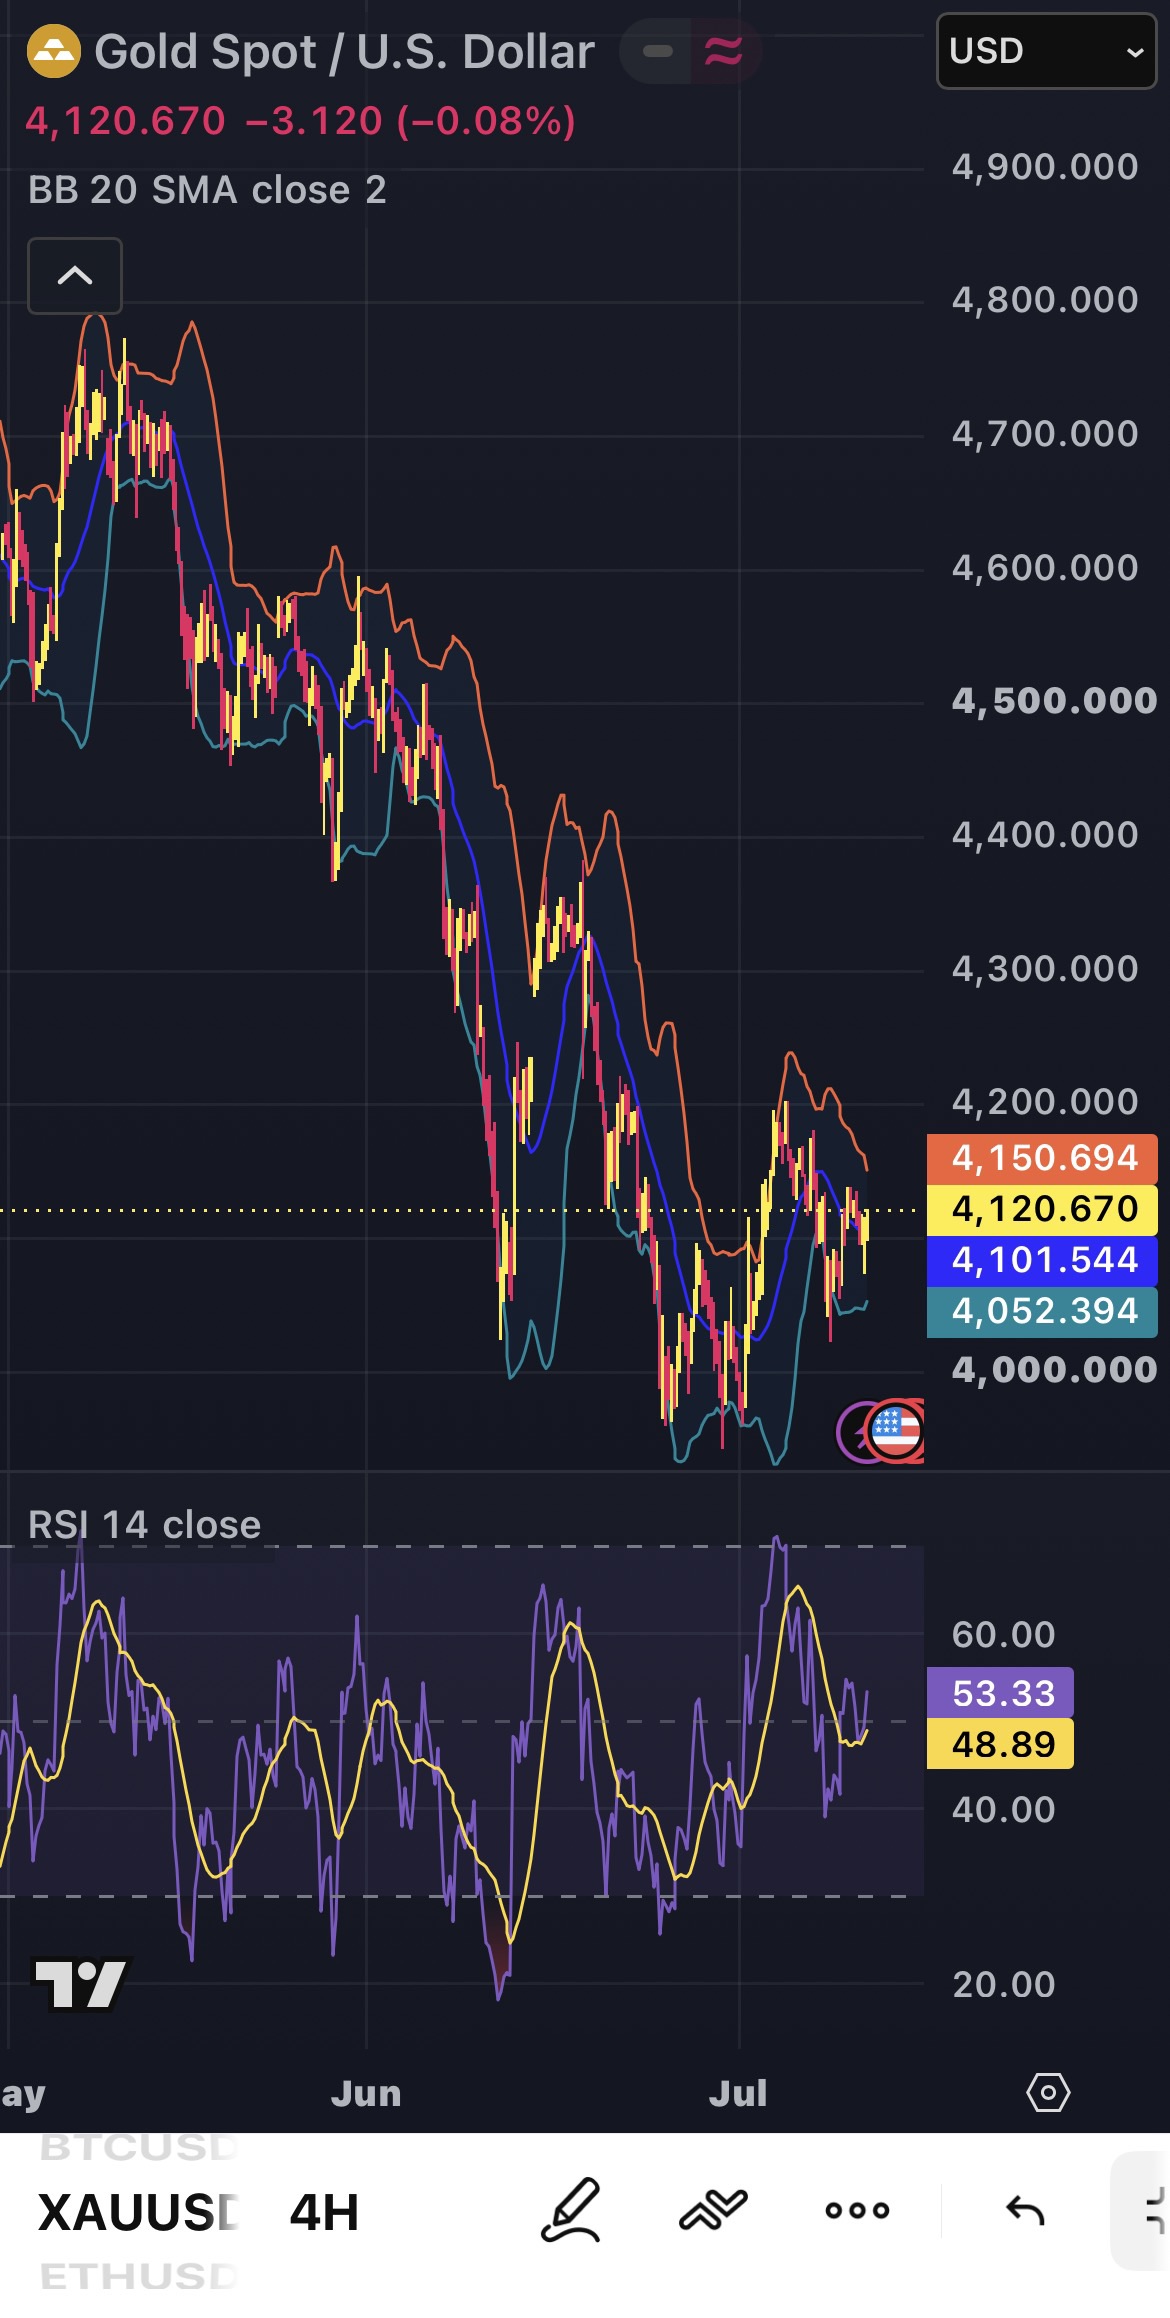
• Short-term price is moving sideways, with no clear push up or down
• $4,101.54 (4-hour mid band) now acts as immediate support
• Next resistance to beat: $4,150.69 (upper Bollinger Band)
• 4-hour RSI = 48.89: neutral momentum ahead of the new trading week
🔷 What’s Moving Gold Right Now
• Hawkish Fed shift: June inflation hit 4.2% – driven by energy costs. The current markets now expect rate hikes, not cuts. Higher rates make non-interest-bearing gold less attractive.
• Fading safe-haven demand: Gold ETFs are seeing outflows and central bank purchases have slowed – removing the extra “fear premium” that boosted prices earlier this year.
🔷 Key Date To Watch Next Week
Thursday, 16 July 2026 – US Retail Sales and Jobless Claims data will be released.
These numbers will decide if the US dollar keeps rallying or if gold gets room to challenge the $4,150 resistance. Keep your positions flexible!
Not financial advice. Do your own DD😁