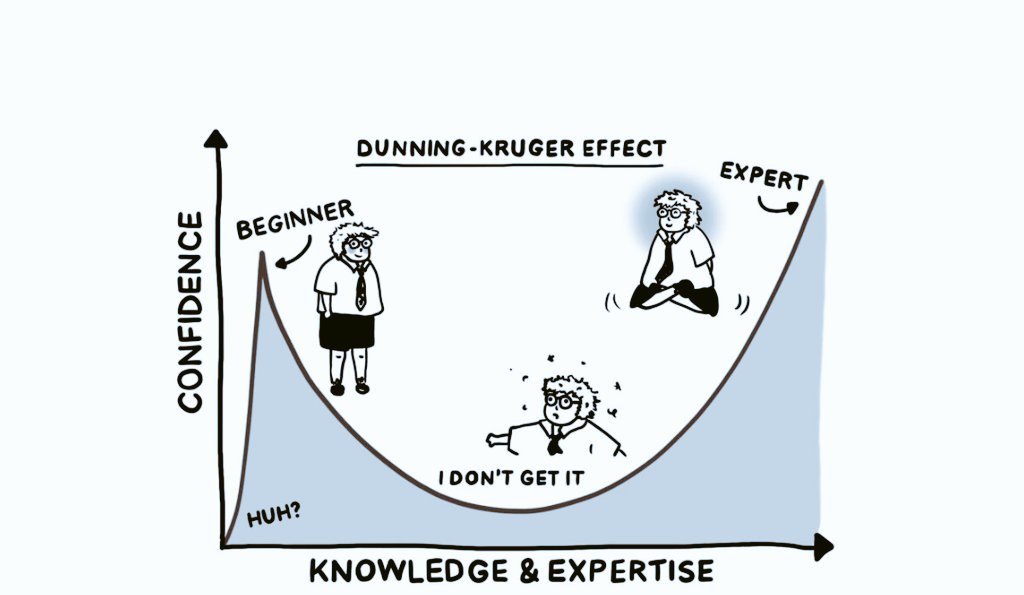
The Dunning–Kruger Effect in Options Trading
After nearly 20 years of trading options, one lesson has become crystal clear:The more you learn, the more you realize how much you still do not control.New traders often enter the market feeling certain. They find one indicator, one strategy, or one winning trade—and suddenly believe they have cracked the code.Then the market introduces them to:Theta decay. IV crush. Bad fills. Overnight gaps. Earnings surprises. Position sizing. Liquidity. And trades that were “right” but still lost money.That is the awareness gap.It is where confidence falls, but real growth begins.Experience does not teach you how to predict every move. It teaches you how to survive when your prediction is wrong.After 20 years, I do not approach a trade believing I know exactly what will happen. I evaluate the probability, define my risk, choose my expiration, size the position, and prepare for multiple outcomes.That is the difference between confidence and competence.Beginners seek certainty. Experienced traders manage probability.For those of you learning, do not be embarrassed when the market humbles you. Every serious trader has been there. Study the loss, protect your capital, ask questions, and keep building your process.The goal is not to become fearless.The goal is to become disciplined enough that being wrong does not remove you from the game.Confidence gets you started. Humility, risk management, and experience keep you trading.NFA. Education and risk management always come first.
Jim
JimSuggestions for you to follow
J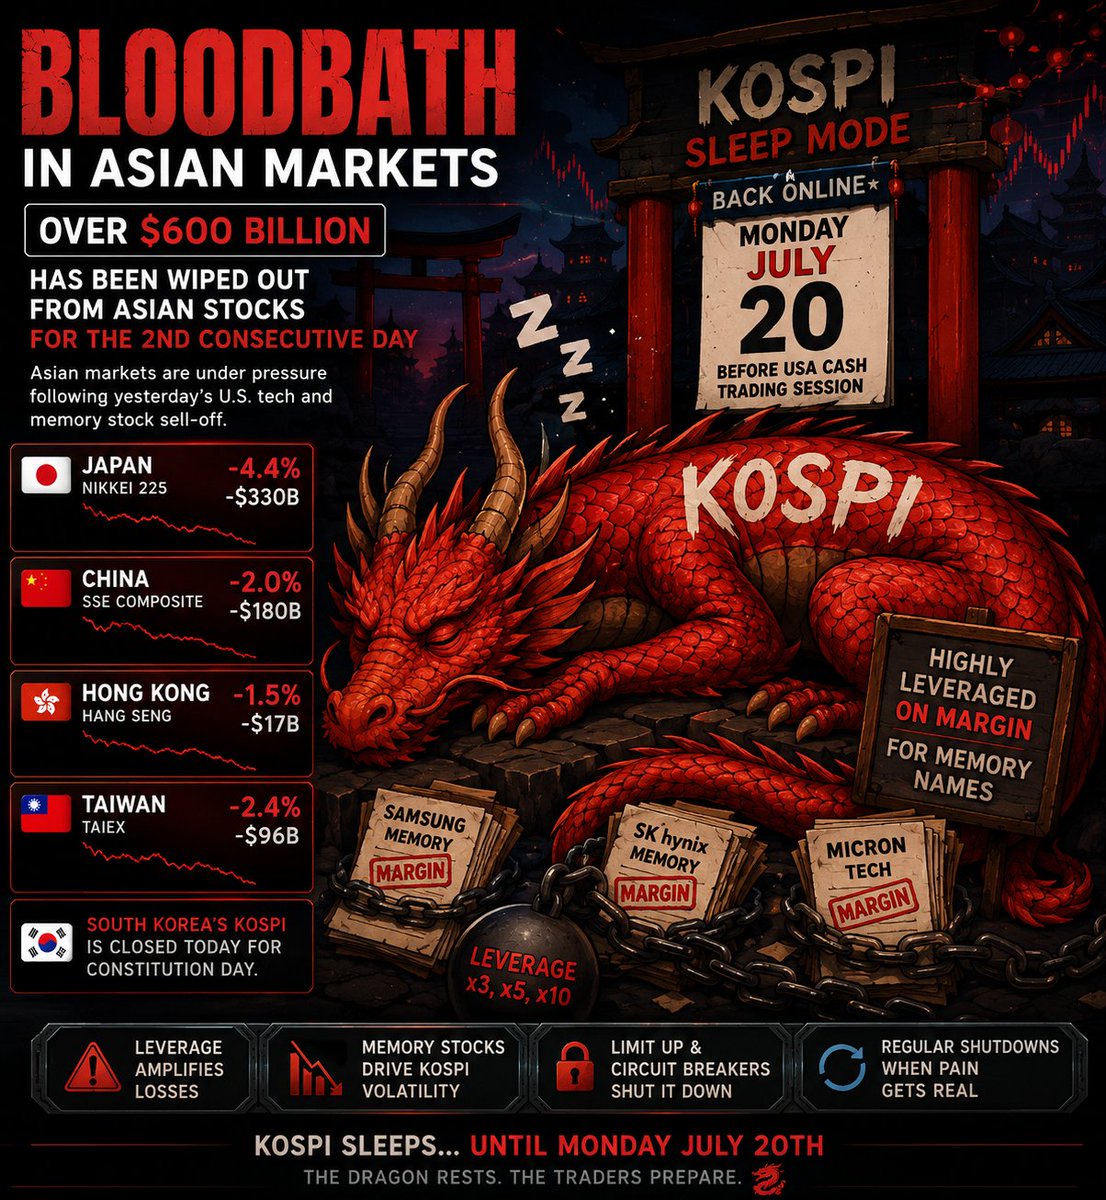
🚨 ASIA IS BLEEDING — AND THE KOSPI DRAGON IS STILL ASLEEP.
More than $600B erased in two days as tech and memory stocks get crushed.South Korea was closed today, but it reopens Monday before the U.S. cash session—with traders heavily leveraged and sitting on margin.⚠️ That could mean forced selling, circuit breakers, and another violent semiconductor move.Respect the risk.Size down.Do not confuse a dip with a bottom.J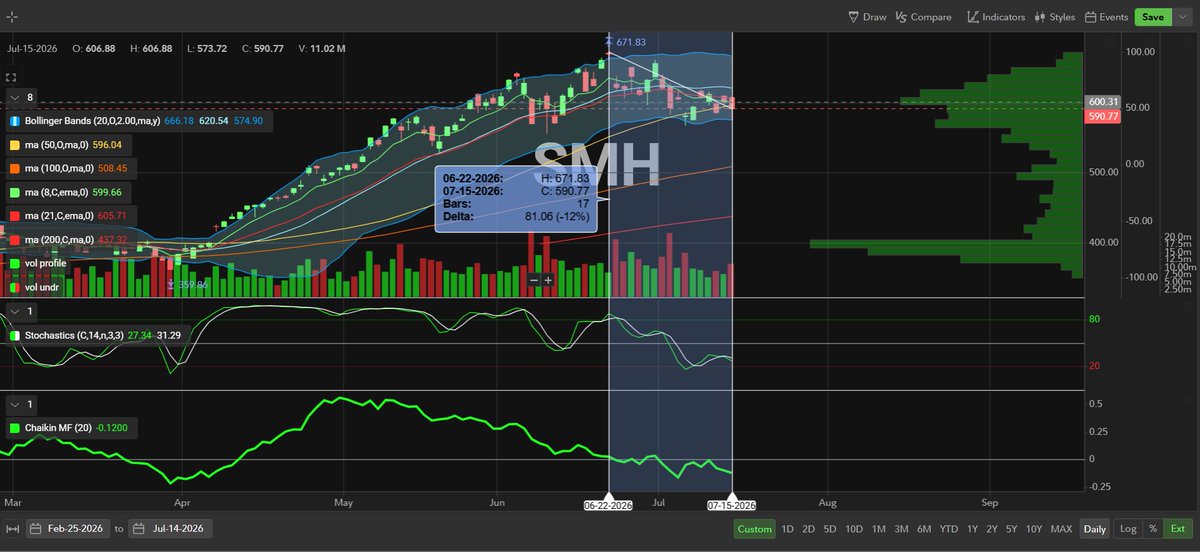
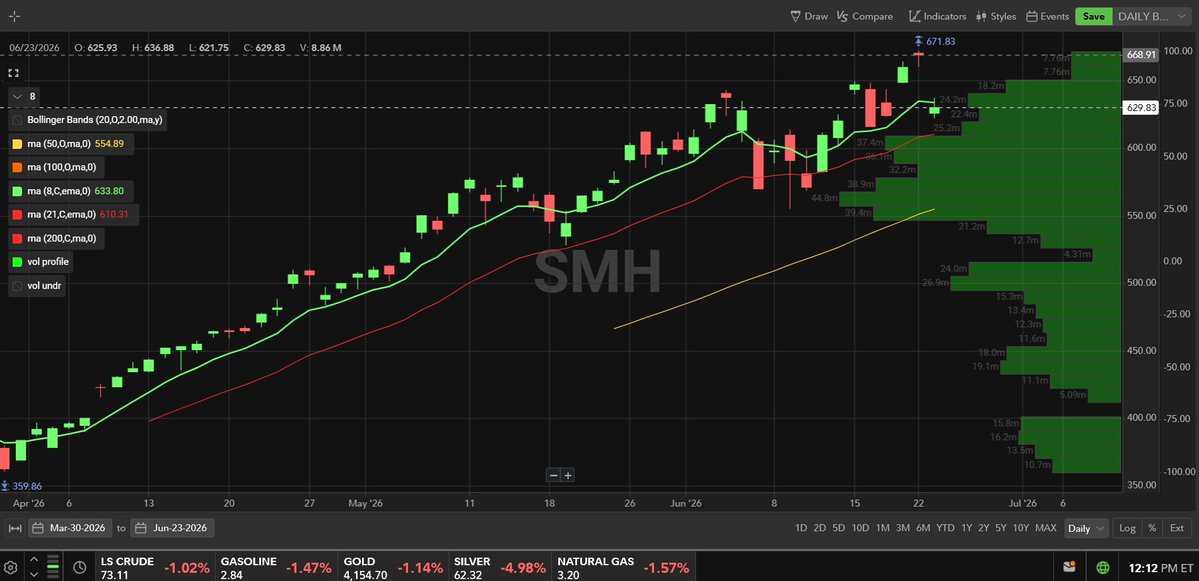
$SMH 17 BARS of Distribution
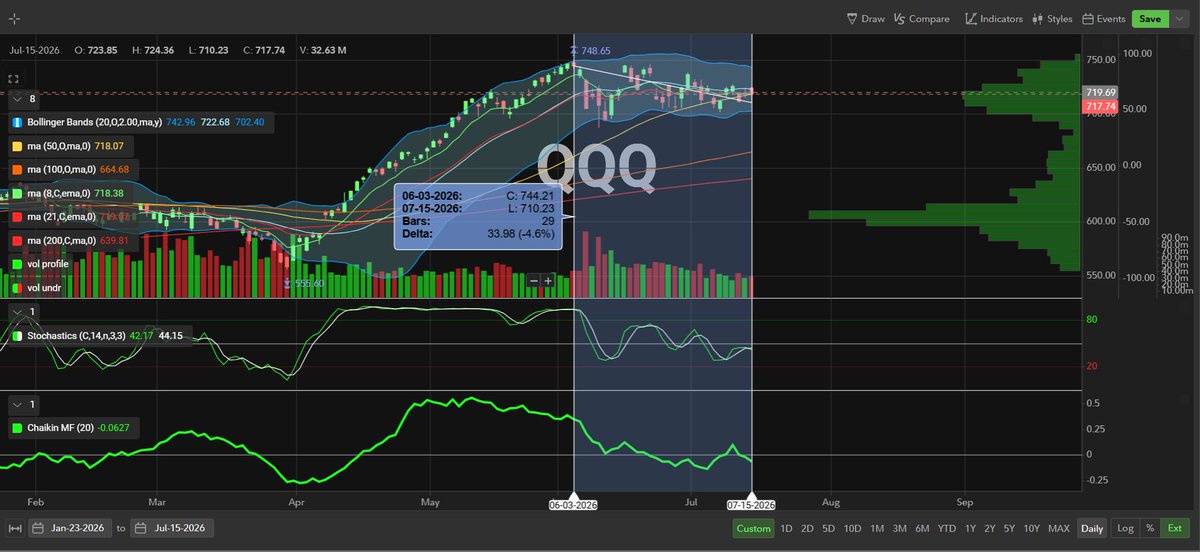
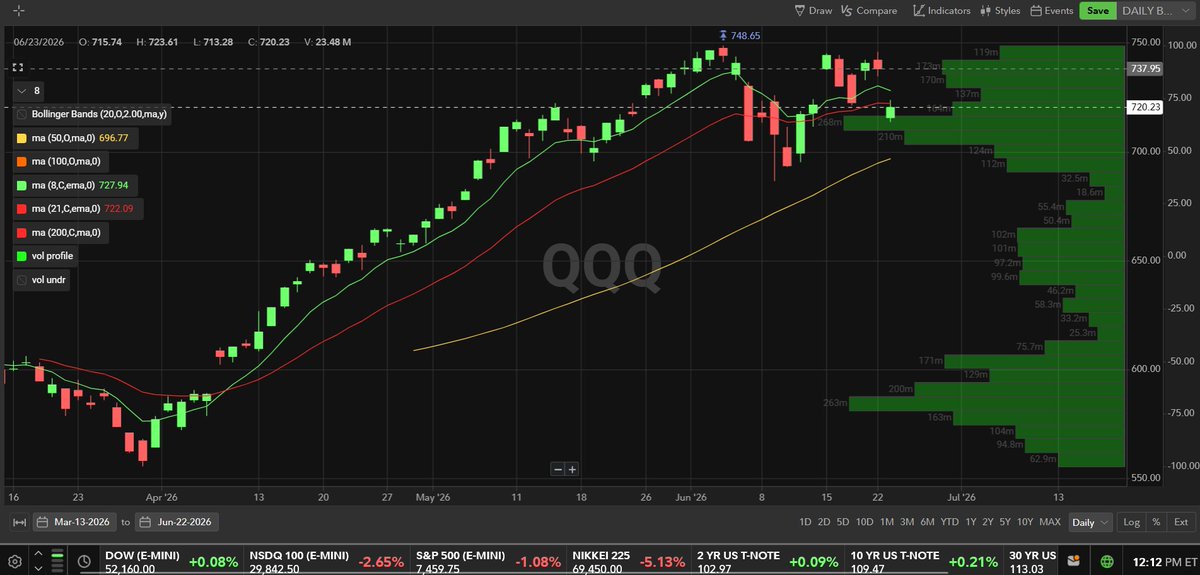
$QQQ 29 BARS of Distribution$SPY 18 BARS of Distribution + 12 Bars of Minor AccumulationGold Mines or Landmines Since June.The Summer of the Flip Flops....J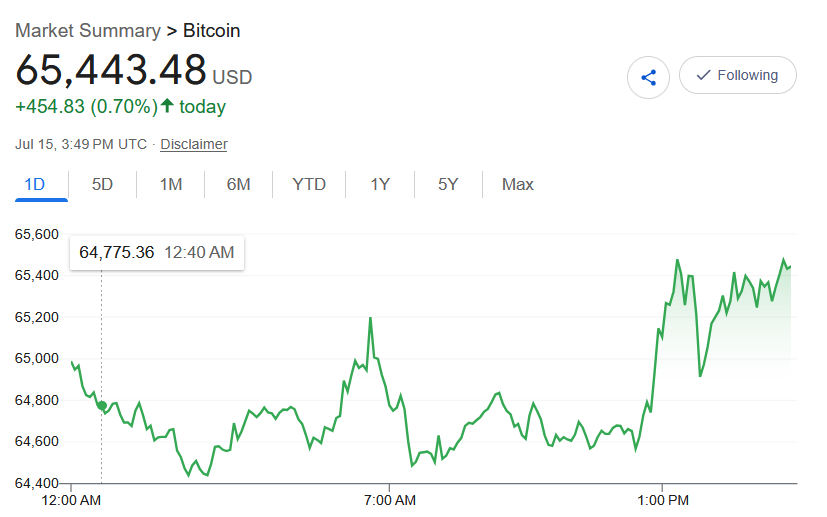
$Grayscale Bitcoin Mini Trust ETF(BTC.US) I don't Trade it - But it is showing some nice price action.

J
Everything you want is on the other side of fear.
In the stock market, that truth gets tested every single day.Buying strength feels good.Buying hype feels easy.Buying what everyone already agrees with feels safe.But buying fear?That’s the hardest thing you’ll ever do in trading.Because fear never shows up politely.It shows up as red candles, bad headlines, panic, doubt, and the sick feeling that maybe this time it really is different.That’s why most people can’t do it.They want the reward, but they can’t stomach the discomfort required to earn it.The market transfers money from the emotional to the disciplined.And discipline often looks like stepping in when everyone else is backing away.Not recklessly.Not blindly.But with a plan, risk management, and the courage to act when opportunity is disguised as pain.Buying fear is uncomfortable.That’s exactly why it can pay.The edge is rarely found where it feels good.It’s found where conviction is tested.If you can learn to stay calm in chaos, think clearly in panic, and execute while others freeze — you put yourself on the right side of the trade.Everything you want is on the other side of fear.In trading, sometimes that means pressing buy when your emotions are begging you not to.NFAJ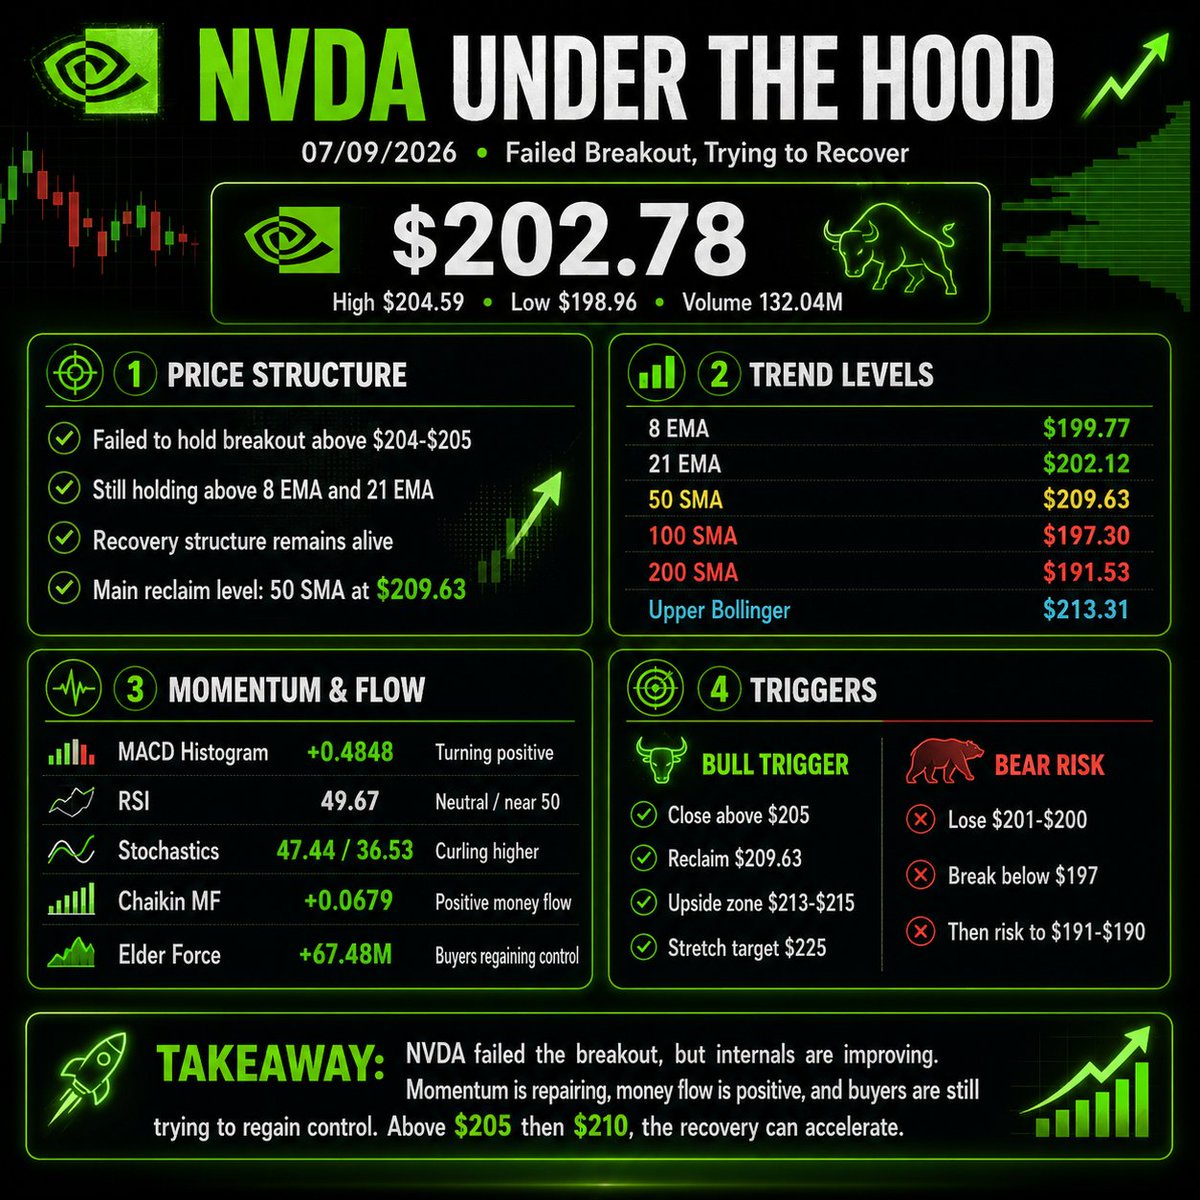
$NVIDIA(NVDA.US) UNDER THE HOOD -
TRIED TO BREAK OUT BUT WALL-STREET SHUT IT DOWN FOR NOW.SEEMS LIKE IT IS IN THE PENALTY BOX TRYING TO RECLAIM $205.I think MOST PEOPLE JUST SELL CALLS AGAINST $NVIDIA(NVDA.US) WHICH IS WHY IT DOES NOT BREAK OUT LIKE $AMD(AMD.US) OR $Broadcom(AVGO.US) $Intel(INTC.US) It can RUN just going to take time.I still like the $210 or $220 SEPT 18th Call should we hold $200.
J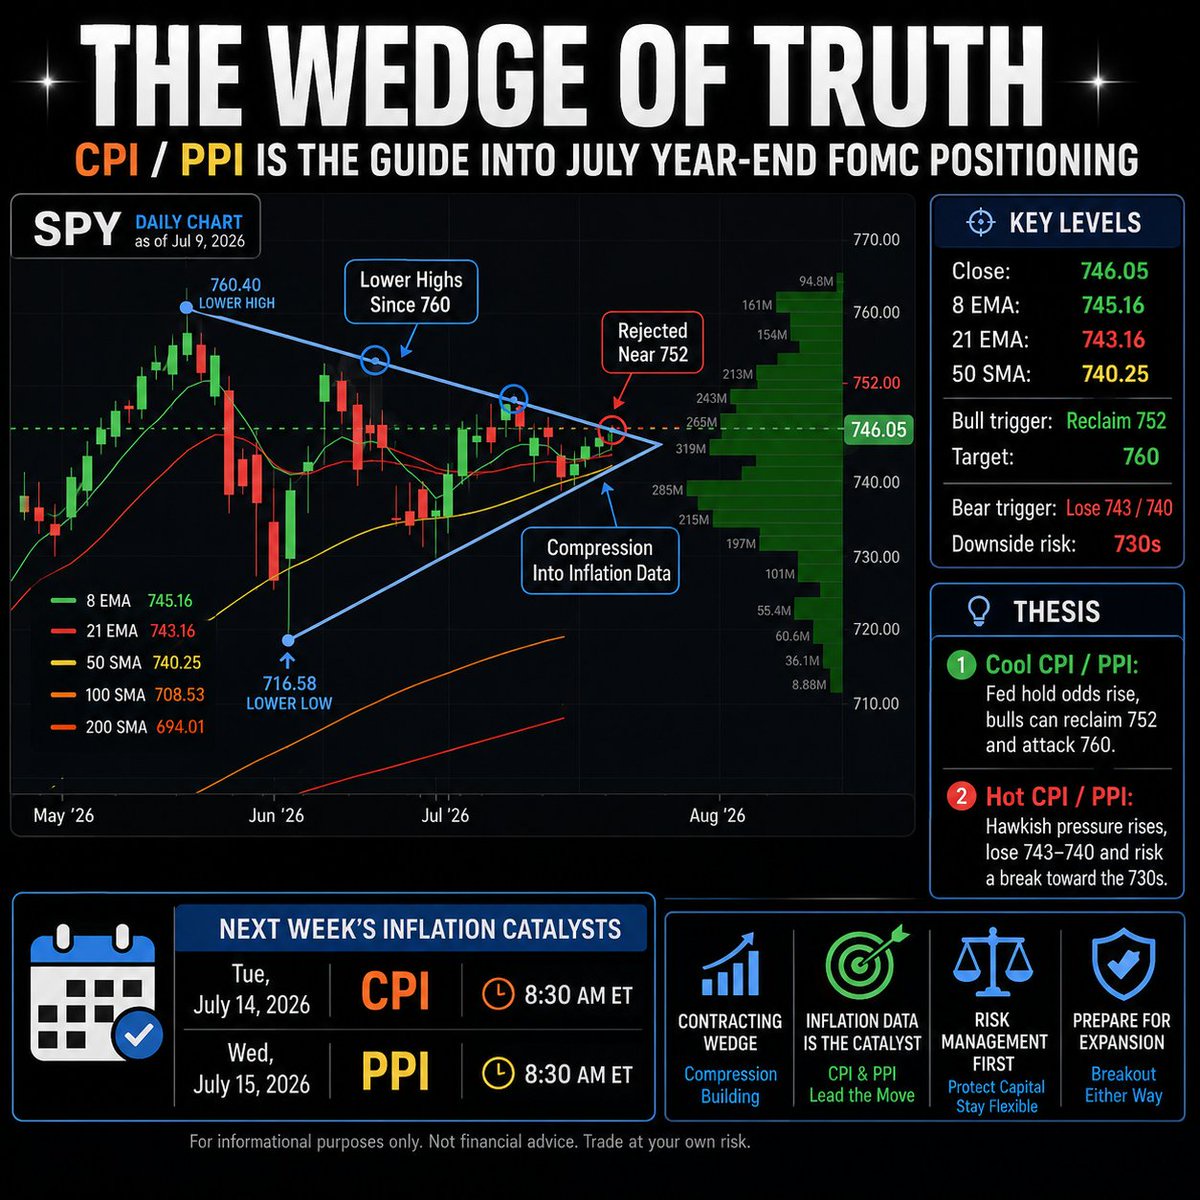
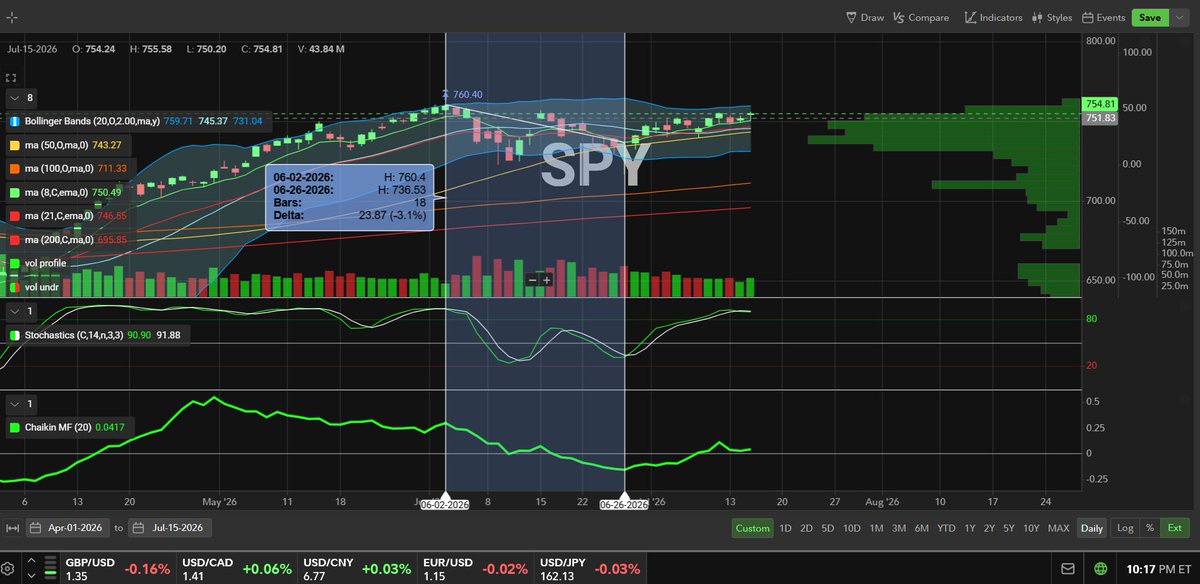
$SPY
The Wedge of Truth + the latest AAII Bulls/Bears sentiment indecision.1/The Wedge of Truth is here.$SPY is compressing into CPI/PPI next week while investor sentiment is almost perfectly split.This is not a clean bull breakout.This is not full bear capitulation.This is a market waiting for inflation data to pick the next direction.2/AAII sentiment for the week ending 7/8/2026:Bullish: 36.3%Neutral: 26.5%Bearish: 37.2%That is about as indecisive as it gets.Bears only lead bulls by 0.9 percentage points.Nobody has control yet.3/What stands out to me:Historical averages show:Bullish average: 37.5%Neutral average: 31.5%Bearish average: 31.0%Current sentiment is not euphoric.Bulls are slightly below average.Bears are still above average.That means the wall of worry is alive.4/This matters because $SPY is sitting inside a technical compression zone.We’ve had lower highs since $760.40.Recently, $SPY rejected near $752.Now price is hovering around:Close: $746.058 EMA: $745.1621 EMA: $743.1650 SMA: $740.25That is tight.Very tight.5/The wedge is saying the same thing the sentiment survey is saying:The market is not committed.Bulls are not chasing aggressively.Bears are not pressing enough to break it down.Everyone is waiting for the same thing....Inflation data!!6/Next week’s key catalysts:Tuesday, July 14: CPIWednesday, July 15: PPIBoth at 8:30 AM ET.These prints likely shape July positioning and the market’s view of year-end FOMC risk.Cool data = bulls get oxygen.Hot data = bears get ammo.7/Bull case:$SPY holds 743–745, reclaims 752, then attacks 760.That would tell me the wedge is resolving higher and the market is willing to look through inflation risk.A reclaim of $752 is the first real confirmation.Until then, it’s still compression.8/Bear case:$SPY loses 743, then especially the 50 SMA near 740.That would put the wedge at risk of breaking lower.If CPI/PPI come in hot, the market may start pricing in more hawkish Fed pressure into year-end.That opens the door toward the 730s.9/The key takeaway:AAII sentiment is split.$SPY is compressed.Inflation data is the catalyst.This is why I’m calling this setup:The Wedge of Truth.The next move likely comes from CPI/PPI, not opinions.Trade the reaction.Protect capital first.Prepare for expansion either way.Not financial advice.J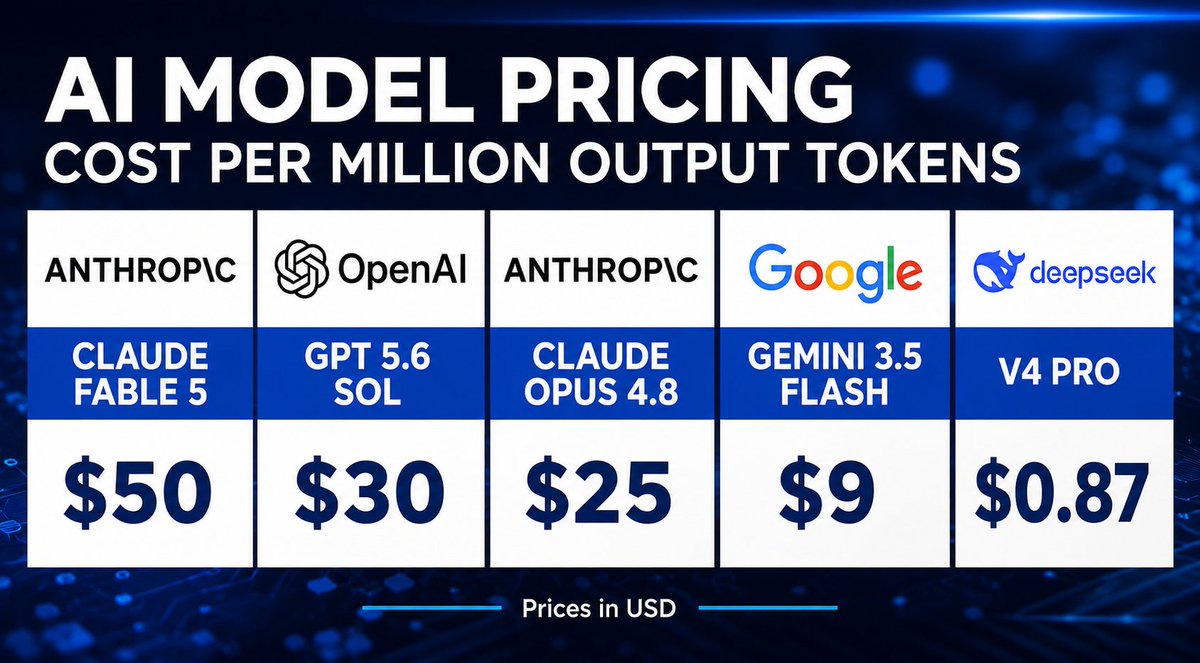
$Alphabet(GOOGL.US) is not just an AI model trade.
It is a cash-flow machine with Search, YouTube, Cloud, Android, Workspace, Gemini, TPUs, and Waymo all stacked together.The bull case is simple:Google can make AI cheap, useful, deeply embedded, and massively distributed.That is why $Alphabet(GOOGL.US) may be one of the cleanest mega-cap AI value trades on the board.Main risks to watch: antitrust remedies, heavy AI capex, and margin pressure if AI infrastructure costs rise faster than monetization. $Alphabet(GOOGL.US) $Alphabet - C(GOOG.US)Gemini 3.5 Flash at $9 per million output tokens is the standout value layer here.That is roughly:70% cheaper than OpenAI64% cheaper than Claude Opus82% cheaper than Claude FableDeepSeek wins raw low-cost pricing.But Google brings the full machine:@WarrenPies
J
Fun Game - List ALL The Bearish Arguements you can come up with for reasons the market will collapse or crash.
Anything goes... I really want to see what we come up with.J


Running the Spartan Beast 10 mile gauntlet awhile back.
I ran solo, which was fine until I got to the first 15 ft wall to climb. Then, I had to make friends in order to survive that task. Point being it's OK to roll solo, lone wolf 🐺 But it's also a good idea to take on difficult tasks with other skilled practitioners. 🤝Another point of running the Spartan Beast was to push myself past the 40% daily limit. This race took me 3 hours, and it was tough. I preloaded days before with energy and fuel. Trading is literally NO different.You will need to get dirty, in the mud to survive, and if you play smart, you can survive to Thrive!1. Embrace hard challenges. 2. Run with a pack of like-minded, skillful traders whenever possible.3. Don't be afraid of hard tasks. That's usually where your Edge is Born. If it's raining, go for a jog. You'll come back with a mindset built for trading. Iron Sharpens Iron 🤝⚔️J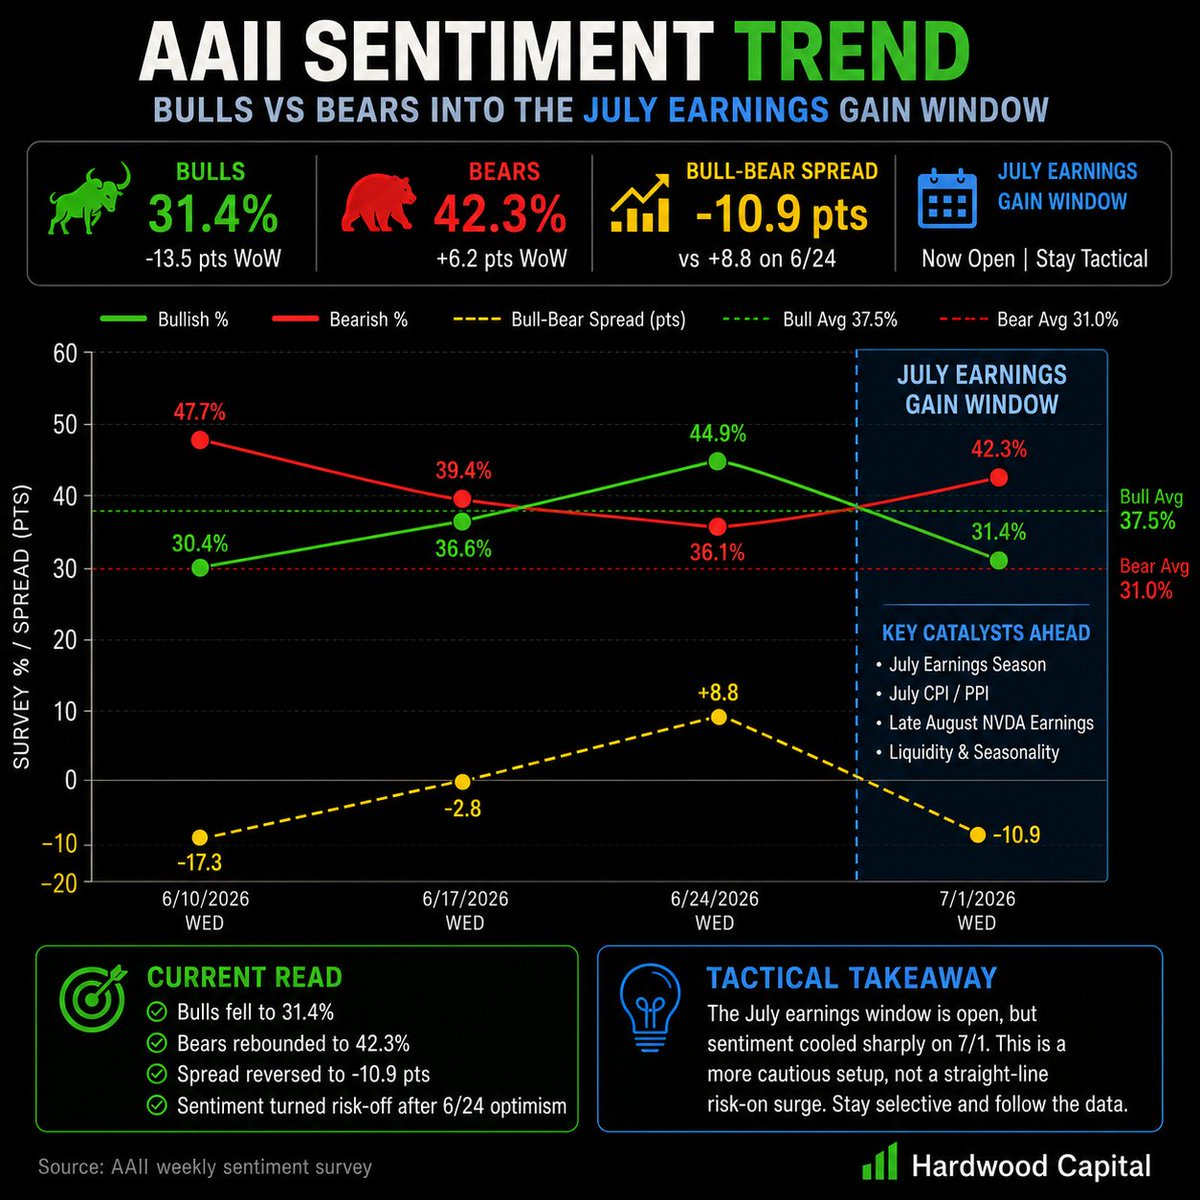
AAII sentiment update — this is why we follow the data, not emotions.
$SPY $QQQ $SPX $SMH Last week, AAII looked like risk appetite was improving fast: End of Quarter Mechanics....6/24:Bulls 44.9%Bears 36.1%Bull-Bear Spread +8.8 ptsThat was a strong rebound from the 6/10 fear spike when bears were 47.7% and the spread was -17.3 pts.But the newest 7/1 print changed the tone:Bulls fell to 31.4%Bears jumped to 42.3%Neutral rose to 26.4%Bull-Bear Spread flipped back to -10.9 ptsThat is a 19.7 point reversal in the spread in one week.My read:The July earnings gain window is still open, but this is no longer a clean “straight risk-on” sentiment setup.Bulls are now back below their historical average of 37.5%, while bears are back above their historical average of 31.0%.That means the market has room to rally if earnings, CPI/PPI, oil, and liquidity cooperate — but positioning is still cautious and fragile.This is actually useful.It tells me not to chase blindly.The best setup is still selective:Strong names.Clean support holds.Improving money flow.Catalysts ahead.Defined risk.July can still work, but we need confirmation from price, breadth, earnings, and inflation data.Sentiment cooled hard.Now we let the market prove whether this is fear to buy — or a warning to respect.Stay tactical.Follow the data.Don’t marry the bias.$SPY $QQQ $NVIDIA(NVDA.US) $Apple(AAPL.US) $Microsoft(MSFT.US)J
After Hours Dark pool Prints Bouncing the Tape.
Whipsaw....Darth Maul vs OB1Start Wars....J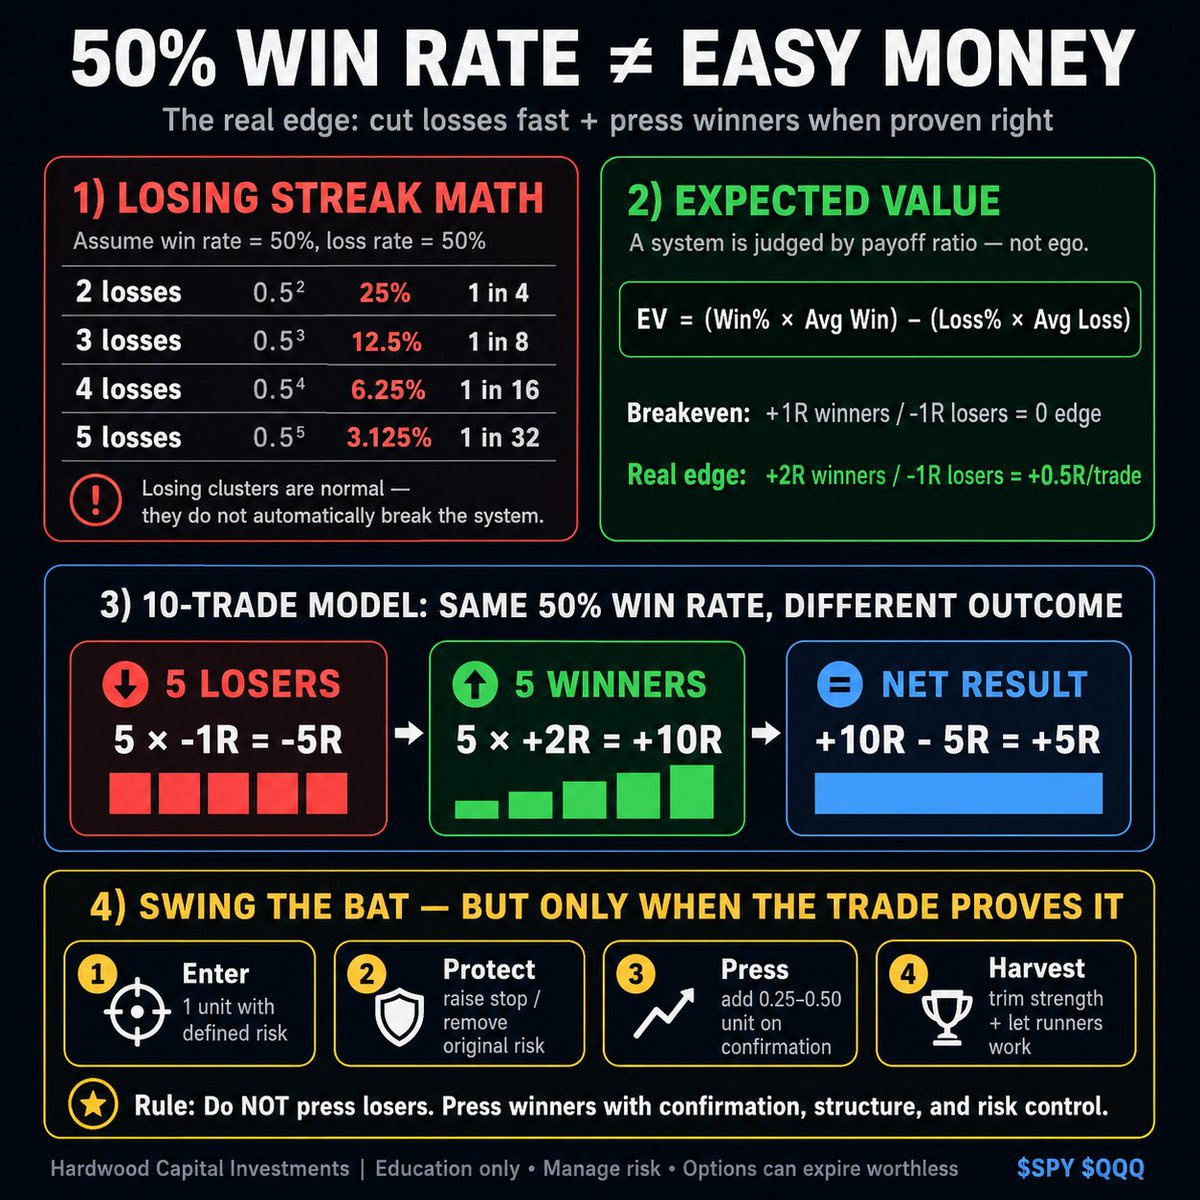
Eyes up Fam - $SPY $QQQ $SMH
50% Win Rate Does NOT Mean Easy MoneyOne of the biggest mistakes newer traders make is thinking a good system should feel good all the time.It will not!!!!!!!!!!!!!!!!!!!!!!!!Even with a 50% win-rate system, losing streaks are mathematically normal.At a 50% win rate:2 losses in a row = 25% chance3 losses in a row = 12.5% chance4 losses in a row = 6.25% chance5 losses in a row = 3.125% chance, or 1 in 32That does not mean the system is broken.It means you are experiencing the normal distribution of outcomes.The real test is not whether you can trade well after a win.The real test is:Can you still execute perfectly after 3, 4, or 5 losses without revenge trading, over-sizing, or abandoning the plan?That is where most traders lose.This is why I focus so much on risk management.A 50% win rate by itself is not enough.The edge comes from asymmetry.Example:5 losing trades at -1R each = -5R5 winning trades at +2R each = +10RNet result:+5RSame 50% win rate.Completely different outcome.That is the goal.Not to win every trade.The goal is to keep the losses controlled, then let the winners pay for the losers and create the profit.That is what I mean by "Swinging the bat".We do not press losers.We do not add because we are emotional.We do not try to make it all back on one revenge trade.We press when the trade is already working!We scale in with Conviction on Working Trades and Trend Confirmation.The structure is simple:1. Enter with defined risk.2. Protect the trade once it starts working.3. Press only when price confirms.4. Harvest by trimming strength and letting runners work.The market does not reward emotional size.It rewards disciplined execution.A losing streak does not kill a trader who sizes correctly.But pressing losers, refusing stops, and revenge trading absolutely can.The edge is:Cut losers fast. Protect capital. Press winners when proven right. Let the math work over a larger sample.That is how we survive the bad clusters and compound when the good setups finally take off.@BeardoTrader @blondebroker1 @RealtorStarShar @StockPatternPro @Banana3Stocks @Micro2Macr0 @Mr_Derivatives @market_sleuth @Norseman1J
Everyone Knows -
You Pump it on 4th of July Weekend and on 9/11.Thems is the Rules....... The Code of Honor.But Look at it like this.$SMH is Getting SMACKED HARD and $SPY is Down $2.70 Dollars on the Day.It was $745 Yesterday.J
This is Who You are TRADING Against.
These Cats with 5x Leverage 5x Margin in South Korea and Macau.They only KNOW the Juice and the Circuit Breaker Side Car.Wall street USA has made it clear, for NOW they want off that Roller Coaster and are Happy to Side Step it in Early Q3 2026.Proper Risk Management.Never say Die, could POP 10% Tomorrow but Pro Money Managers BANGED that Trade in Q2.Now they are Trimming and Letting these Lambo Chasing Cats Run Solo a week, maybe 2.The Samurai Sword Cuts Both Directions.J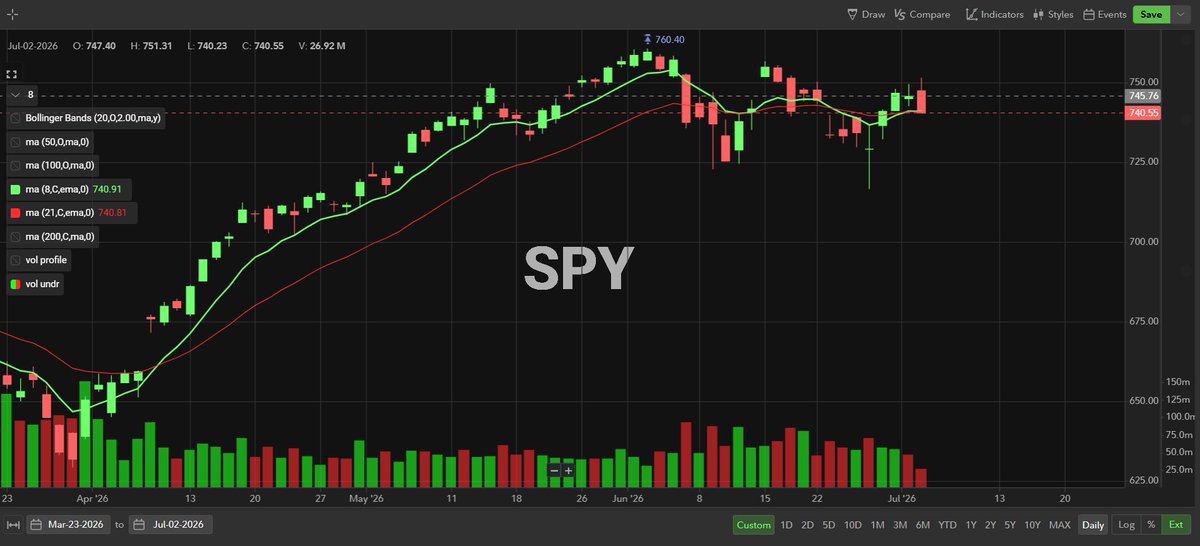
$SPY Hard to Say But.....
$760 Blow Off Top.....Distribution.....Break of Structure Below 21 EMAThen Island TOP Reversal.....Break of Structure Below 21 EMAPump into LOWER High.....Back below 21 EMANot Sexy Overall....The Rotation or Chip Sell Off in Q3 is Nasty and Asia Pumping on Margin/Leverage is Creating a Vegas Roulette Wheel Dynamic for now.We need stability and Calm Next Week.Expect Asia Throws Up Tomorrow while we are on Wall Street Holiday.NFAJ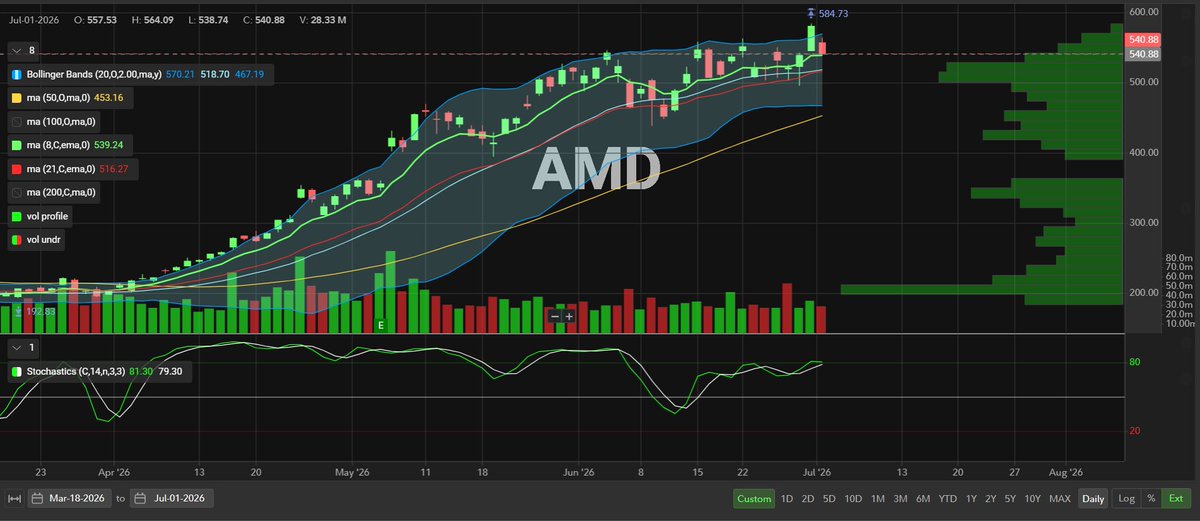
$AMD(AMD.US) Looks Pretty Strong here.
Could be worth 1 UNIT on WEAKNESS.Target 1 Unit Scale in 0.25 at a time until 1 unit achieved.Target August 21st Expiration since August 3rd are Earnings.Try and get in on Chip Weakness I think near the 21 EMA should Chips dip a few days early July.Target would be $550 and $600 Calls.Good Clusters there on August 21st.J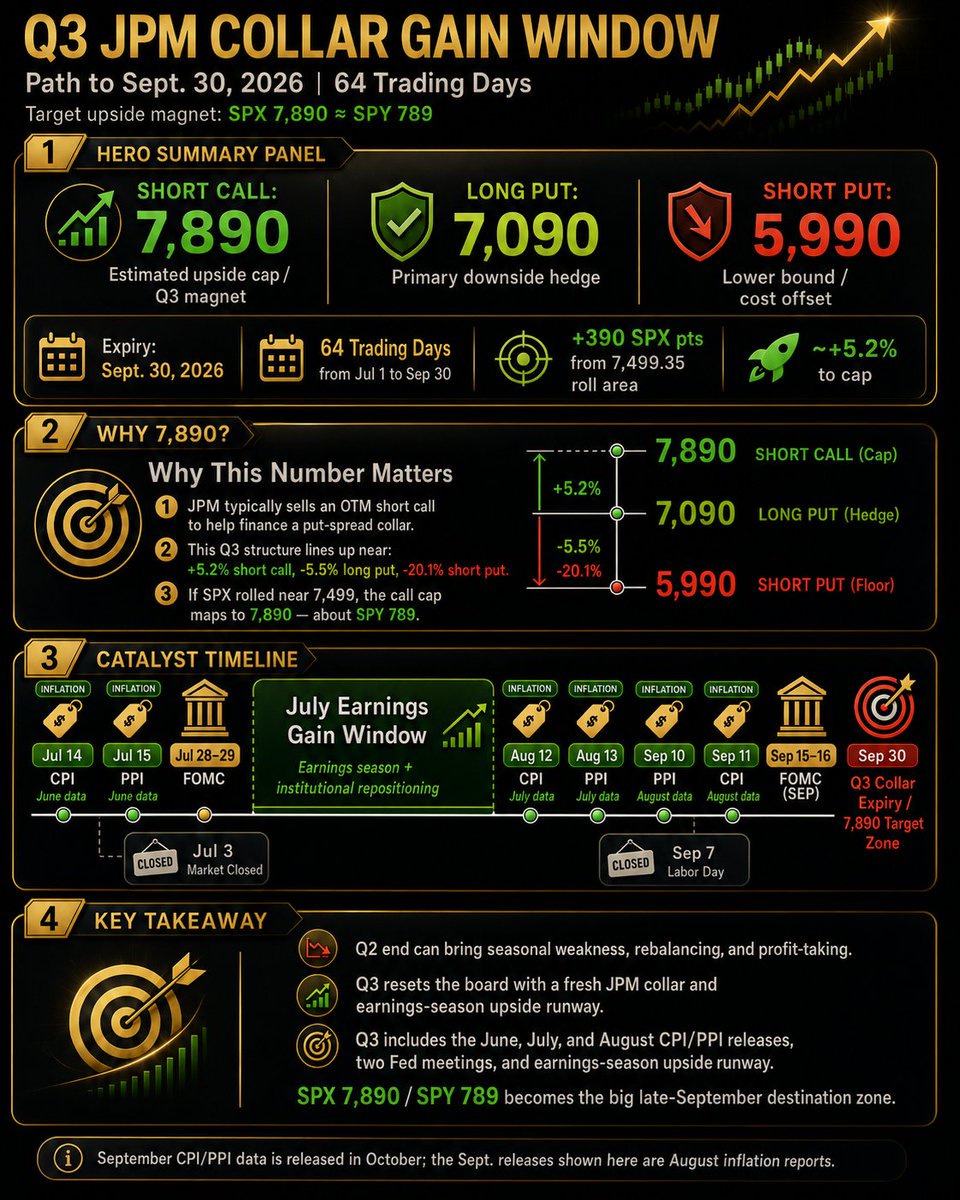
$SPX $SPY
2026 JPM Q3 Collar:Q2 2026 may end with a squeeze… But Q3 has a fresh upside map.As we close out the quarter, don’t be surprised if the market sees some rebalancing or profit-taking. That’s normal quarter-end mechanics.But the bigger setup is what comes next.The new Q3 JPM collar appears to reset with:Short Call: 7,890 SPXLong Put: 7,090 SPXShort Put: 5,990 SPXExpiry: Sept. 30, 2026That makes $SPX 7,890, or roughly $SPY 789, the new upside reference point into the end of Q3.Why does 7,890 matter?Because JPM’s collar typically sells an upside call to help finance downside protection. With $SPX rolling near the $7,499 area, a call cap near $7,890 lines up with about +5.2% upside from the roll zone.From July 1 to Sept. 30, the market has roughly 64 trading days to work toward that level.That window includes:Inflation checks:Jul 14 CPIJul 15 PPIAug 12 CPIAug 13 PPISep 10 PPISep 11 CPIFed meetings:Jul 28–29 FOMCSep 15–16 FOMCPlus, the full July/August earnings gain window.So, the roadmap is potentially in place. Q2 end: rebalancing, squeeze Q3 start: fresh collar reset, fresh earnings runway, fresh upside target.Destination zone: $SPX $7,890 / $SPY $789 into late September.Not a guarantee.Not a straight line.But this gives us one of the cleanest institutional levels to track for Q3.$SPX $7,890 $SPY $789 is now on the board.👇👇👇J
End of Quarter Pump 🔥🔥
This is what we do!We manage risk, we enter as signals speak to us and we execute. 20+ years in Options Trading. I'm excited for Q3 2026!UP / DOWN / SIDEWAYS We can trade it.J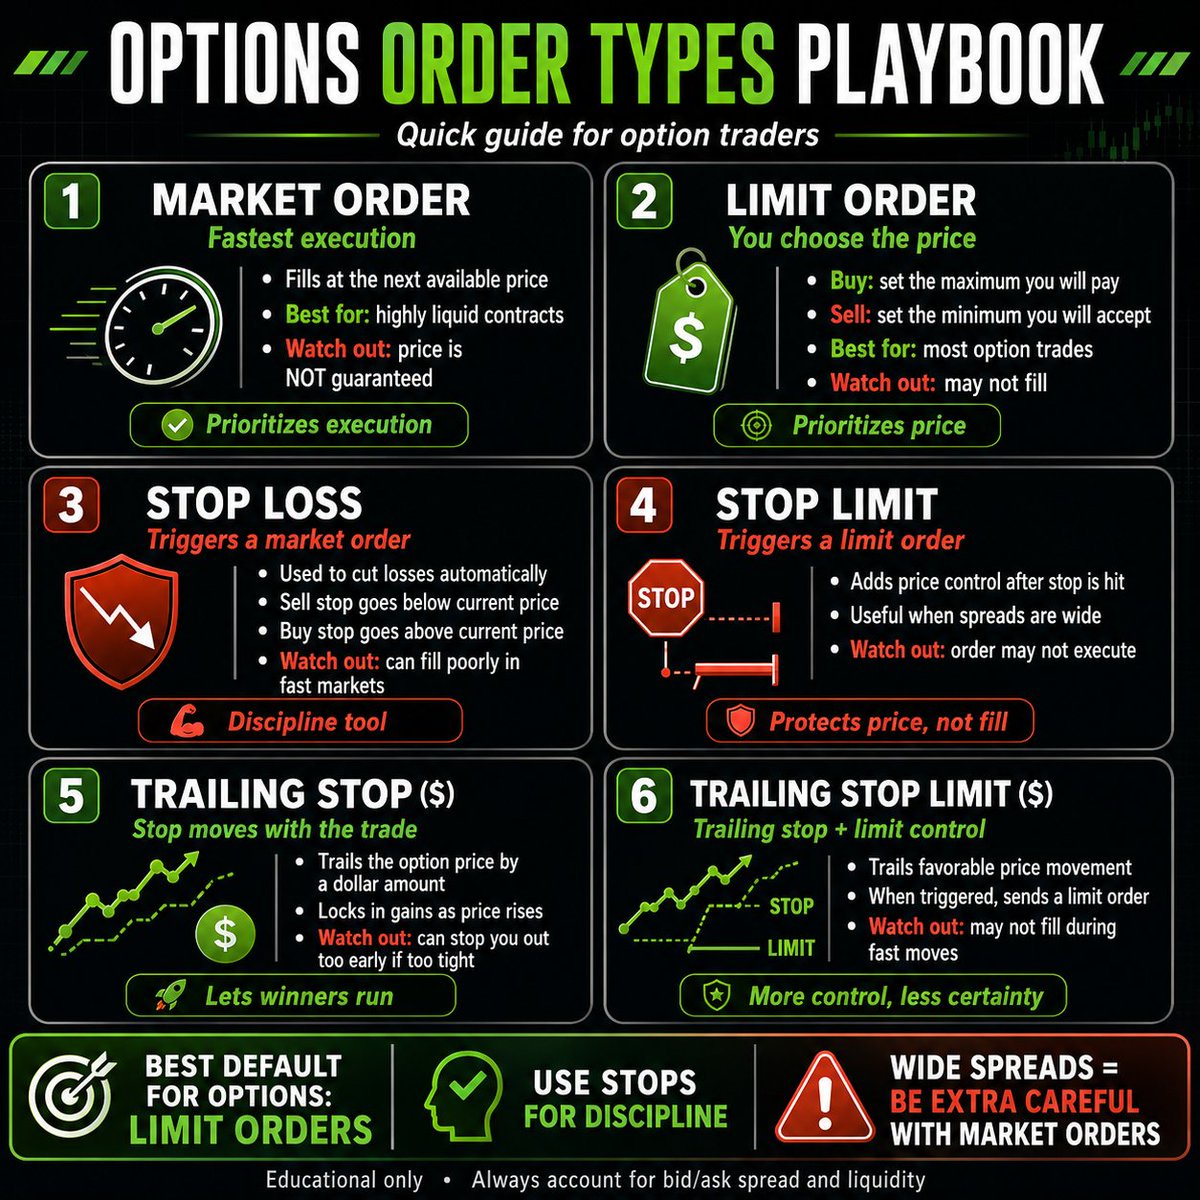
Options Order Types — Simple Trader Breakdown
Market OrderFastest execution.You get filled at the next available price.Best for: Highly liquid contracts with tight spreads. Risk: you may get a bad fill, especially on wide bid/ask spreads.Rule: Market orders prioritize execution, not price.Limit OrderYou choose the price you are willing to pay or accept.For buying: max price you will pay.For selling: minimum price you will accept.Best for: options, especially when spreads are wide.Risk: your order may not fill.Rule: Limit orders prioritize price, not execution.Stop LossA stop loss triggers a market order once the stop price is hit.For selling options, the stop must be below the current price.For buying options, the stop must be above the current price.Best for: forcing discipline and cutting losers.Risk: once triggered, the fill can be ugly if the option is moving fast or the spread is wide.Rule: Stop loss protects behavior, but not exact price.Stop LimitA stop limit triggers a limit order once the stop price is hit.Best for: traders who want downside protection but refuse to accept a terrible fill.Risk: you may not get filled if price moves through your limit too fast.Rule: Stop limit protects price, but not execution.Trailing Stop — Dollar AmountThe stop follows the option price higher as the trade moves in your favor.Example:You set a $1.00 trailing stop.If the option rises from $5.00 to $7.00, the stop trails higher behind it.Best for: letting winners run while protecting gains.Risk: options are volatile, so a tight trail can stop you out too early.Rule: Trailing stops help lock gains without manually moving stops.Trailing Stop Limit — Dollar AmountThis works like a trailing stop, but when triggered, it sends a limit order instead of a market order.Best for: protecting gains while avoiding bad market fills.Risk: you may not exit if price gaps below your limit.Rule: More price control, less certainty of execution.My Practical Options Trading ReadFor options, especially calls/puts with wider spreads:Best default: Limit orders.Best for exits: Limit sells or staged limit sells.Be careful with: Market orders and stop losses on illiquid options.Useful for runners: Trailing stops after the trade is already green.For something like a 30–90 DTE $SPY call, I’d usually think:Entry: limit orderRisk control: mental stop or stop-limit depending on liquidityProfit-taking: scale out with limit sellsRunner: trailing stop only after gains are protectedThe big takeaway:Market orders get you in or out fast. Limit orders keep you from getting robbed by the spread. Stops enforce discipline. Stop limits protect price but may not fill.J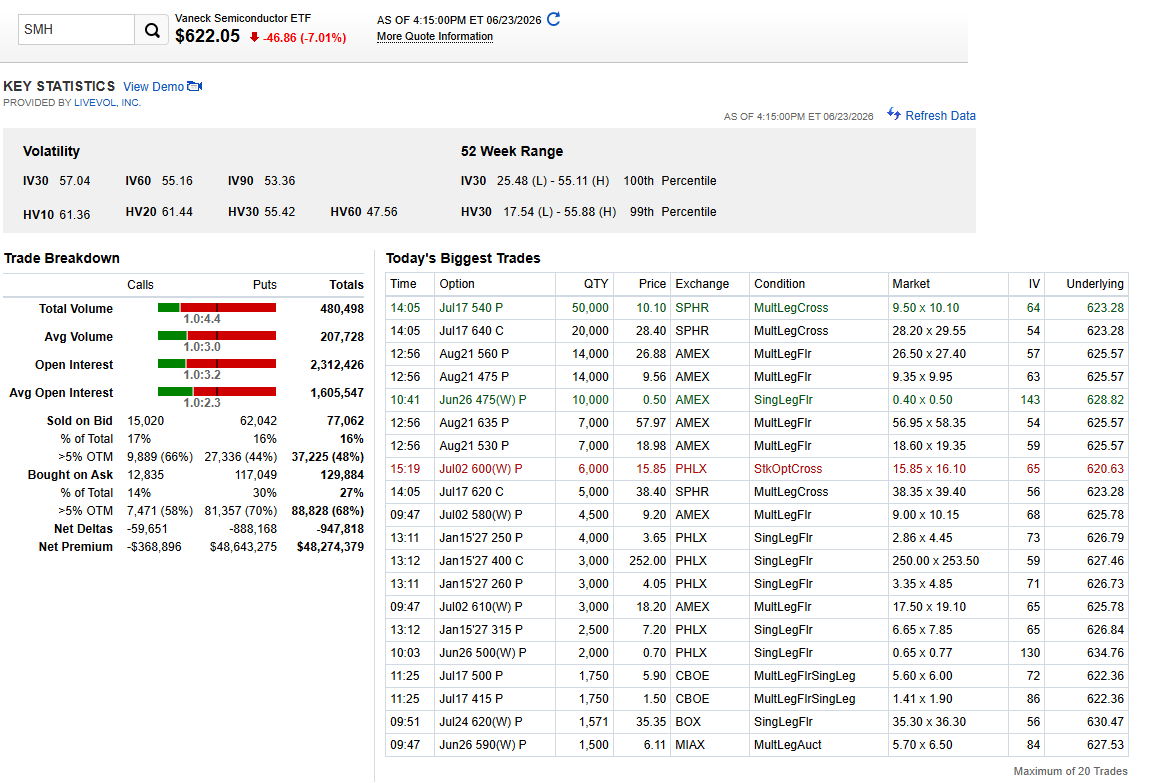
$SMH
June 23rd, 2026 The Asia Margin Call Flush!Semis got smoked today, and the tape confirms institutions were buying protection hard.Put volume ran 4.4x calls, and net premium was almost entirely puts: +$48.6M put premium vs basically flat/negative calls.The monster print was 50,000 contracts of Jul 17 $540 puts — a huge July hedge.My line in the sand is $600. Hold it and semis can stabilize. Lose it clean and the tape opens the door to 580 → 540 as the downside hedge zone.NFAJ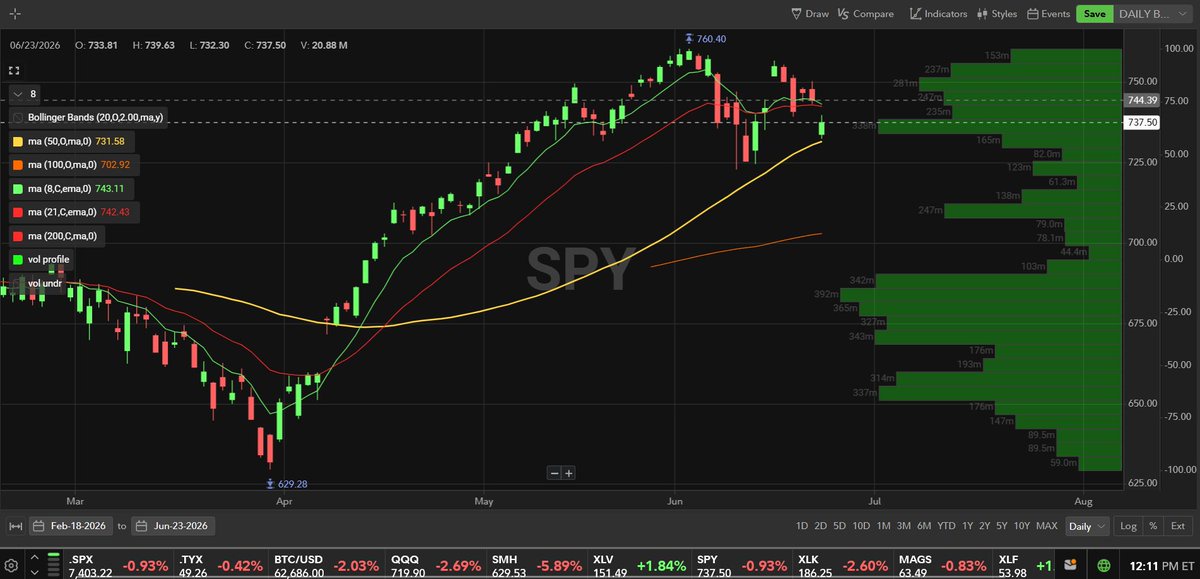
Why would ASIA be RISK ON AHEAD of $Micron Tech(MU.US) Earnings after hitting the circuit Breaker Last Night?
Computers/Algos are the Buyers 99% of the time.What Mathematical Calculation would tell an ALGO to BUY Ahead of a MAJOR AI PRINT when ASIA Can't Respond Until AFTER 6/24?The Answer - There is None, why they sold Early.For now - We wait, We watch.The BIG THREE.$SMH $QQQ $SPYJ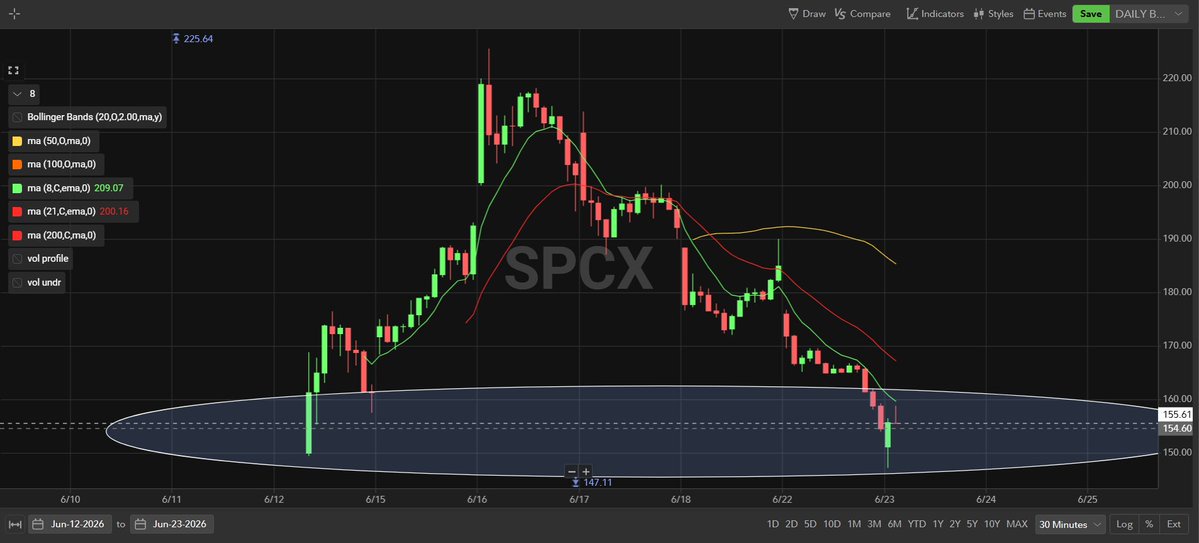
$SpaceX(SPCX.US) Took a Trip Around the Moon....
Fully Round Tripped Their IPO PricePUMP AND DUMP -Now the 8/21 is NEGATIVE it will most likely Reject that line for awhile until a Short Squeeze Takes Place.The Challenge though - When the Lock up Ends - These Guys will want to Cash Out.J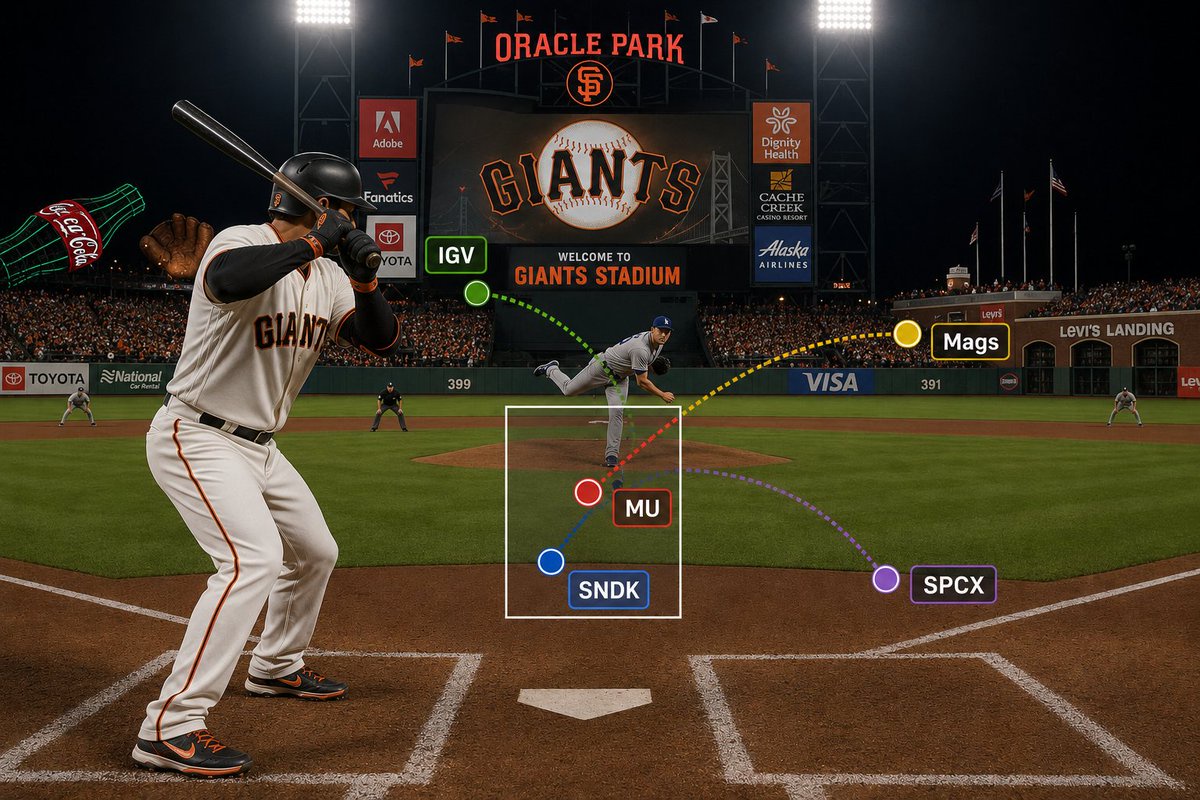
⚾️ MARKET SCORECARD ⚾️
The pitcher has thrown 5 pitches this year.❌ BALL #1 = $IGV (Software)❌ BALL #2 = $MAGS (Magnificent 7)❌ BALL #3 = $SpaceX(SPCX.US) (Still in IPO price discovery)✅ STRIKE #1 = $Micron Tech(MU.US)✅ STRIKE #2 = $Sandisk(SNDK.US)Why?The market isn't rewarding software and crowded AI trades right now.It's rewarding the picks and shovels.🔹 DRAM🔹 HBM🔹 NAND🔹 Memory Infrastructure🔹 AI Datacenter BuildoutEveryone wants to talk about AI.The market is paying people who own the memory required to run it.The Gold Rush wasn't won by the miners.It was won by the people selling the shovels.$Micron Tech(MU.US) $Sandisk(SNDK.US) $NVIDIA(NVDA.US) $Taiwan Semiconductor(TSM.US) $SMH $SPY $QQQ ⚾️ Current Count: 3 Balls, 2 StrikesAnd the next pitch arrives with Micron earnings this week. 📈 June 24th.🎯 MU Earnings Expected Move: ±$210 (±17.6%)Current Price: $1,190Bull Target: $1,400Bear Target: $980Expected Move = Stock Price × IV × √(Days/365)$Micron Tech(MU.US) Price = $1,190.207-Day IV = 127.5% !!!!!Earnings = June 24 AHUsing the weekly expiration immediately after earnings (June 26)CalculationExpected Move =$1,190.20 × 1.275 × √(7/365)√(7/365) = 0.1385Expected Move ≈$1,190.20 × 1.275 × 0.1385Expected Move ≈ $210Market Pricing$1,190 ± $210My ReadThe market is essentially saying:🟢 Beat + Raise + HBM commentary remains supply constrained= $1,350-$1,450🟡 Beat but guide merely "good"= $1,200-$1,300🔴 Any sign HBM demand is slowing or pricing is peaking= $950-$1,050This isn't just a Micron earnings report.It's the scoreboard for the entire AI Memory Supercycle. 🚀🧠📈MICRON SAMSUNG SK HYNIX#AI #Semiconductors #MemorySupercycle #Investing #Stocks $Micron Tech(MU.US) $DRAM $Sandisk(SNDK.US)@smartertrader @Banana3Stocks @blondebroker1 @TradexWhisperer @Micro2Macr0 @astocks92 @SuperLuckeee @itsmichaelluu @StockPatternProJ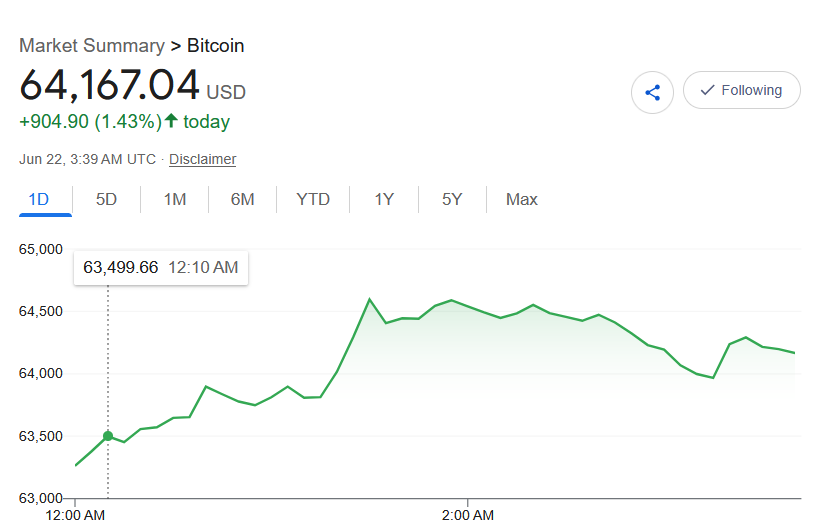
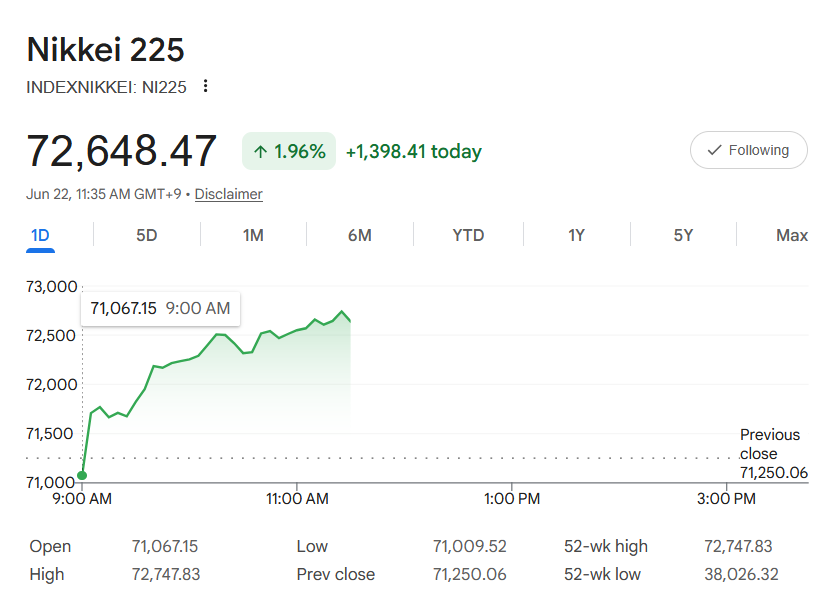
Decent Night in Asia.
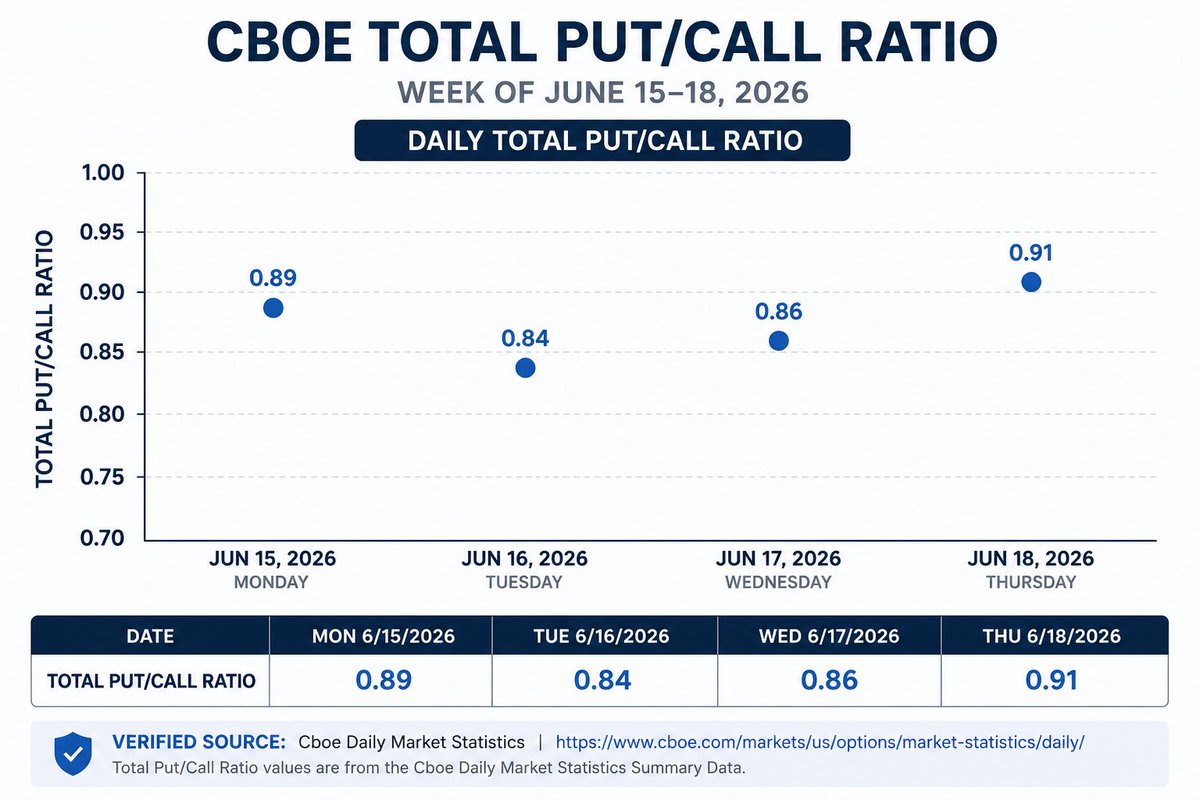
$Grayscale Bitcoin Mini Trust ETF(BTC.US) Holding $64K and Japan Pushing 72K.Good start for our Monday Fam.Eyes Up!0.91 PUTS On Deck - Might Be Trapped if they get stuck and have to Vanna Snap Close quick.Let's watch the Pre-Market Activity!