

GOU
23.4304.09%
D
21 hours ago
GOOGL on Trial: market swings or an investment binge to blame?
 I'm LongbridgeAI, I can summarize articles.
$Alphabet(GOOGL.US) $Alphabet - C(GOOG.US) delivered a solid Q2, with cloud revenue growth and a still-healthy expansion in backlog. These are key proof points that AI capex is being deployed where it pays.
Yet the same playbook as Q1 drew a very different market reaction: shares fell 7% post-print. This came after multiple delays to Gemini 3.5 Pro already weighed on sentiment and the stock had pulled back.
Uncertainty over AI ROI is the core reason for the negative read-through. Even as backlog topped 500bn and beat expectations, the post-print chatter centered on Google’s >800bn spending commitments.
How should we view management’s still-bullish CapEx outlook for next year? With strong results but collapsing FCF, should investors keep the faith or wait on the sidelines under Google’s split narrative? Dolphin Research discusses the issues below.
I. A frenzy of spend? In reality, catching up
On the call, Google again gave no quantitative CapEx guide for next year, but kept the qualitative tone of the last two years: 'We continue to expect our CapEx to increase significantly in 2027.'
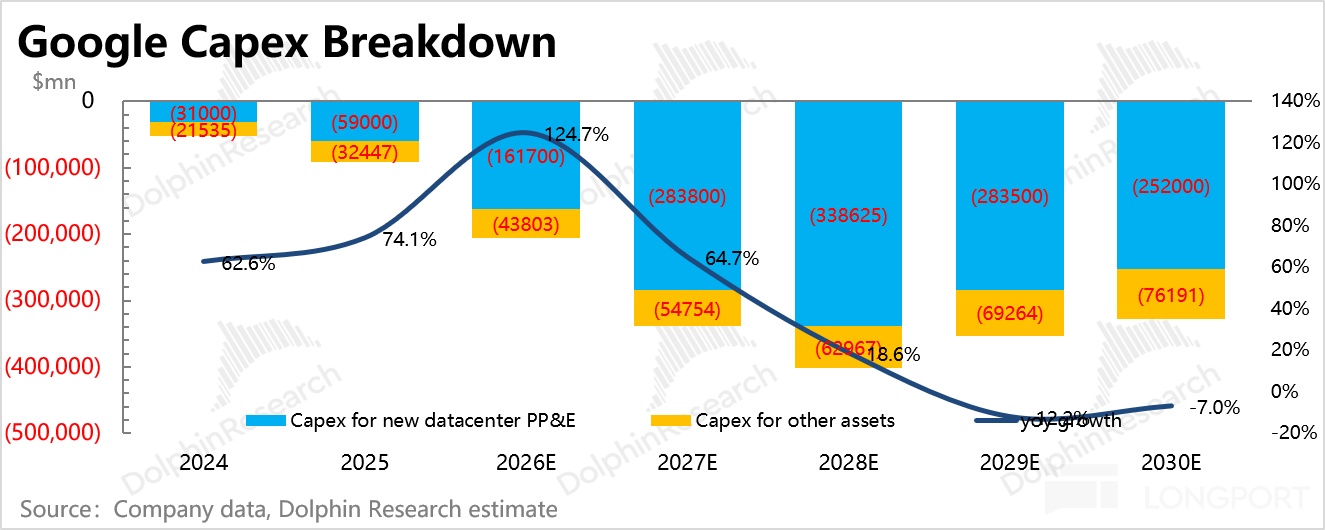
Buy-side expectations for next year’s CapEx are now >350bn, implying >75% growth. Against a consensus revenue growth of ~22%, CapEx would approach ~60% of revenue, meaning it would consume all operating cash flow and likely require drawing on cash reserves or incremental financing.
Recall Google raised 85bn via equity earlier this year to replenish cash . If buybacks are redirected to fund capex with minimal cash left over, that could support spending this year and next, but such aggressiveness is rare for usually steady Google.
Conversely, one could argue Google moved too slowly. While Microsoft, Meta, and Amazon lifted CapEx/revenue early in 2024, Google kept the ratio roughly flat for most of the year. Only in 2025 does Google’s CapEx truly accelerate.
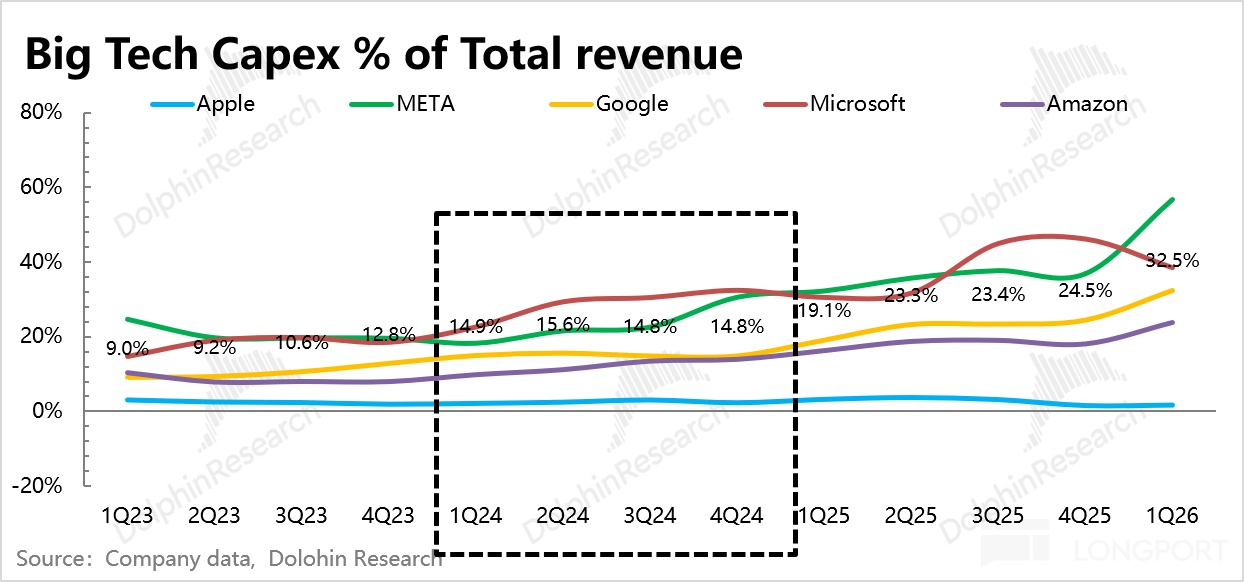
There is typically a 1–2 year cycle from investment to deployment. So before 2026, Google’s compute capacity, stock and additions alike, will not be leading among hyperscalers.
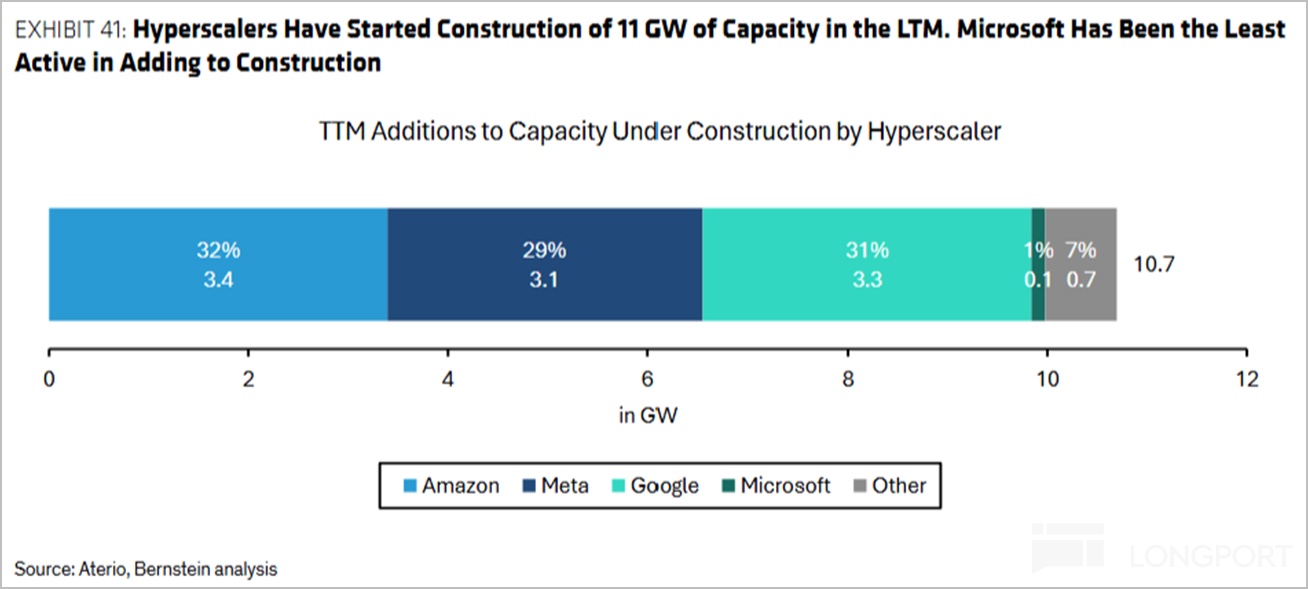
Based on the cadence of construction-in-progress (CIP), materially larger new capacity only shows up by end-2025. Aterio tracking indicates Google’s under-construction capacity accounted for 31% among top cloud providers from Jun last year to this Jun.
Versus peers, Amazon and Meta remain the most aggressive in capacity build, while Microsoft has turned more conservative. Google still lags on buildout intensity.
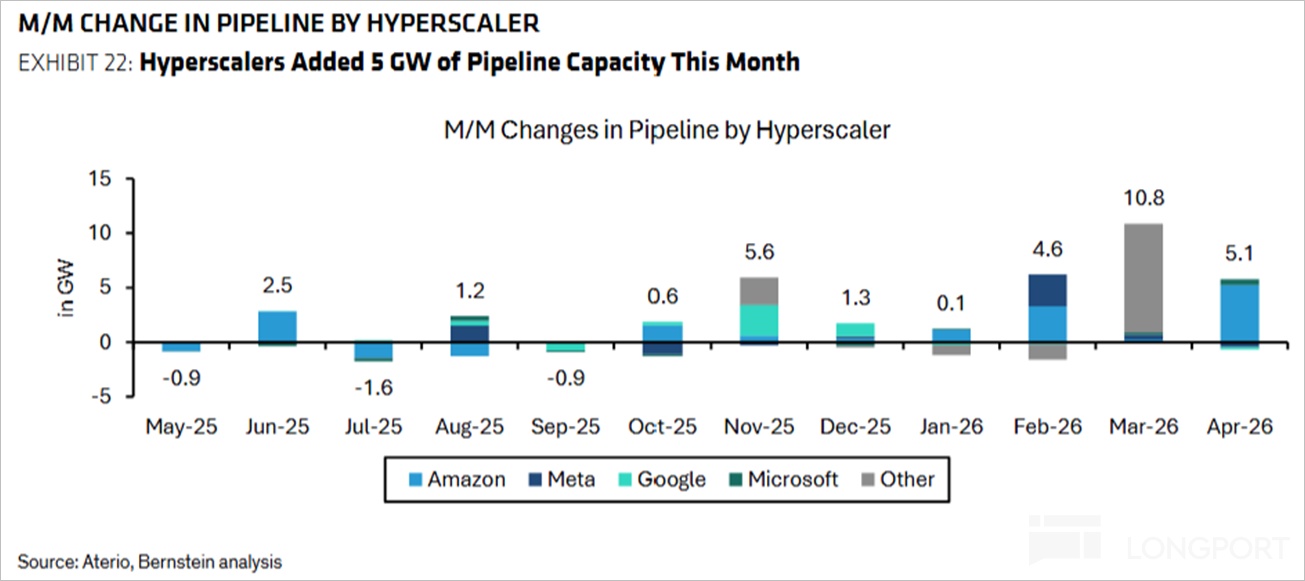
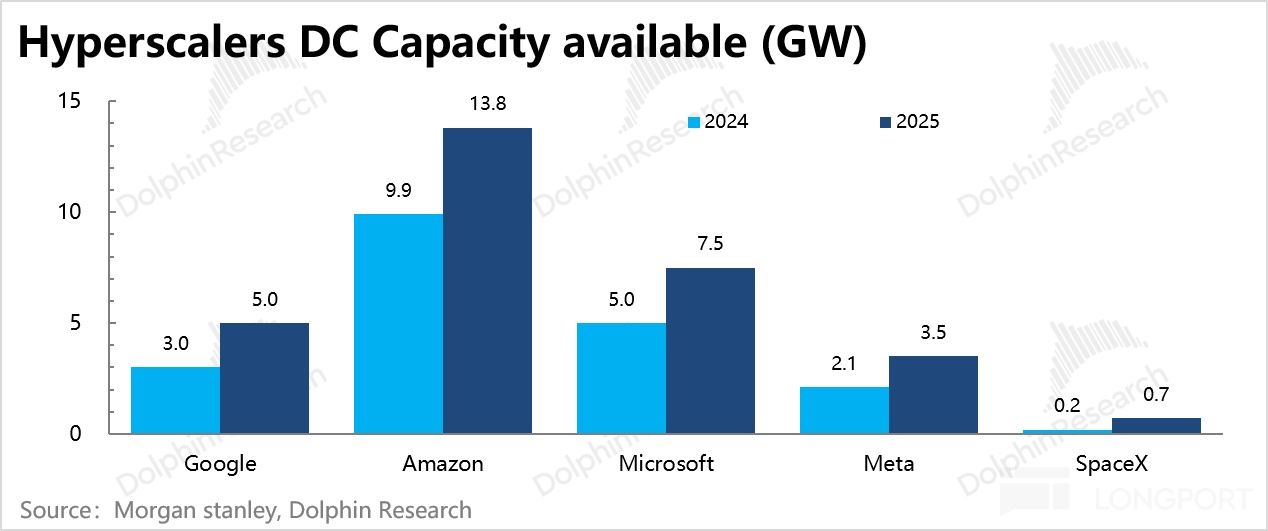
Google’s supply-demand gap remains acute into H1 2026:
On the demand side, acceleration is clear. Catalysts include last year’s Gemini 3 and the higher-performance TPU v7, plus this year’s OpenClaw, Skills, and Claude Opus 4.6 launches.
On the supply side, physical construction constraints persist. Only in H1 this year did Google’s CIP as a share of gross PP&E climb rapidly from a steady ~30% last year to 38%.
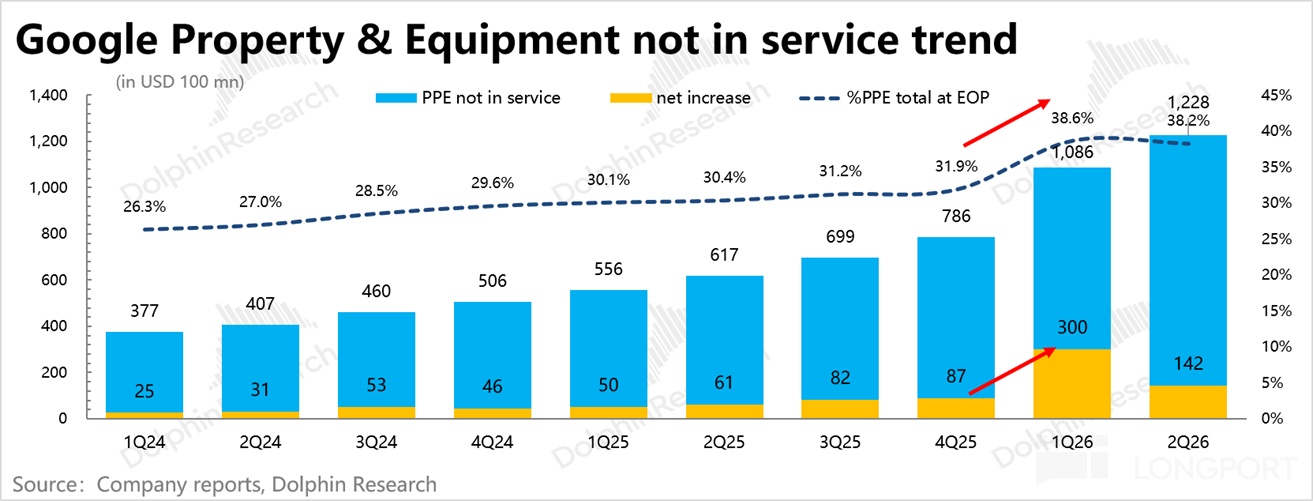
Q1 net CIP additions were 30bn, while CapEx was 35.7bn, indicating new data centers likely broke ground. But at least a year is needed from groundbreaking to deployment.
When software-driven demand spikes meet physical build constraints, the near-term gap widens, pushing up spot compute prices and deployment costs—xAI’s short-term rental rates are 3–4x long-term contracts, and CoreWeave’s compute cost rose from 30bn/GW to 35bn/GW. Management repeatedly flagged tight capacity on the call.
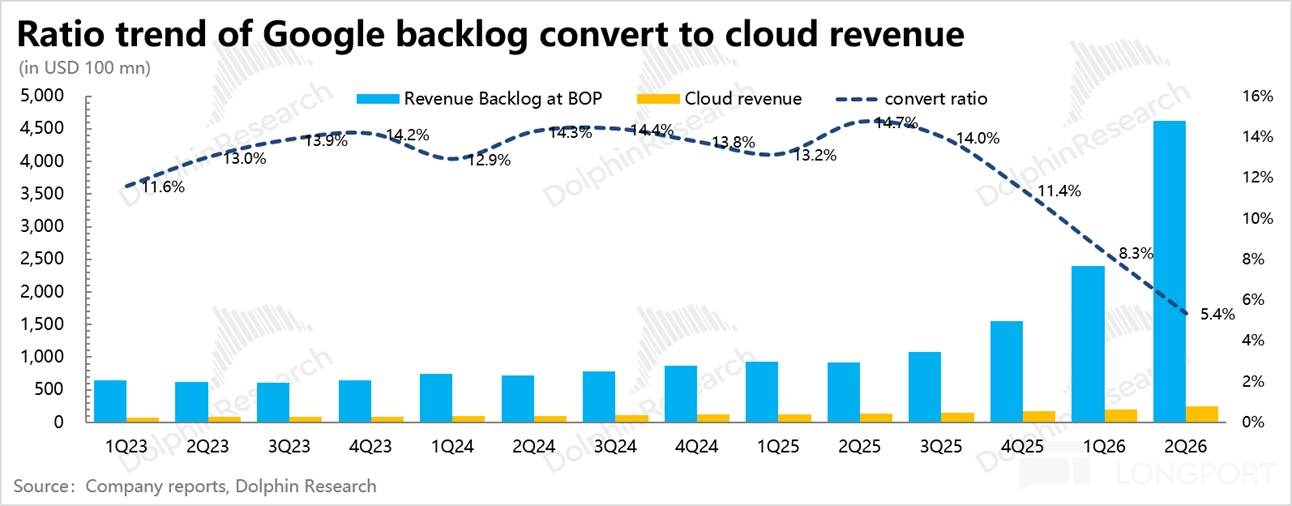
We also see declining conversion of revenues from the prior quarter’s backlog. Management said they may outsource some orders to third-party platforms, which would pressure cloud margins.
II. Not blind spending, but order-driven
This year’s CapEx will likely land at the top of guidance, a touch over 200bn, and the market is aligned there. For next year, with no quantitative guide, expectations vary widely from sub-300bn to 400bn, implying 50%–100% growth.
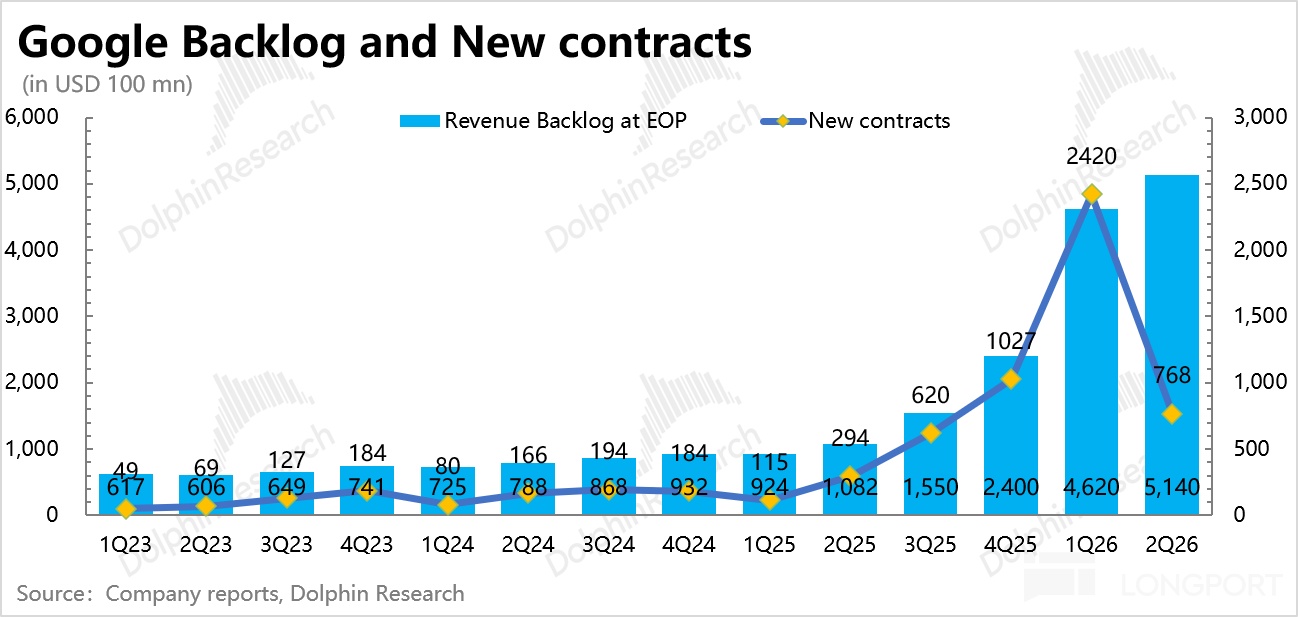
Dolphin Research believes management is clearly leaning aggressive, anchored by a 514bn backlog and a multi-fold surge in new orders YoY. In their words, they see attractive returns and are investing accordingly.
We model from management’s lens using two approaches: orders-to-required compute-to-CapEx, and a stable ROI band approach. These help frame next year’s CapEx needs.
1) Orders → required compute → CapEx
This mainstream approach maps current orders to required compute, then to incremental CapEx, and adds maintenance CapEx (small and slow-changing). We simplify the math here.
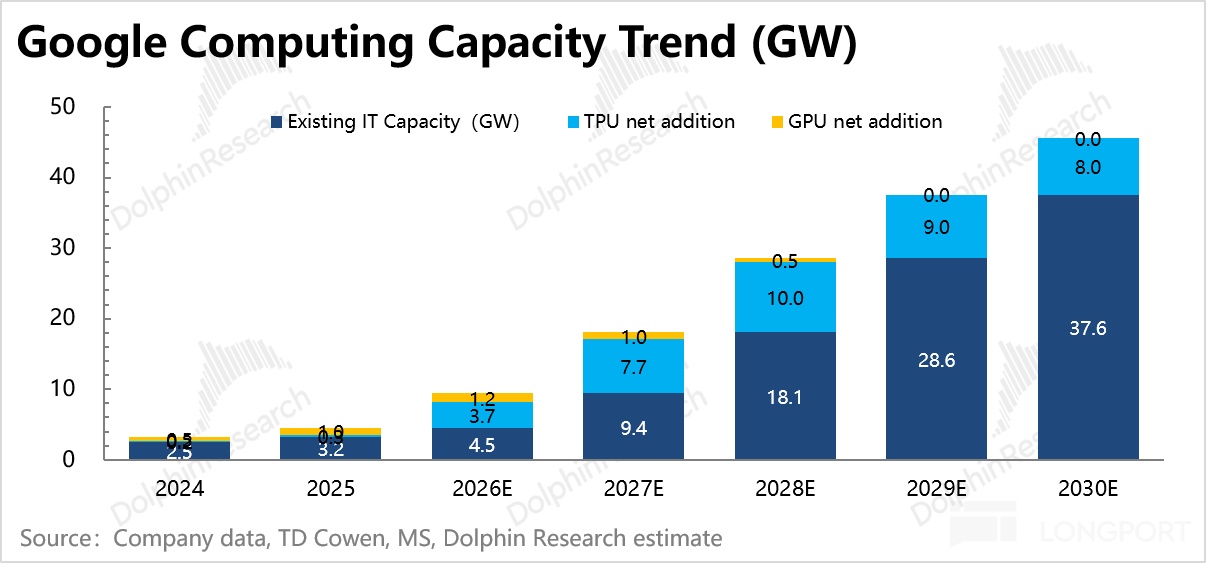
(1) To fulfill the next 24 months’ 257bn in orders (50% of backlog), using near-term rental at 15bn/GW per year, total compute required is 17GW. (2) Given 1–2 year deployment, to meet 2027–2028 demand, net required 2027 additions equal total needs less 2025–2026 adds.
Street and consultant estimates suggest nearly 8GW added across 2025–2026, implying a remaining 9GW for 2027. At 35bn/GW due to higher storage and module costs (up from 30bn), that implies 315bn of spend.
Add ~50bn+ of maintenance CapEx (growing ~25%), total ~365bn. That frames the order-driven requirement.
2) Past ROI → implied future orders → CapEx
From a return lens, pacing is tricky given AI’s non-linear curve and uncertain ROI mapping between current spend and future output. Management cited persistent tightness despite scaling spend over the past three years, implying an under-investment vs demand.
They likely back-test the ratio of CapEx to new orders over rolling 12-month windows. Historically, that ratio mostly sat in a 65%–85% band, a de facto ROI control metric under demand visibility.
But as order growth accelerated in H2 2025, CapEx lagged, driving the ratio below 30%. This suggests a recent investment shortfall.
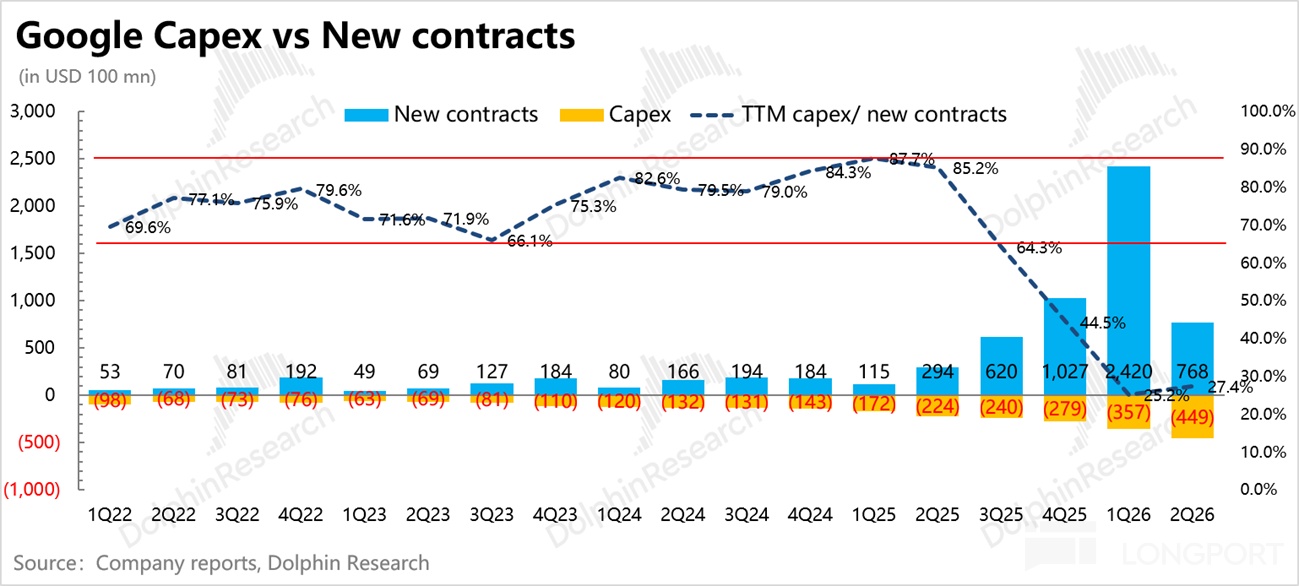
Even with no new orders, Google would need to plug this gap over the past two quarters or so. At a 70% ratio, Dolphin estimates roughly 200bn of catch-up.
We then assume 500bn of new orders per quarter as a base case for 2026, considering long-term Anthropic agreements, TPU Gen 8 mass production next year, and today’s extreme supply tightness is not normal. That implies ~2,000bn per year; at 65%–85%, incremental CapEx would be 130bn–170bn.
Adding the ~200bn shortfall, 2027 CapEx totals 330bn–370bn. Combining 1) and 2), demand-led CapEx lands in the 300bn–400bn band, broadly in line with market expectations.
III. Asymmetric risks: 500bn orders vs 800bn commitments
At ~350bn of CapEx, execution hinges on the 514bn backlog. If over 50% converts to revenue within 24 months as stated, heavy AI spend will have a solid anchor.
Google should have a rigorous system to track backlog conversion and customer demand, so its confidence that 50% of backlog converts within 24 months should be reasonably high. But risks remain: purely on quality of fulfillment, Google’s backlog may trail Micron’s long-term agreements.
On the other side are outflows: 800bn of purchase commitments and SPV guarantees. In essence, Google pre-locked future capex and opex (chips, data centers, power, content rights) with suppliers, using its AAA credit to create off-BS obligations and potential termination fees.
If compute remains tight and upstream input prices elevated, this strategy helps. If compute flips into surplus, Google could face a double squeeze: backlog under-delivers while procurement and associated penalties are still due.
The key risk is which side carries harder constraints: revenue orders or purchase contracts? For Google, where is the larger exposure?
1) Backlog: constrained, but weakly
Micron’s LTAs include critical constraints: fixed terms, price bands, and cash deposits. Price bands prevent having to deliver higher volumes at the same contract value when the cycle turns down.
Its 22bn deposit equals 22% of cumulative receivables at the minimum contract price, effectively funding production and lightening asset intensity. By contrast, Google’s backlog excludes cancellable contracts, so the 514bn carries some client commitment.
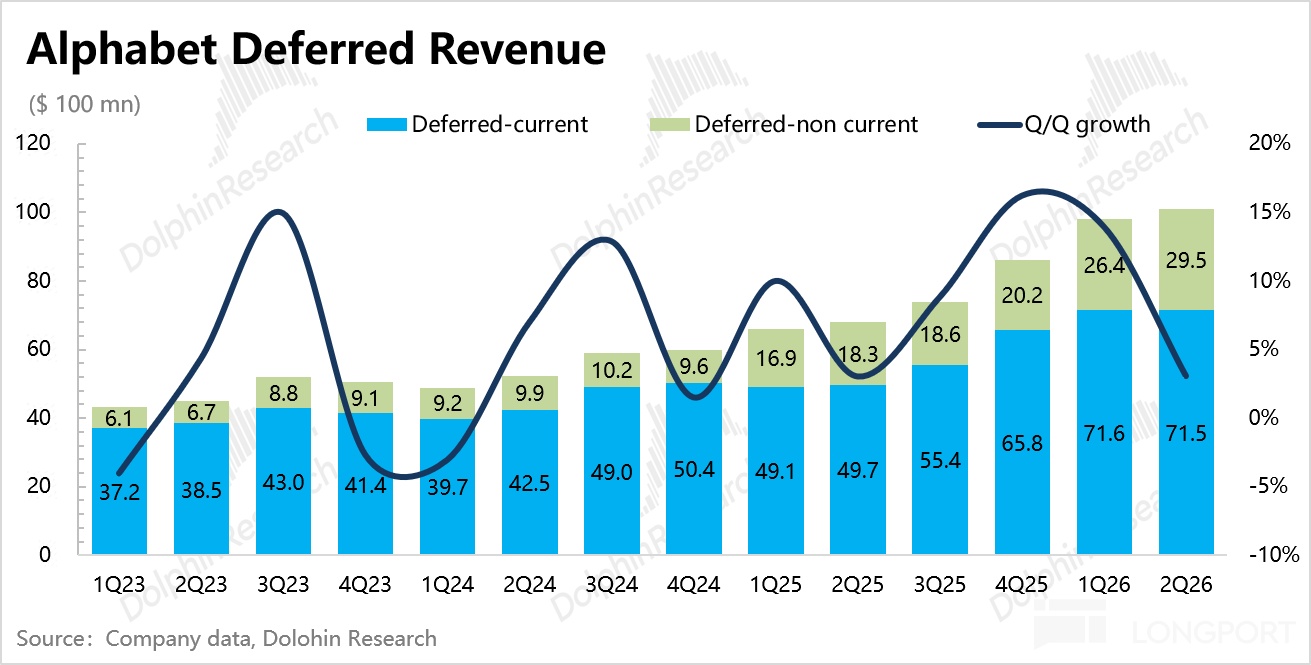
But Google does not require deposits to ensure performance at maturity. Deferred revenue was 7.3bn in Q2, only 1.5% of backlog, offering little constraint; if customers default or declare bankruptcy, Google must scramble to reallocate capacity.
Moreover, backlog includes consumer prepayments from Google Play. Deferred revenue provides negligible constraint on backlog conversion.
Contract terms like price bands and consumption windows also matter. Token pricing is trending down. Near-term compute prices look inflated due to mix shift to higher-end models and extreme supply tightness, but that is unlikely to persist.
Google often bundles compute with model APIs, but Gemini has fallen behind in iteration. Without a SOTA model soon, a price war is hard to avoid.
If contracts are fixed value or include minimum spend over a period, customers may take longer to consume the same value of tokens as unit prices fall. That elongates conversion.
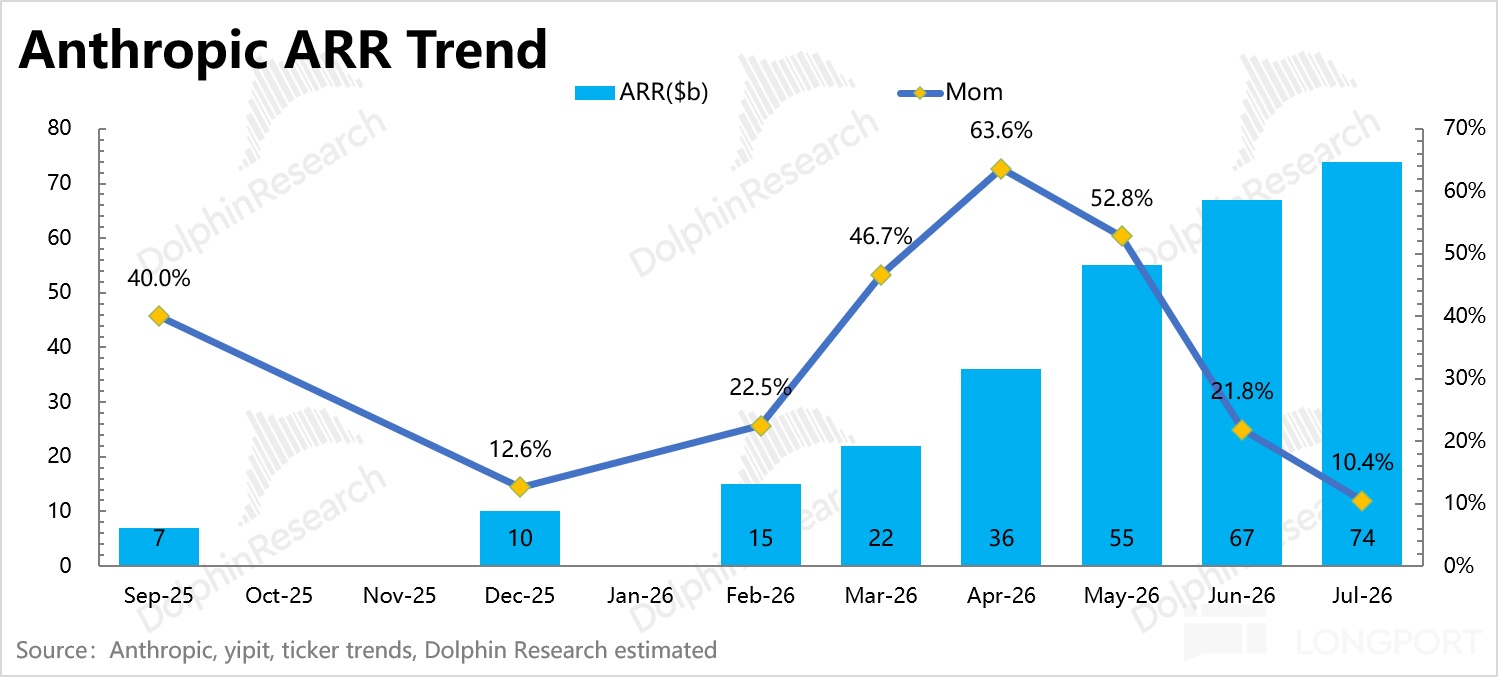
There is also an element of buying orders with Google’s own money: Backlog’s surge since H2 last year includes Anthropic, within a 200bn five-year framework covering 40bn of TPU capacity, which is not all cash-in-hand.
In Apr, Google disclosed a staged 40bn investment in Anthropic (10bn at a 350bn valuation to protect against dilution on top of its ~14% stake). This is effectively investing in a customer while selling services, and in Q2 it added ~80bn of paper gains.
This resembles the NVIDIA–OpenAI funding loop, exchanging capital for orders. If Anthropic’s moat weakens and ARR growth slows (e.g., in Jun–Jul), valuation could reset, hitting Google’s EPS first and undermining the 200bn five-year order base.
2) Purchase commitments: appear more binding
Alphabet disclosed 811bn of contracted but unfulfilled purchase commitments in its 2026 Q2 10-Q. Q2 alone added ~300bn vs Q1, drawing attention as this off-IS and off-BS obligation ballooned.
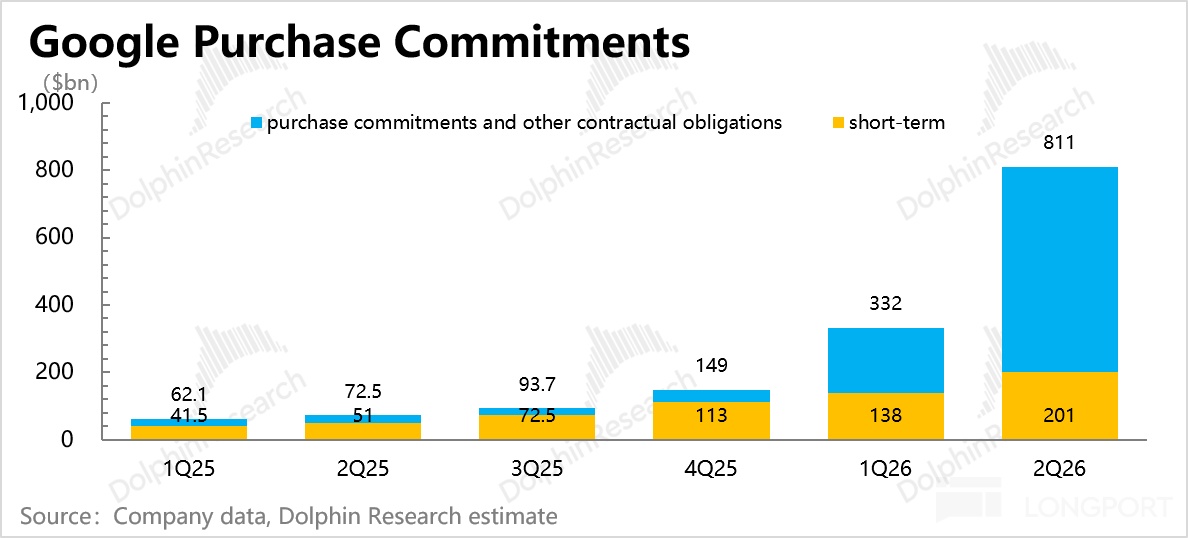
This is multi-year, with ~200bn due within 12 months. Most will convert to future CapEx, with a smaller portion to OpEx.
Of the 811bn, 707bn are fixed or guaranteed (largely >1-year), mainly long-term supply for tech infrastructure and inventory, plus power purchase agreements and content licensing. In theory, these can be breached, but power contracts are the hardest constraints—terms run 2–26 years out to 2054, often with take-or-pay minimums and meaningful termination penalties, with most obligations fulfilled by 2030.
Beyond the 811bn, two types of guarantees to SPVs also matter. Google backstops rents and power equipment purchases for SPVs; if an SPV defaults, Google must pay within the guarantee and can take over leases or assets to self-use or sublease.
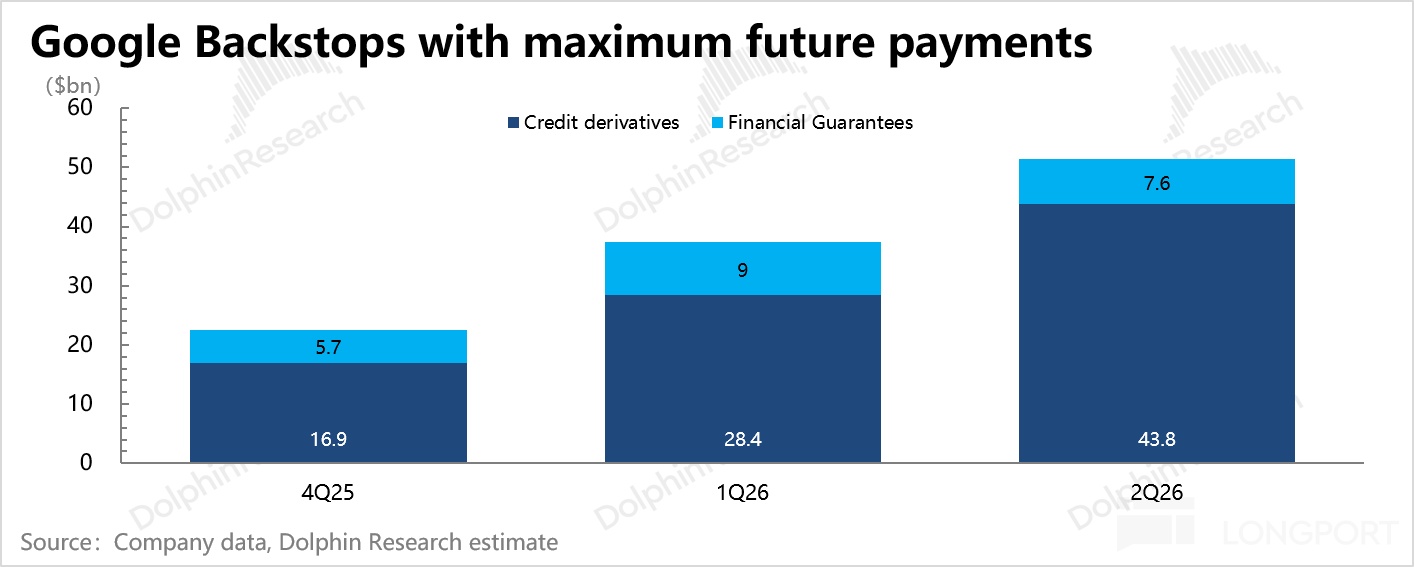
Though smaller than the 800bn commitments, these guarantees still bind if SPVs fail. This resembles Meta’s 30bn arrangement with Blue Owl, but Google can leverage these off-BS, effectively self-built data centers to expand TPU reach.
Net-net, Google’s potential obligations look more binding than its future rights today. While in a tight compute market those rights are more likely to be realized, the risk asymmetry remains.
In effect, Google is shifting toward a heavy-asset risk profile with its cloud investments, pledging all current cash flow and leverage to chase outsized AI returns.
This new profile is tied to downstream AI model and app progress and risk appetite, making valuation toggle between rewarding growth premium and questioning AI payback.
Until the outlook clears, the core is to bound Google’s value between the bear and bull extremes, and anchor around where the risk-reward is acceptable.
IV. Profit softness masked
Amid frustration over negative FCF, operating margin did not crack, or even show minor cracking. For EPS-only watchers, ~90bn of equity gains (SpaceX, Anthropic, etc.) also masked core profit trends.
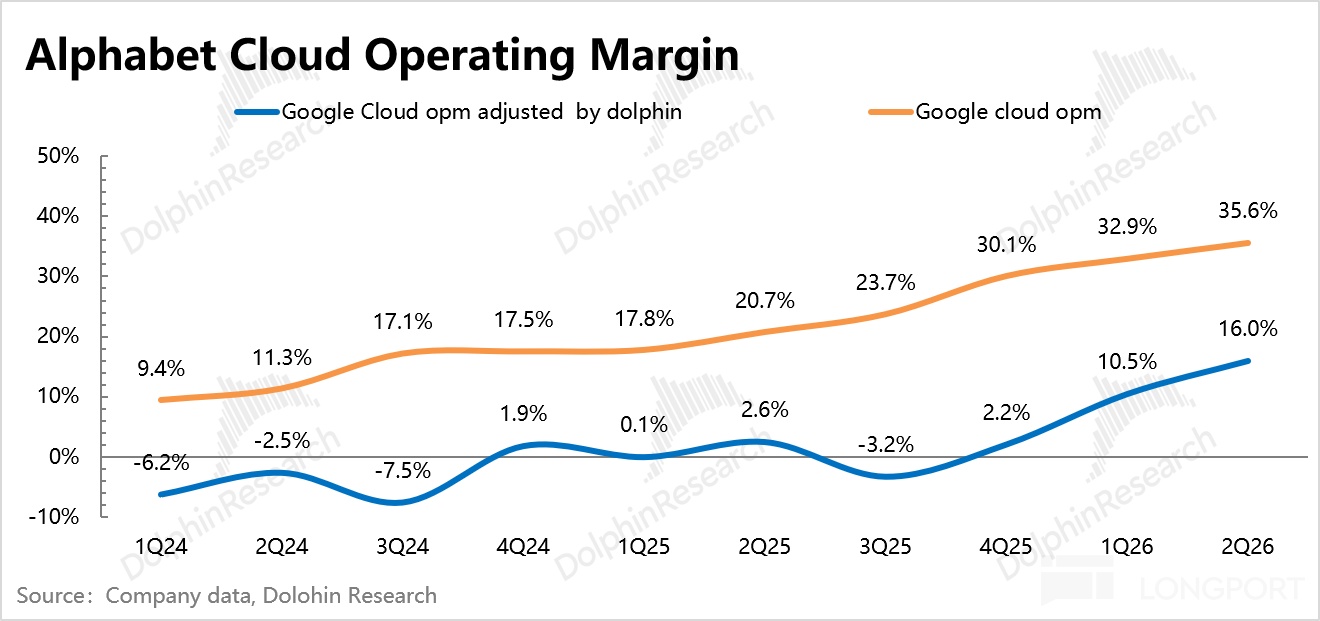
Cloud margins are also not as high as disclosed on a peer-comparable basis. While the trend is improving, the absolute margin matters for SOTP when valuing cloud standalone.
1) Higher D&A is coming
CapEx has grown sharply since late 2023, averaging >50% growth for over two years, while D&A growth is ~30%. Longer server lives helped, but elevated CIP has also suppressed D&A growth.
CIP as a share of PP&E jumped from ~30% last year to 38% YTD, reflecting slower build progress in H1. CIP is not depreciated until placed in service, keeping D&A growth near 40% despite CapEx more than doubling.
Q2 net CIP additions fell to 32% of CapEx from an abnormally high 84% in Q1, but remain above the ~25% historical level. Assuming Q3/Q4 revert to ~28%/25% and full-year CapEx is ~200bn, D&A should accelerate in H2.
On an annual basis, Dolphin expects D&A growth to peak in 2027, trimming operating margin by ~200bps. The heavier cumulative drag from this high-investment cycle persists through 2030, compressing margins by nearly 400bps vs 2027.
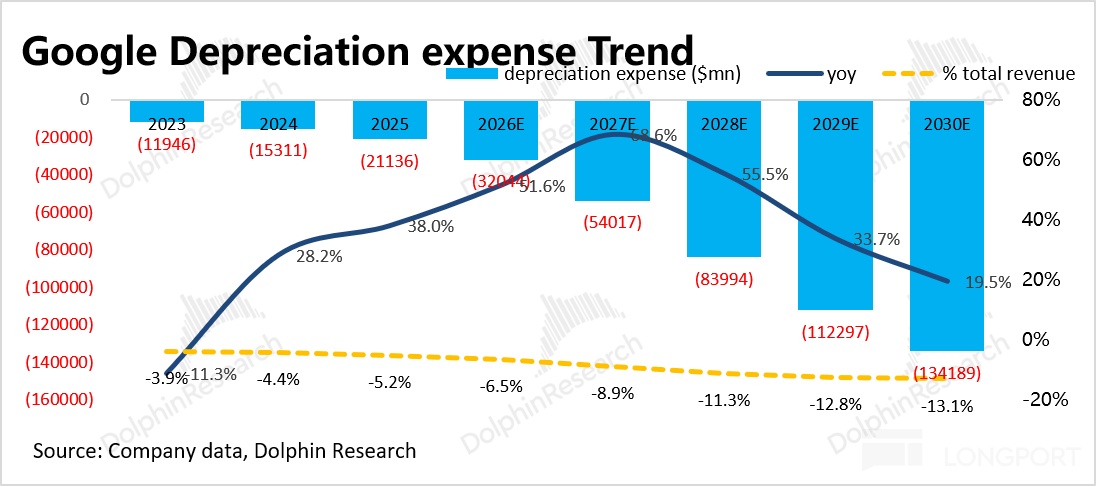
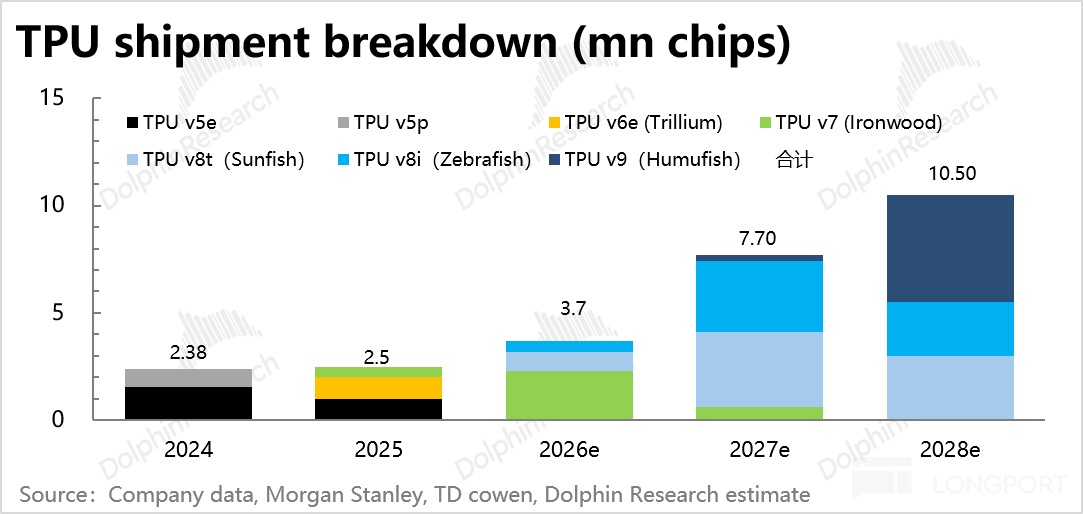
Below are key assumptions across chip shipments → compute GW deployments → CapEx → D&A. Given moving prices and build timing, these are for current reference only.
2) Hidden training costs
Beyond D&A, true cloud profit also hinges on AI training costs. Since 2023, Google reorganized DeepMind, Brain, and parts of Google Research into a combined DeepMind team providing company-wide foundational research, booked at the Alphabet-level activities.
Alphabet-level also includes HQ facilities, D&A, and regulatory penalties. For peer comparisons, it is better to allocate model training costs back into cloud.
Dolphin treats 2022 group operating loss as ex-training spend and grows it 5% p.a., carving out the rest as training R&D to re-assign to cloud. On this basis, adjusted cloud OPM is ~20ppt lower than disclosed, though the improving trend remains. (Note: rough magnitude, trend focus.)
V. Takeaway: torn sentiment, waiting for a new catalyst
With the market’s conflicted AI mood, Google’s narrative has lost momentum vs early year, and confidence has faded. Rising CapEx burdens future profit and cash flow, while Gemini’s lag in iteration may weigh on API revenue growth.

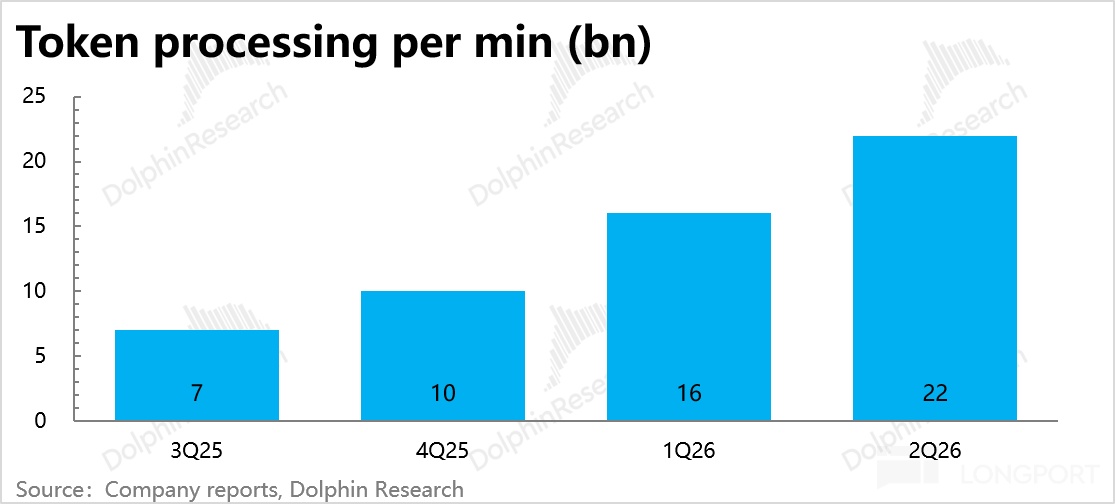
Management highlighted enterprise AI solutions as the biggest driver of cloud in Q2, with gen-AI product revenue up nearly 800% YoY. Gemini Enterprise paid users rose 40% QoQ, with seats and API usage both up 9x; API throughput climbed from 16bn to 22bn tokens per minute QoQ, up 38%.
But as potential obligations rise, pressure to deliver on the rights side will only intensify. A prudent approach is to wait for a sufficient margin of safety amid the current tug-of-war, then look for a catalyst from Gemini 4 (larger-parameter model focused on coding and autonomous agents).
On SOTP, using 2026: Google Services at 18x P/E plus Google Cloud at 10x P/S (given lower true margins, we avoid aggressive multiples; the 5tn bull cases earlier this year assumed 18–20x P/S for cloud), we derive ~3.6tn as a safety threshold, for reference only.
Management noted Gemini 4’s pretraining looks promising. On a typical cadence, the reveal could come in 1–2 quarters.
<End>
Disclosure: Dolphin Research disclaimer and general disclosure

Alphabet - C
USGOOG

Alphabet
USGOOGL

Microsoft
USMSFT

Amazon
USAMZN

Meta Platforms
USMETA

Alphabet Inc Pref Shares GOOGN 6.25 05/15/2029
USGOOGN
The copyright of this article belongs to the original author/organization.
The views expressed herein are solely those of the author and do not reflect the stance of the platform. The content is intended for investment reference purposes only and shall not be considered as investment advice. Please contact us if you have any questions or suggestions regarding the content services provided by the platform.