

HYNX

SK hynix: Can LTAs smooth the cycle? How far can valuation go?
 I'm LongbridgeAI, I can summarize articles.
HBM prices have surged, and SK hynix shares have rallied as much as 10x over six months, while Samsung and Micron are rapidly taking supply chain share. We fully walked through DRAM/HBM supply-demand shifts and the cycle turn in the prior note, see Part I.
Industry upcycle does not guarantee easy profits at the company level. This note stays on SK hynix, examining its partnerships with NVIDIA, major ASIC customers, the three vendors’ LTA playbooks, and our forward estimates and valuation.
In the AI era, incremental memory demand concentrates with a handful of XPU and cloud players, and products are increasingly customized. Becoming a primary supplier to top customers is therefore critical. In this pricing round, LTAs have also become the main tool for both sides to lock in supply and demand. We first review customer share (bit basis unless noted), then LTAs.
3.1 Main customers: SK hynix’s moat shifts from exclusive to leading
1) Static view of the industry: NVIDIA is the dominant buyer
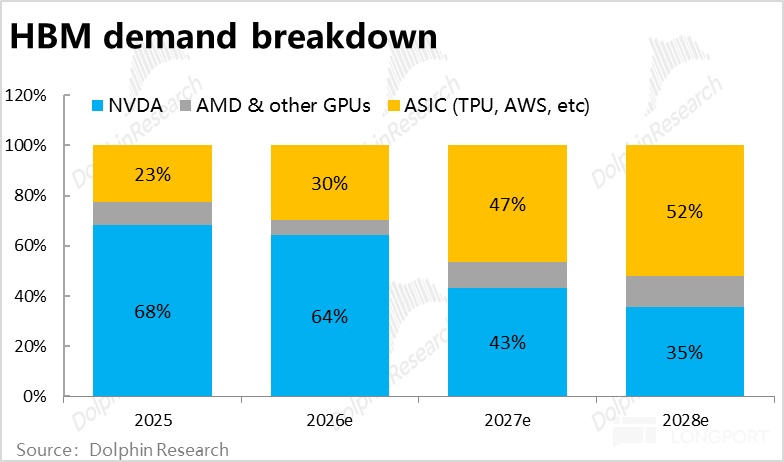
HBM demand is highly concentrated. By our estimates, in 2025–26 NVIDIA alone consumes roughly two-thirds of industry HBM, AMD about 6%–9%, and ASICs such as Google TPU and Amazon Trainium together about 23%–30%. In other words, whoever secures NVIDIA’s primary share locks in the largest and most visible block of the market.
2) Who supplies whom?
By NVIDIA, AMD, and ASIC categories, which memory vendor is the key supplier to each top customer? In short:
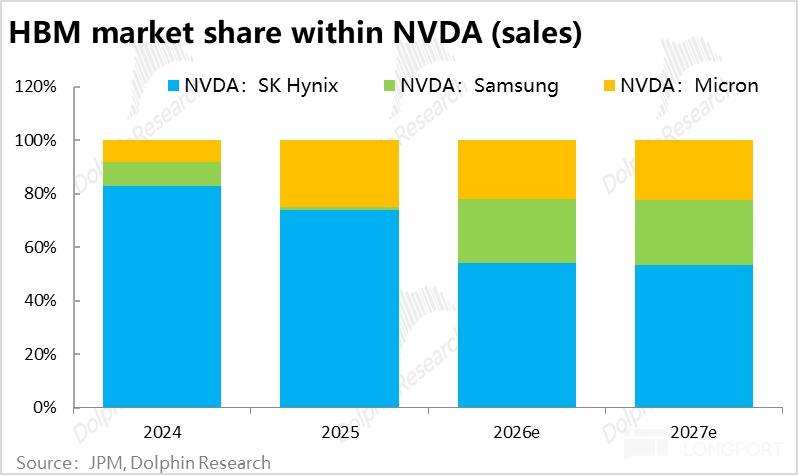
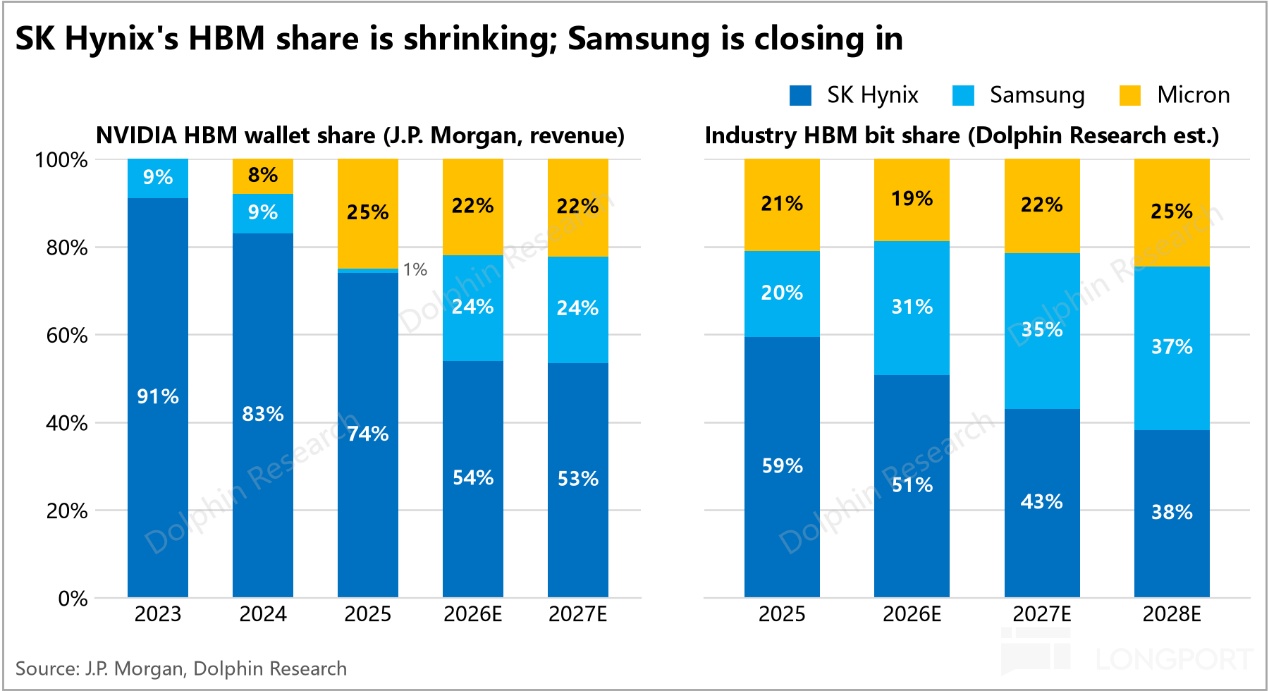
NVIDIA: SK hynix has long been the main supplier. On a purchase value basis, SK hynix supplied about 70%–90% of NVIDIA’s HBM through 2025 (revenue recognition basis). As Samsung and Micron gain share thereafter, SK hynix’s share is expected to slip to just above 50%.
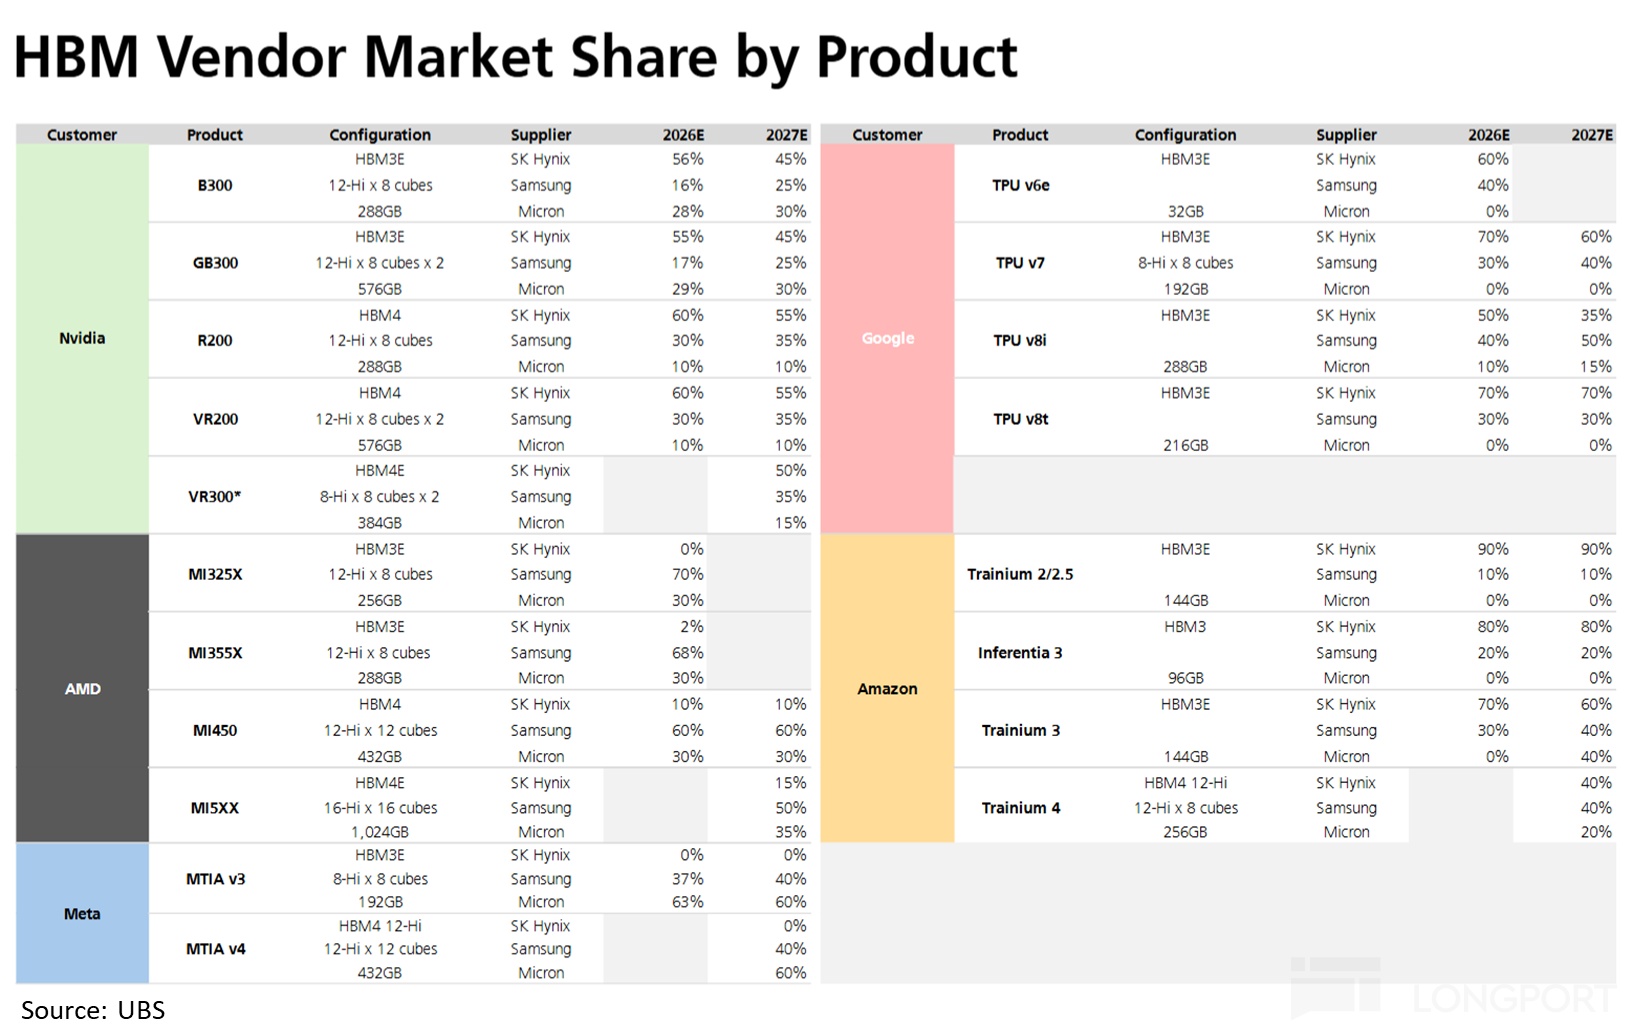
AMD: Samsung is the primary, Micron the secondary supplier. We have not seen evidence of SK hynix supplying AMD, but AMD’s share is small so the impact is limited.
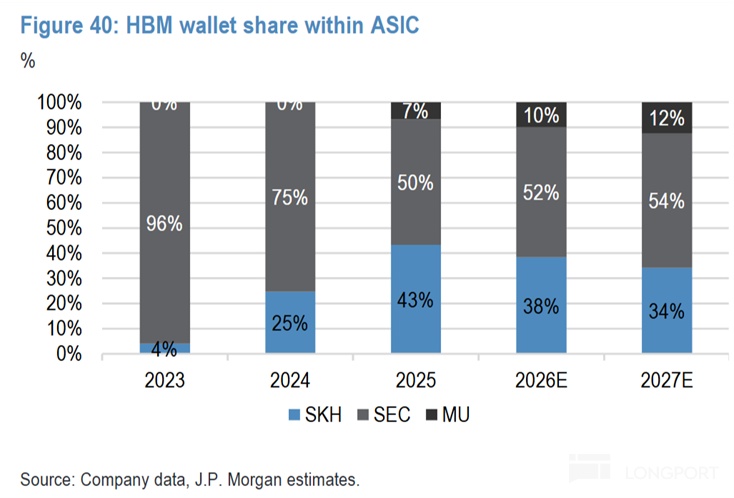
ASIC is the fastest-growing segment, mainly supplied by Samsung and SK hynix with similar shares. Microsoft Maia 200 is reportedly sole-sourced to SK hynix, Amazon Trainium 3 mainly to SK hynix, OpenAI’s Jalapeño reportedly to Samsung, while Google TPU and Meta MTIA are co-supplied with differing views on who leads (table below from UBS and JPM for reference).
3) SK hynix’s customer mix: NVIDIA is No.1 but getting diluted
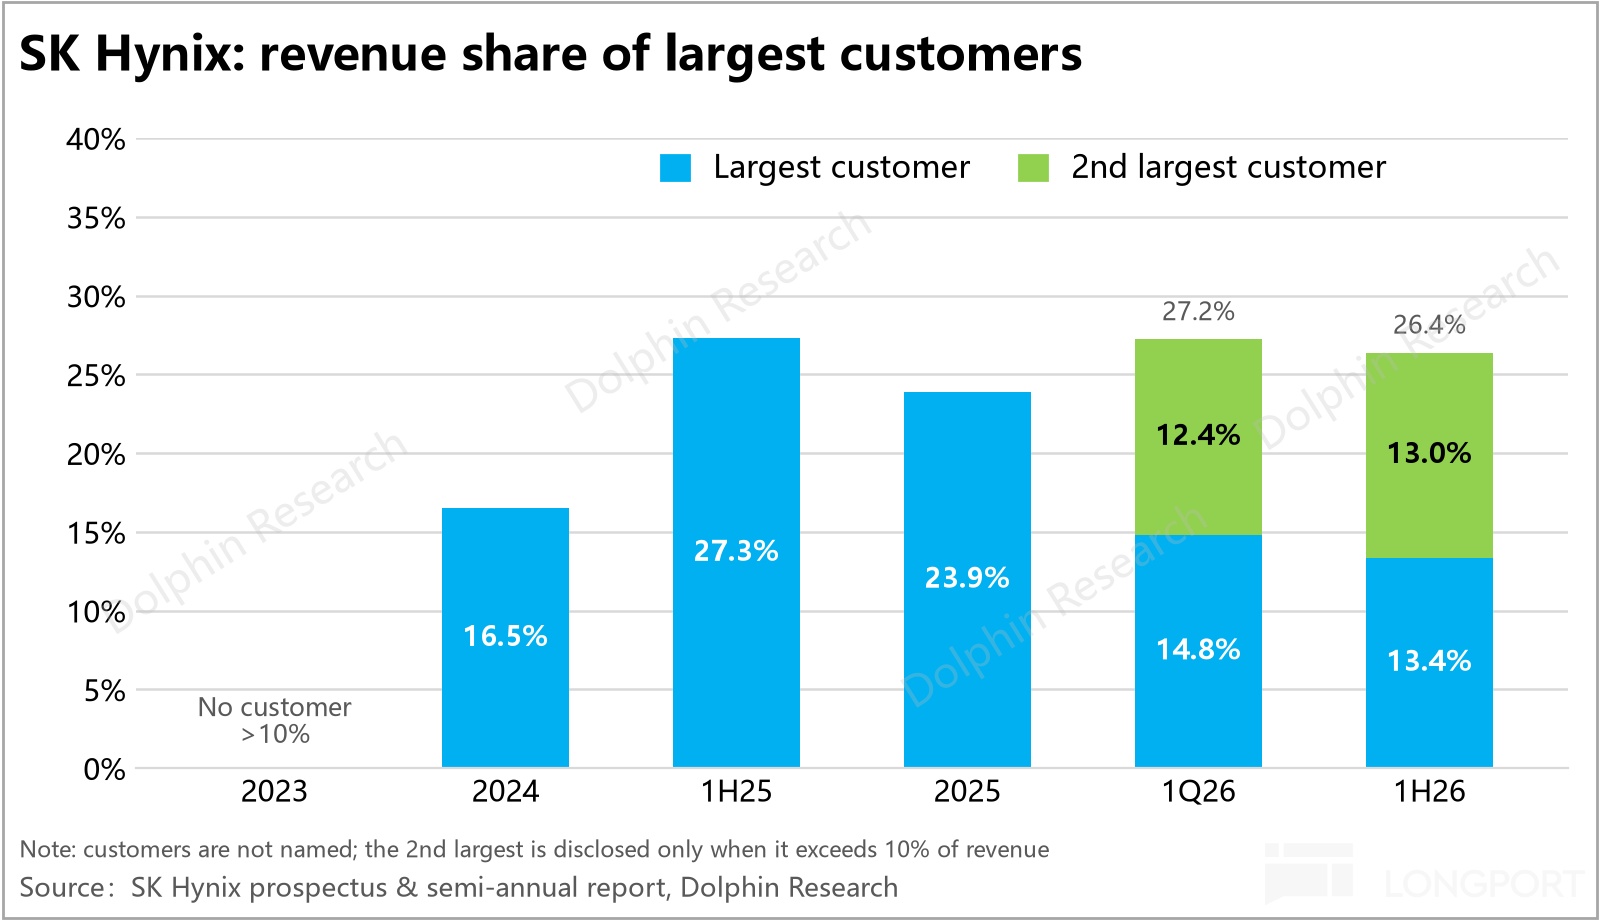
Per company disclosure, the largest customer in 2025 (very likely NVIDIA) contributed roughly one-quarter of total revenue. By 1H26, the top two customers each accounted for just over 12%. NVIDIA’s share fell mainly because DDR price hikes diluted HBM revenue, yet the top two still exceed one-quarter combined, so dependence on top customers remains high.
4) Dynamic view: diversification on both supply and customer sides
Supply side: from one dominant to three running neck and neck. As Samsung and Micron gained certifications from NVIDIA and major ASIC customers, all three can now deliver at scale, and capacity and share are converging quickly (see 2.2c). Customer side: large buyers are shifting from single primary to multi-sourcing. In 2023, ~90% of NVIDIA’s HBM came from SK hynix, and ~96% of ASIC from Samsung.
By 2027, the top supplier on both sides falls to just above 50%, and Micron enters both pools. Exclusive supply has largely disappeared among major customers.
A concern is that within fast-growing ASIC customers, SK hynix currently lacks a clear share or recognition advantage. This is where it needs to push harder.
What does layered diversification on both supply and demand mean for SK hynix and the industry? In our view:
First, competition will intensify. Once all three qualify, share will be reallocated quickly with each generation’s certification, yield, and delivery (HBM4/HBM4E). Customer trust becomes even more important at this stage.
As large customers broadly add second and third sources, capacity gaps among the Big 3 will also narrow. With more alternatives, NVIDIA and others are likely to be tougher and more selective in negotiations.
Second, dispersion does not mean weaker earnings. While more diversified supply increases competition and buyer power, the decisive driver over the next 2–3 years remains industry supply-demand. The shifting competitive pattern is secondary in comparison.
In shortage, all vendors run full and sell out. Only when supply loosens and vendors must fight for demand will issues surface.
Third, dispersion lowers single-customer risk but amplifies LTA-strategy risk. NVIDIA’s product cadence and config changes will have less impact on SK hynix. But SK hynix’s ‘low lock-in, no cap’ LTA approach is built on a leadership position; as its edge moves from exclusive to leading, downside risk in a downturn rises.
3.2 New LTA wave: raises the floor, does not erase the cycle
Memory is highly commoditized, with prices swinging with supply-demand. Downstream buyers have traditionally purchased as needed at spot or short-tenor prices, making memory stocks highly cyclical with low LT visibility. In this imbalance, LTAs have been widely adopted. Some investors believe they shift cycle dynamics, improving earnings stability and potentially lifting valuation multiples.
Historically, old-style LTAs protected buyers more. They loosely specified volumes, giving buyers allocation priority in upcycles, but allowing cuts in downcycles with low penalties. Sellers expanding on that risked inventory build and idle capacity. This round differs mainly in three ways:
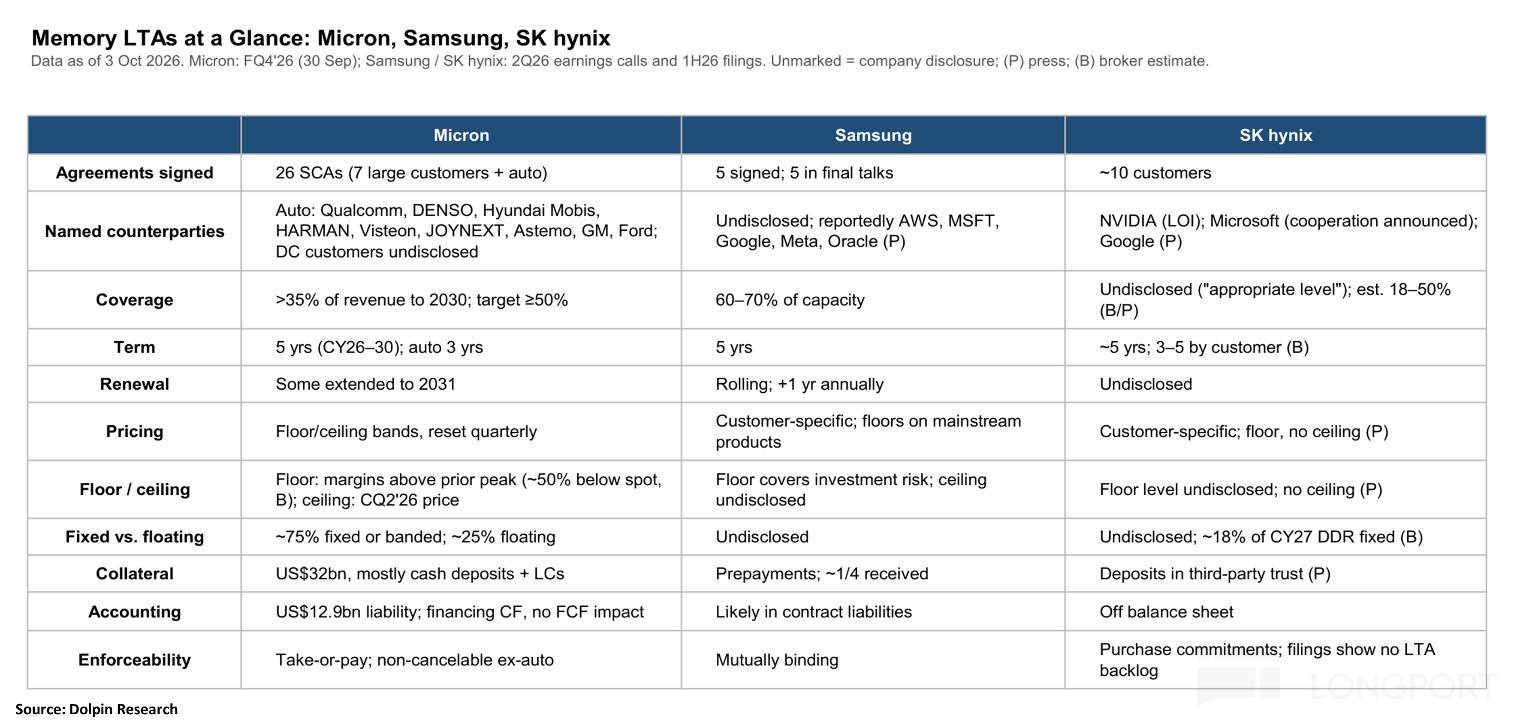
1) Penalties are pulled forward. Buyers previously paid little to no prepayments; now deposits, prepayments, or third-party guarantees are common. If buyers cut, sellers can seize deposits, making volumes more binding. Micron even said LTA visibility supports raising FY27 capex.
That said, prepayments usually cover only a fraction of contract value (Micron’s is ~16%–21% of the contract floor value). They do not fully eliminate downside risk.
2) From floating with market to price bands. Previously, contract prices were reset monthly or quarterly; now many LTAs set a floor and a cap. Micron says three-quarters of its LTAs use a floor-plus-cap model. However, per Bernstein, Micron’s floors are roughly 50% below current prices, leaving vendors exposed to sizable price downside.
3) Counterparties shifted from OEMs/channels to cloud players. Earlier LTA buyers were PC OEMs, module makers, and distributors with weaker balance sheets. This round’s anchors are NVIDIA and hyperscalers with strong finances, making non-performance much less likely.
Risks have not vanished, they pivot to whether cloud capex turns down. If AI ROI lags, LTAs may protect volume and floors, but repricing pressure can still flow back to vendors.
In short, LTAs can lock in some volume plus a price band, lifting the earnings floor but not removing cyclicality. Protection depends on coverage and the floor/ceiling width.
3.3 SK hynix’s LTA stance: low volume lock, floor-only, no cap
All three vendors sign LTAs, but with different leanings. Micron is the most willing and transparent, locking volume, setting price bands, taking cash deposits, and disclosing metrics. SK hynix is relatively lukewarm, with three key traits:
1) Lower coverage. While not officially disclosed, UBS estimates that less than 20% of SK hynix’s 2027 DDR shipments are on fixed-price terms. Management also says LTA share will stay ‘appropriate’ to leave room to capture upside when market conditions favor sellers.
Given repeated emphasis on flexibility, coverage is likely indeed low. 2) Floors only, no caps. Unlike Micron’s many floor-plus-cap LTAs (with caps reportedly set at 2Q26 market prices), SK hynix generally sets only floors. Upside passes through, and HBM still runs on annual deals rather than 5-year LTAs.
But no caps come with a cost. Customers are less willing to pre-commit, likely one reason for lower coverage.
3) Deposits do not add cash immediately. Micron’s prepayments are largely cash, going straight onto its balance sheet as usable funds. By Korean media reports, SK hynix’s deposits are escrowed with a third-party trustee and only accessible upon buyer default, offering no immediate cash-flow benefit.
Takeaway: SK hynix prioritizes offense over downside protection. The approach is ‘low lock-in, floor-only, no cap’ — maximizing upside elasticity with lighter protection on the way down. If tightness and price gains persist, its earnings torque could exceed peers; if the cycle turns, downside protection is weaker.
The divergence reflects positioning. SK hynix leads HBM with better yields and feels less need for downside insurance. Micron, the smallest scale and building big in the US, seeks LTAs for funding and expansion visibility; Samsung, having trailed in HBM, is using LTAs and prepayments to secure customers.
IV. Earnings and valuation: torque hinges on pricing; valuation near the cycle top
4.1 DRAM: pricing drives elasticity
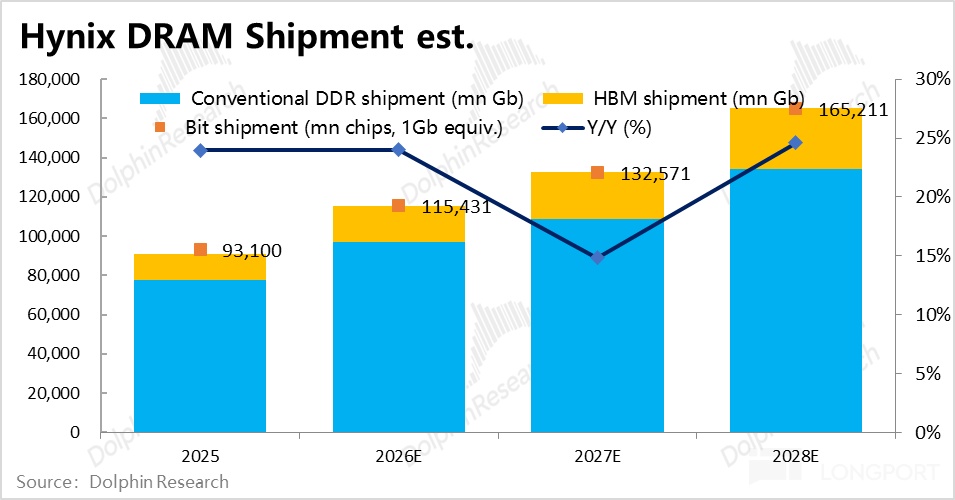
a) Shipments: HBM grows faster, DDR remains the bulk. We estimate SK hynix DRAM wafer capacity rises from ~520k to ~740k wpm in 2025–28. HBM shipments go from ~13 bn Gb to ~31 bn Gb (+~30%–40% CAGR); DDR from ~78 bn Gb to ~135 bn Gb, with 2027 new capacity prioritized to HBM and DDR up only ~12%.
b) Pricing: DDR up then down, HBM takes the baton. With capacity largely set, torque depends on price. Based on our supply-demand view, we take a cautious stance: mainstream DDR ASP up ~290% YoY in 2026, up ~5% in 2027, then down ~10% in 2028.
The 2026 shortage peaks and restocking compounds the spike. In 2027, supply-demand balances, prices peak and start easing, but inertia keeps full-year slightly higher. From 2028, new fabs ramp, supply turns surplus, and prices trend down.
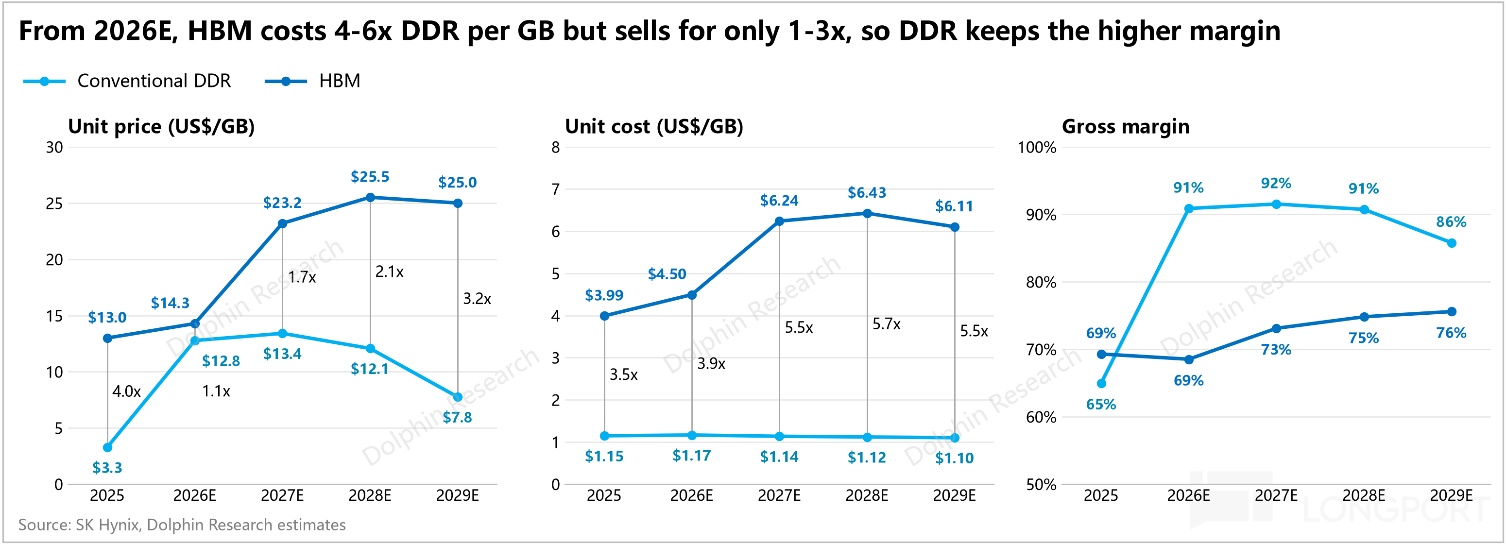
HBM: up ~10% in 2026, up ~62% in 2027, and up ~10% in 2028. HBM is priced annually; 2026 prices were set in a loose 2025. In 2027, repricing meets tighter supply and higher HBM4 mix, taking per-GB from ~$14 to ~$23. Even then, HBM revenue per wafer is only ~60% of DDR, and supply remains tight, leaving further upside potential.
c) Gross profit: DDR still carries the profit load. On costs, DDR and HBM diverge. DDR unit cost falls as nodes mature, but node transitions and depreciation limit the decline to ~2% annually from 2027, holding GPM at ~91%.
HBM costs rise into HBM4 with higher stacks and harder process, then fall. Unit cost up ~13% and ~39% in 2026–27, then down ~5% as processes mature by 2029. Pricing rises more, lifting HBM GPM from ~69% to ~75%.
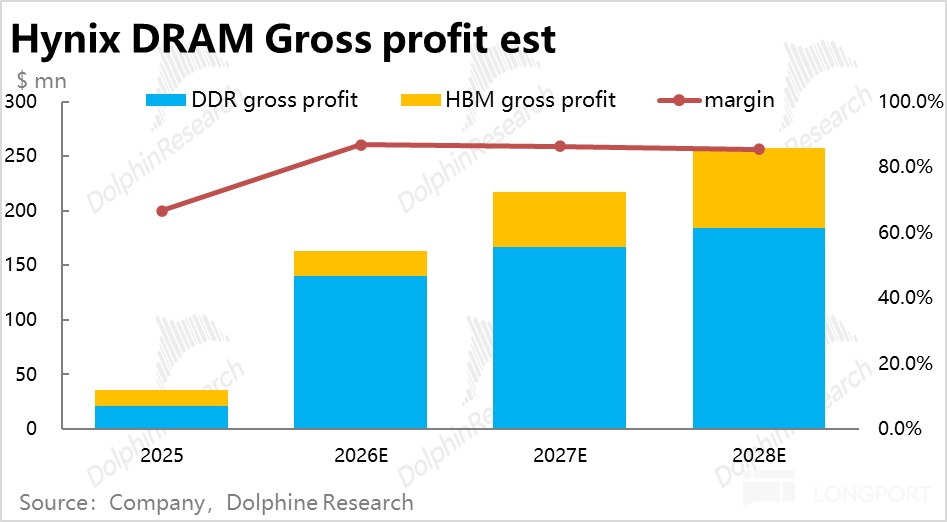
Total DRAM GP rises from $163.0 bn in 2026 to $257.5 bn with GPM ~86%–87%, over 70% contributed by DDR.
4.2 Group earnings forecast
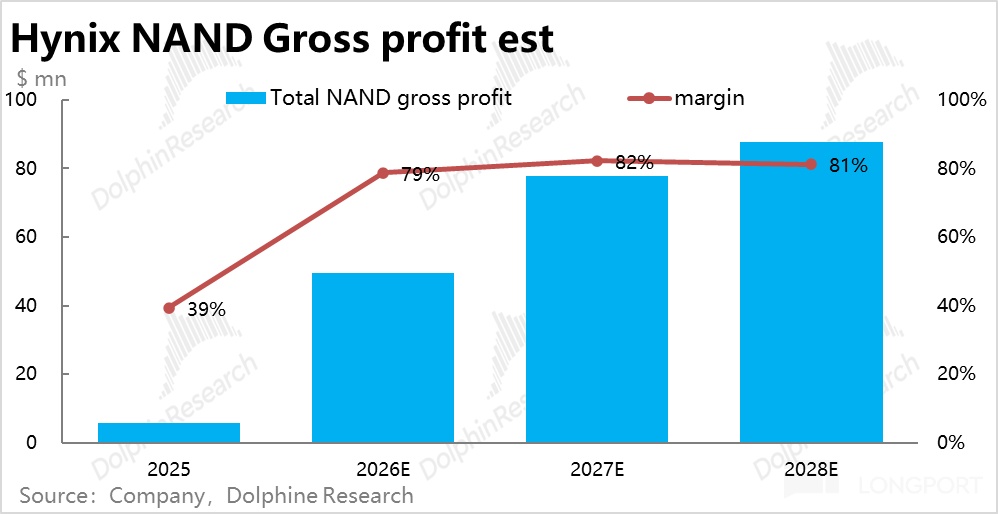
a) NAND: peak in 2027, ease in 2028. As this note focuses on DRAM and SK hynix’s NAND is about one-quarter of total, we go straight to results. Shipments grow ~16%–20% annually; ASP up ~270% in 2026, up ~30% in 2027, then down ~5% in 2028.
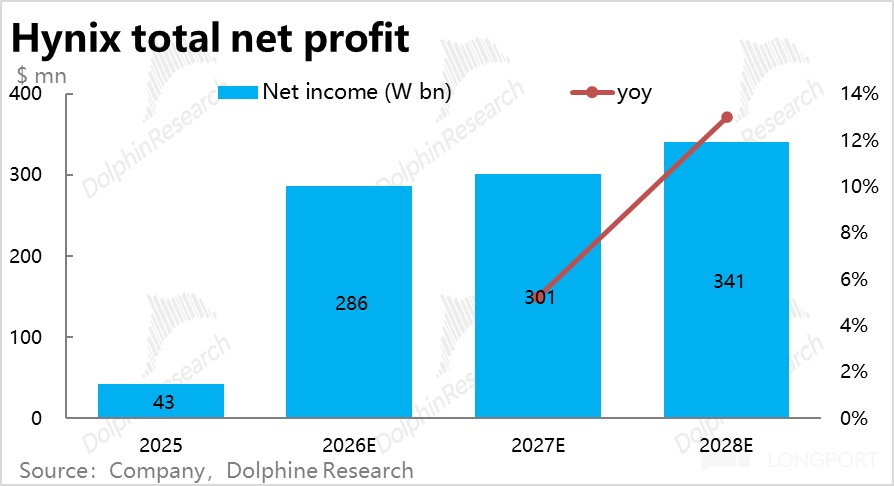
That implies NAND GP from $49.4 bn in 2026 to $87.8 bn in 2028. Summed with DRAM, group profit reaches about KRW 350 tn by 2028 (below market’s KRW 390 tn), or roughly $259.0 bn.
4.3 Valuation framework
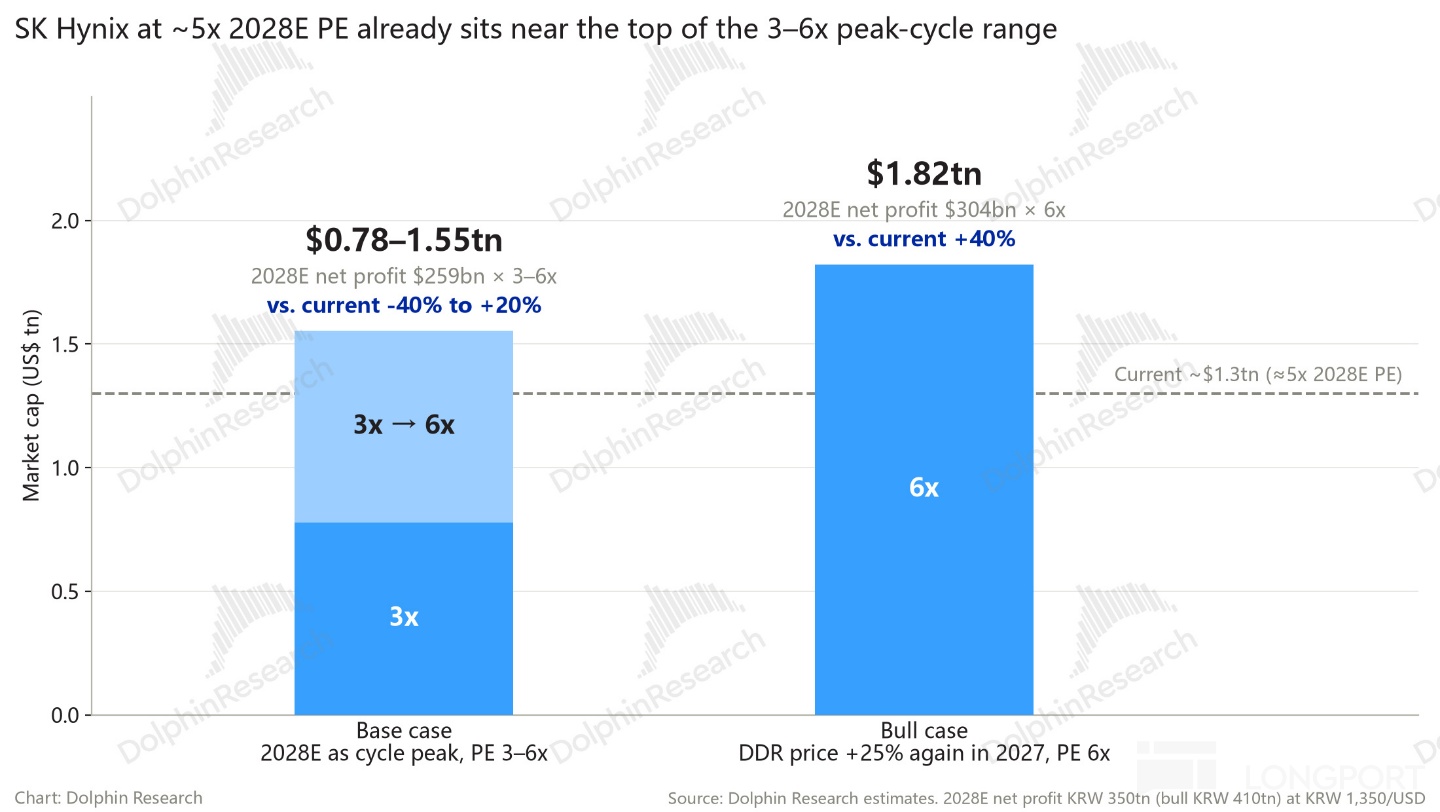
Given memory’s cyclical nature and that visibility on capacity and supply-demand runs through 2028, we take 2028 as the peak of this cycle in our base case, with no view beyond. On that basis, we forecast 2028 net profit of about $259.0 bn.
The key driver is that we expect DDR price gains to largely stall from 2027. We prefer opportunities with decent upside even under conservative assumptions. The remaining question: what peak-cycle PE should apply?
SK hynix’s current US market cap is about $1.3 tn, implying ~5x PE on our profit estimate. Historically, at memory price/earnings peaks, PE is typically ~3x–6x. That puts SK hynix near the upper end of the range today.
On this view, given current demand visibility, SK hynix’s valuation looks reasonably neutral.
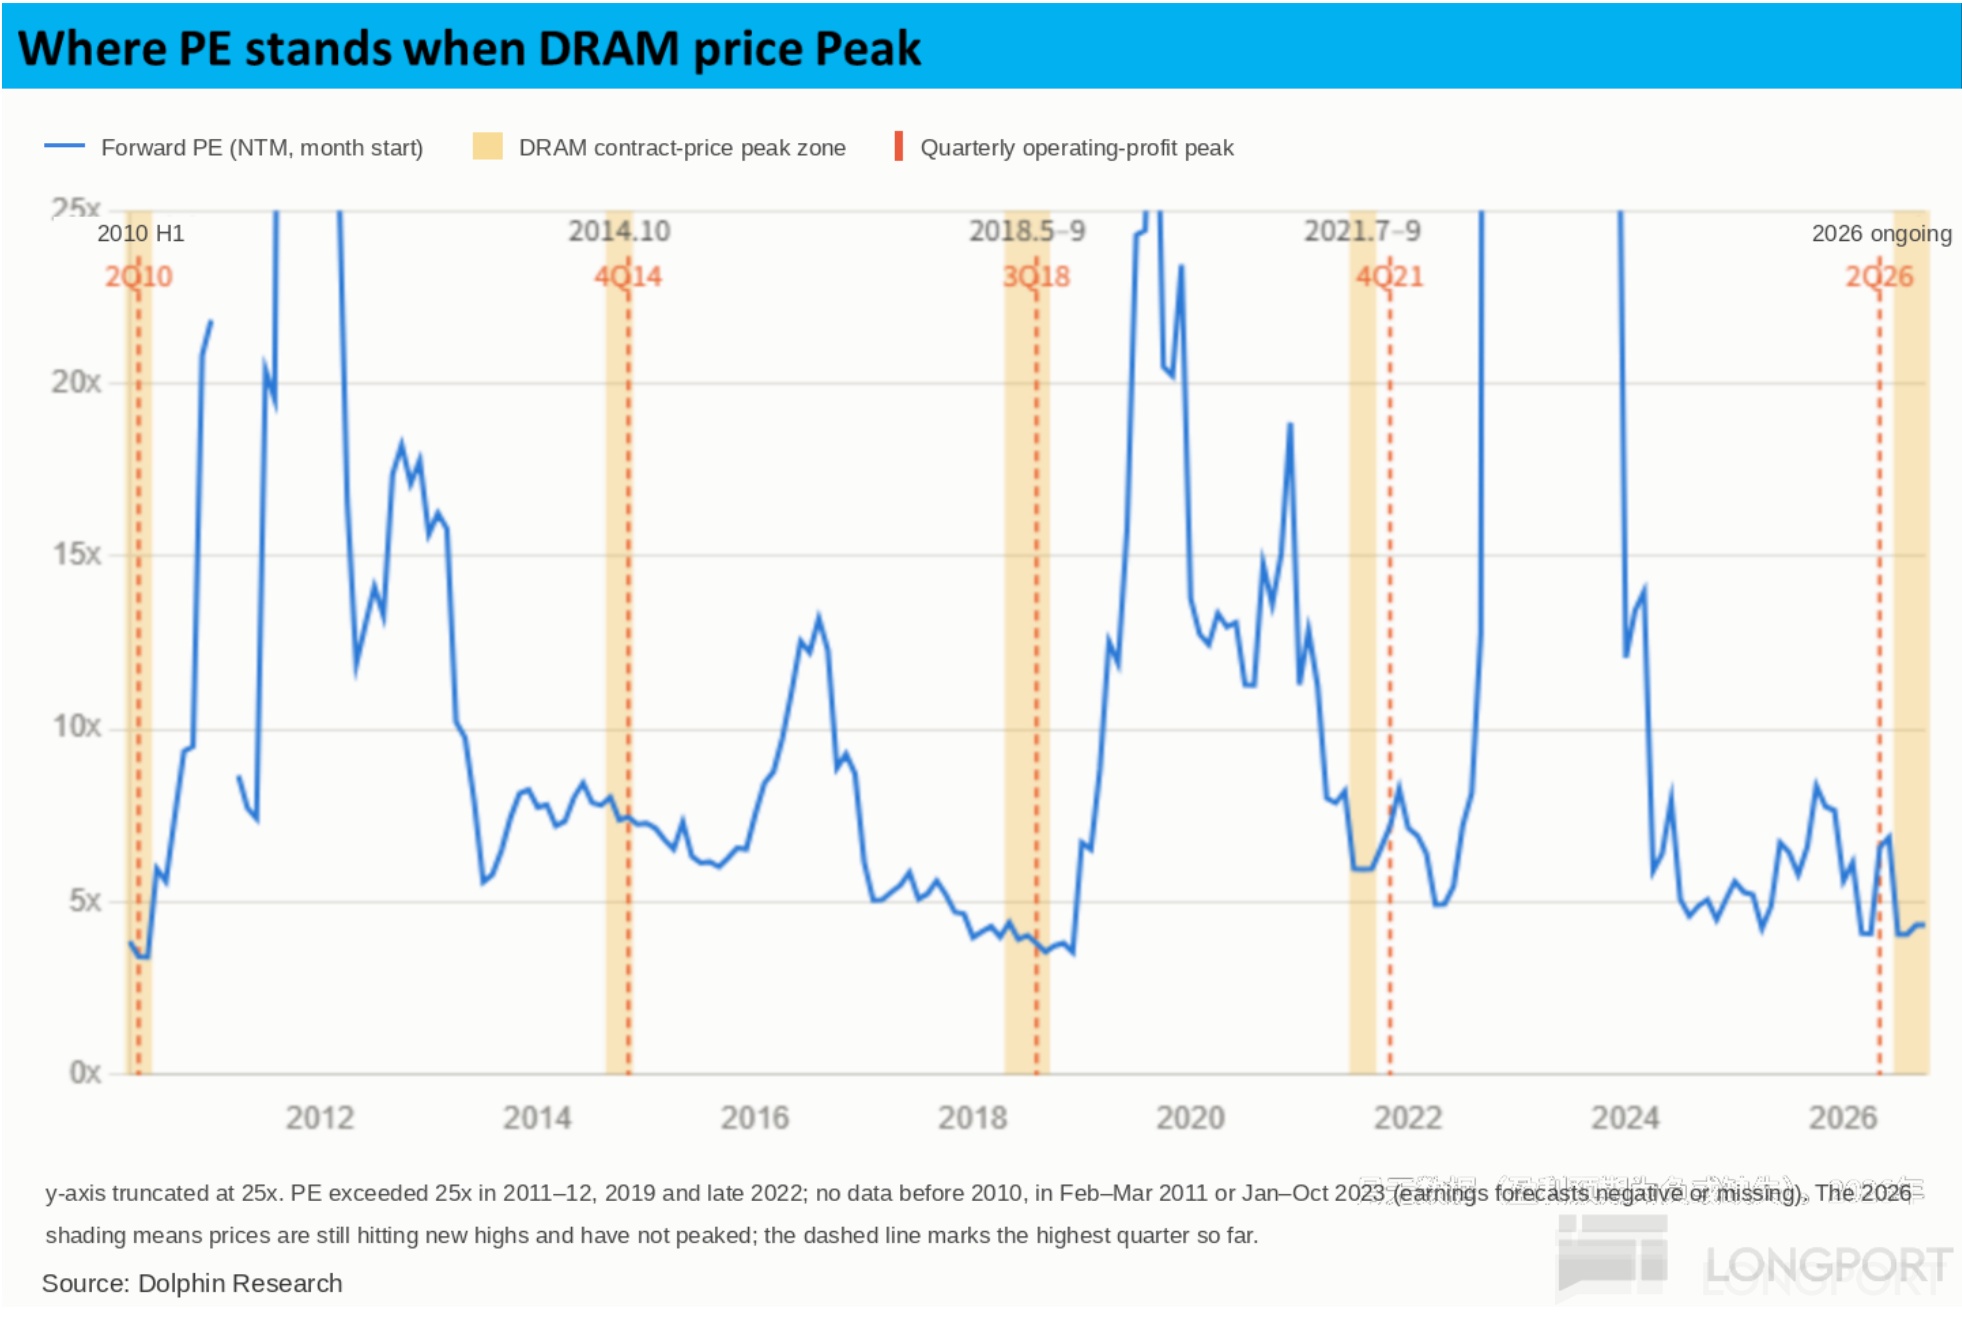
Importantly, memory capacity is broadly known and capped, so ‘surprise capacity’ is unlikely. Demand, however, is highly uncertain, and unexpected upside is not rare. The ultimate question is whether AI memory demand will undershoot sharply, or whether upside surprises emerge.
Which is more likely? Our instinct is that downside vs. current expectations is less likely, and upside surprises are more plausible.
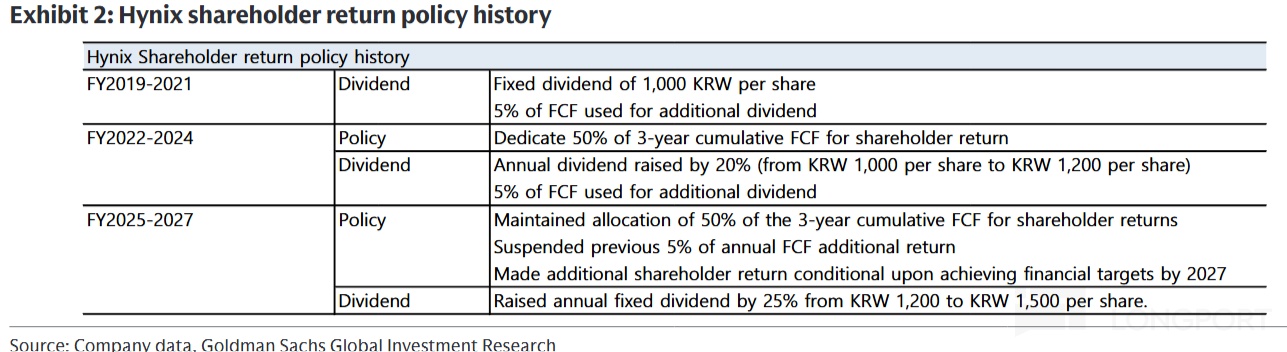
How much do dividends/buybacks matter? SK hynix has announced a generous plan to return at least 50% of 2025–27 FCF to shareholders. Under this framework, actions announced include:
a) A fixed DPS of KRW 1,500 per share each year for 2025–27, with about KRW 2.1 tn executed to date. b) A buyback and cancellation of KRW 12.2 tn in Jan, ~2.1% of then share count.
c) A KRW 40 tn buyback announced on Aug 19, ~3.3% of total shares. This is largely completed and the support to the stock is broadly realized.
On our math, paying out 55% of 2025–27 cumulative FCF returns roughly KRW 260 tn. After deducting amounts already paid, the remaining is ~KRW 206 tn, or ~12% of the current ~KRW 1,740 tn market cap. Even if the share price stays flat, by around early 2028 (once the program completes), shareholder returns could add ~12%.
From that angle, one can back into a more attractive entry. For example, if one targets ~18% return over the next 1.5 years even with a flat stock, a reasonable entry market cap would be about $0.85 tn.
Our stance: holders can stay put, with shareholder returns providing a base yield. Watch for new killer AI apps to scale, such as consumer agents or on-device AI. For non-holders, consider on a pullback toward $0.85 tn; without that, near- to mid-term upside torque looks limited and there may be better setups elsewhere.
In an optimistic case, how much upside is there? If memory stays tight — especially DDR — and we lift DDR pricing to +25% in 2027 and only mild trimming in 2028 (-3%), 2028 profit would reach KRW 410 tn. At the high end of the 6x PE peak range, that implies a $1.82 tn market cap, ~40% above today.
<End>
Dolphin Research’s past work on SK hynix:
Memory Leads Compute: Why HBM Stands Out
From HBM Limits to NAND Spec Bumps: NVIDIA vs. Memory, Who Calls the Shots
I. Dolphin Research AI Memory Series
SanDisk (Part 1): AI Inference Boom: Can SanDisk Rise from the Ashes
SanDisk (Part 2): NAND Is Born ‘Prolific’: How Can SanDisk Defend 80% GPM
SanDisk (Part 3): From Supporting Cast to Star: How AI Inference Can Rewrite NAND’s Fate
II. Dolphin Research AI DC Interconnect Series
CPO
AI Hyper-Connectivity: Racing to Light Copper Stays: CPO, Real Opportunity or Mirage
Network Architecture
NVIDIA networking: AI-Era DC Interconnect: Teaming Up Beyond a Single Chip — Any ‘China’ Opportunity
DC networking, AMD vs. NVIDIA: Is AMD Ready to Arm-Wrestle NVIDIA with Helios
Google networking: Challenging NVIDIA’s Dominance: What Powers Google’s ‘Optical Network’
Stocks
Lumentum (Part 1): From Optical Veteran to ‘All-Weather Water Seller’: Lumentum’s Edge
Lumentum (Part 2): Lumentum: Capacity Tight — What Other Tricks Does the ‘Water Seller’ Have
III. Dolphin Research AI XPU Series
Agents & CPUs: ‘Muse’ Goes Viral: Is This CPU’s ChatGPT Moment
...For more, visit the Dolphin Research site.
Risk disclosure and disclaimer: Dolphin Research disclaimer and general disclosure


The copyright of this article belongs to the original author/organization.
The views expressed herein are solely those of the author and do not reflect the stance of the platform. The content is intended for investment reference purposes only and shall not be considered as investment advice. Please contact us if you have any questions or suggestions regarding the content services provided by the platform.