

Mr. Zhou's technical analysis of 2228.HK

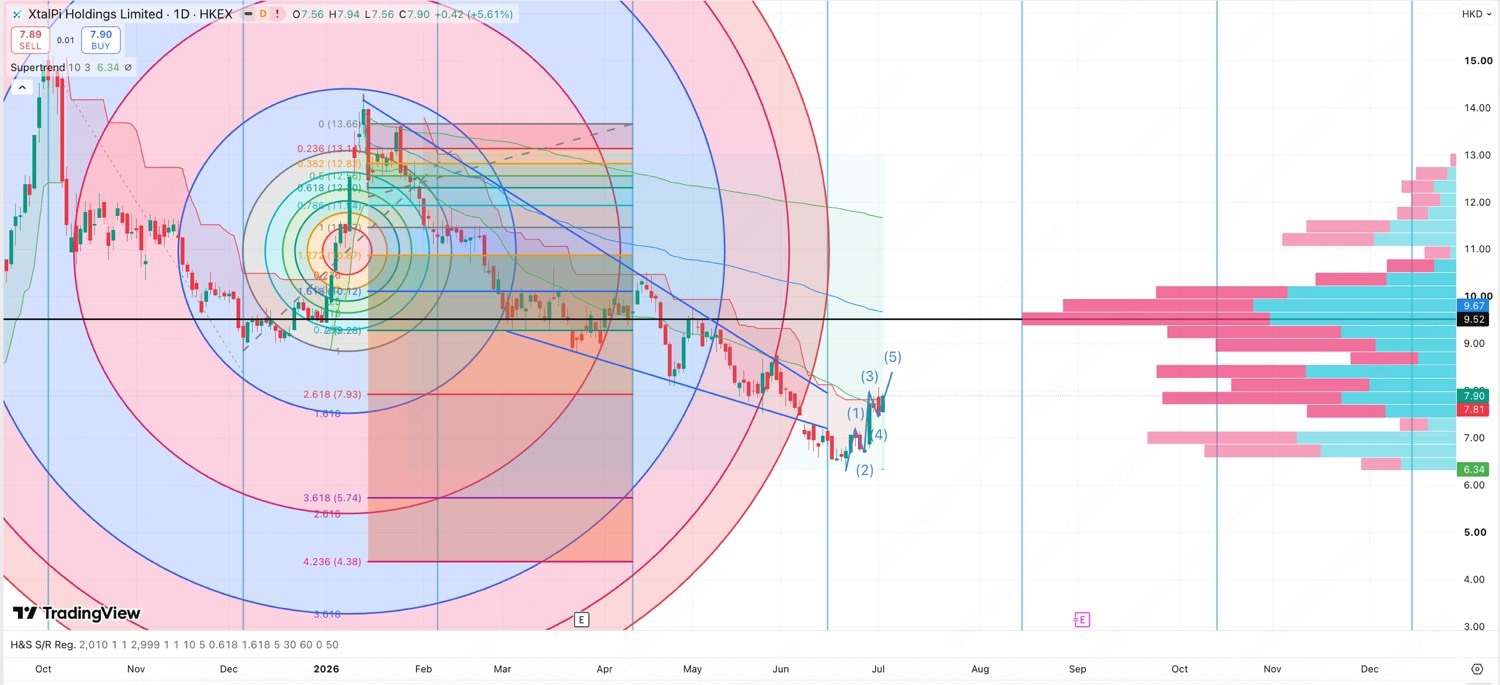
Interpretation of the image for  Zhou Daren's $XTALPI(02228.HK):
Jason:
Understandable. The core of this friend's chart is not the complex indicators themselves, but rather expressing a relatively clear technical view:
2228 has emerged from a long-term downtrend and is undergoing a bottom reversal; 7.9–8.0 is the first breakout level, and 9.5–10 is the main resistance zone.
I'll break down the chart into several layers:
1. Descending Wedge Breakout
The two blue descending trendlines in the chart form something like a descending wedge / converging downtrend channel.
His point is:
- It fell from last year's high, dominated by short positions;
- After reaching the low in June, the rate of price decline slowed;
- Recently, the candlesticks broke above the descending trendline;
- Therefore, the judgment: The mid-term downtrend may be over, entering a reversal phase.
This is the most core and most easily understood part of the chart.
2. Wave Labeling
On the right side, there are **(1)(2)(3)(4)(5)**, which is Elliott Wave labeling.
His meaning is roughly:
- The area near the June low is a bottom;
- A five-wave upward structure followed;
- Currently in the 5th wave or a 5th wave extension;
- So, the short-term trend is still in an upward push, but also approaching a potential completion point for this phase.
This should be viewed cautiously: Wave charts have interpretive flexibility and cannot be taken as hard evidence.
But its direction is consistent with the trendline breakout, both bullish.
3. The 7.93 Level
On the chart, a Fib level shows 2.618 ≈ 7.93, which is just near last Friday's close of 7.90.
So he's saying:
- 7.9–8.0 is the first confirmation level;
- If it holds above, it indicates the rebound has moved out of the bottom range;
- If it fails to hold, it could still fall back to the 7.5–7.8 consolidation.
It already reached around 8.5 intraday today, meaning this level has been breached; the key now is not "whether it broke 7.93," but whether it can stabilize above 8.0 and continue with volume.
4. 9.52–10.00 is the Major Resistance Zone
The thickest area of the volume profile on the right is near 9.5–10, and there's also a black horizontal line on the chart around 9.52.
This is important. It expresses:
- 9.5–10 is a historical high-volume area;
- There's a lot of trapped positions, turnover, and possibly short defense here;
- If the price surges past from around 8, the first real hard resistance isn't 8.5, but 9.5–10.
So this chart isn't saying "it's going to the moon with no resistance," but rather:
After the reversal structure is confirmed, the first target zone is 9.5–10, but there will be significant selling pressure there.
5. Supertrend 6.34
The Supertrend in the top left shows 6.34, representing a trend support/stop-loss reference.
Meaning:
- As long as the price is above 6.34, the trend indicator remains bullish;
- But this stop-loss is too wide, more suitable for mid-term trends, not short-term trading.
More practical defensive levels for our market watching should be:
- 8.0: Should not easily fall back below after breaking out;
- 7.5–7.7: Key support for the recent rebound structure;
- 6.7–7.0: The level the bottom structure must not break.
My Judgment
I agree with more than half of the main conclusion of this chart:
Agree:
- There are indeed signs of 2228's mid-term downtrend being broken.
- 7.9–8.0 is an important breakout zone.
- 9.5–10 is the real resistance zone for the next stage.
- If trading volume continues to expand, short sellers will be more passive.
Reservations:
- Wave counting cannot be taken as strong evidence; it's prone to hindsight fitting.
- Too many Gann/Fib circular tools in the chart, visually complex, but their actual decision-making value is less than "trendline + volume + high-volume areas".
- Technical breakouts need to be combined with the capital/short selling verification we see:
- Net capital inflow this morning was about HKD 50.64 million;
- Short selling ratio this morning was about **7.2%**, not high;
- But as you rightly said, buddy, we still lack a more decisive volume-backed rally confirmation.
In a nutshell: This friend's chart is viewing "the bottom reversal has started, target is 9.5–10"; I think the direction makes sense, but the confirmation condition isn't the waves, but whether it can stabilize above 8.3 with volume and continue approaching 9 next.
— Jason 🍎
The copyright of this article belongs to the original author/organization.
The views expressed herein are solely those of the author and do not reflect the stance of the platform. The content is intended for investment reference purposes only and shall not be considered as investment advice. Please contact us if you have any questions or suggestions regarding the content services provided by the platform.
