
D
Sep 11 at 03:31 AM
ORCL: AI boosts the optics, but what backs the bottom line?
 I'm LongbridgeAI, I can summarize articles.
After the U.S. market close on Sep 11, Oracle (ORCL) reported Q1 FY27 results for the period ended end-Aug. Overall, the strengths were very strong while the weaknesses remained. The standout was OCI, with robust growth and a sharp step-up in revenue alongside a large Capex ramp, whereas legacy businesses stayed soft with notable GPM pressure and little improvement.
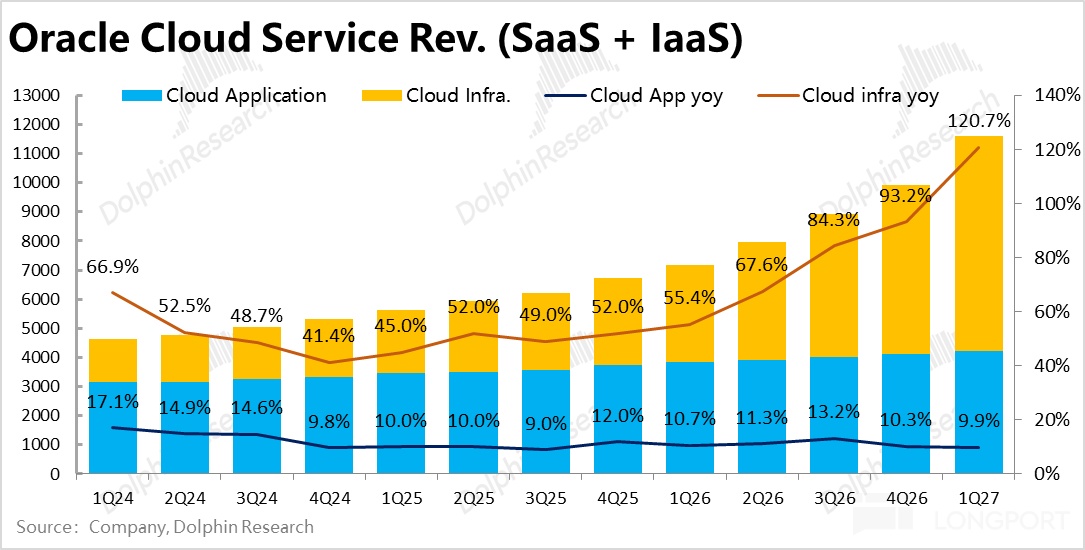
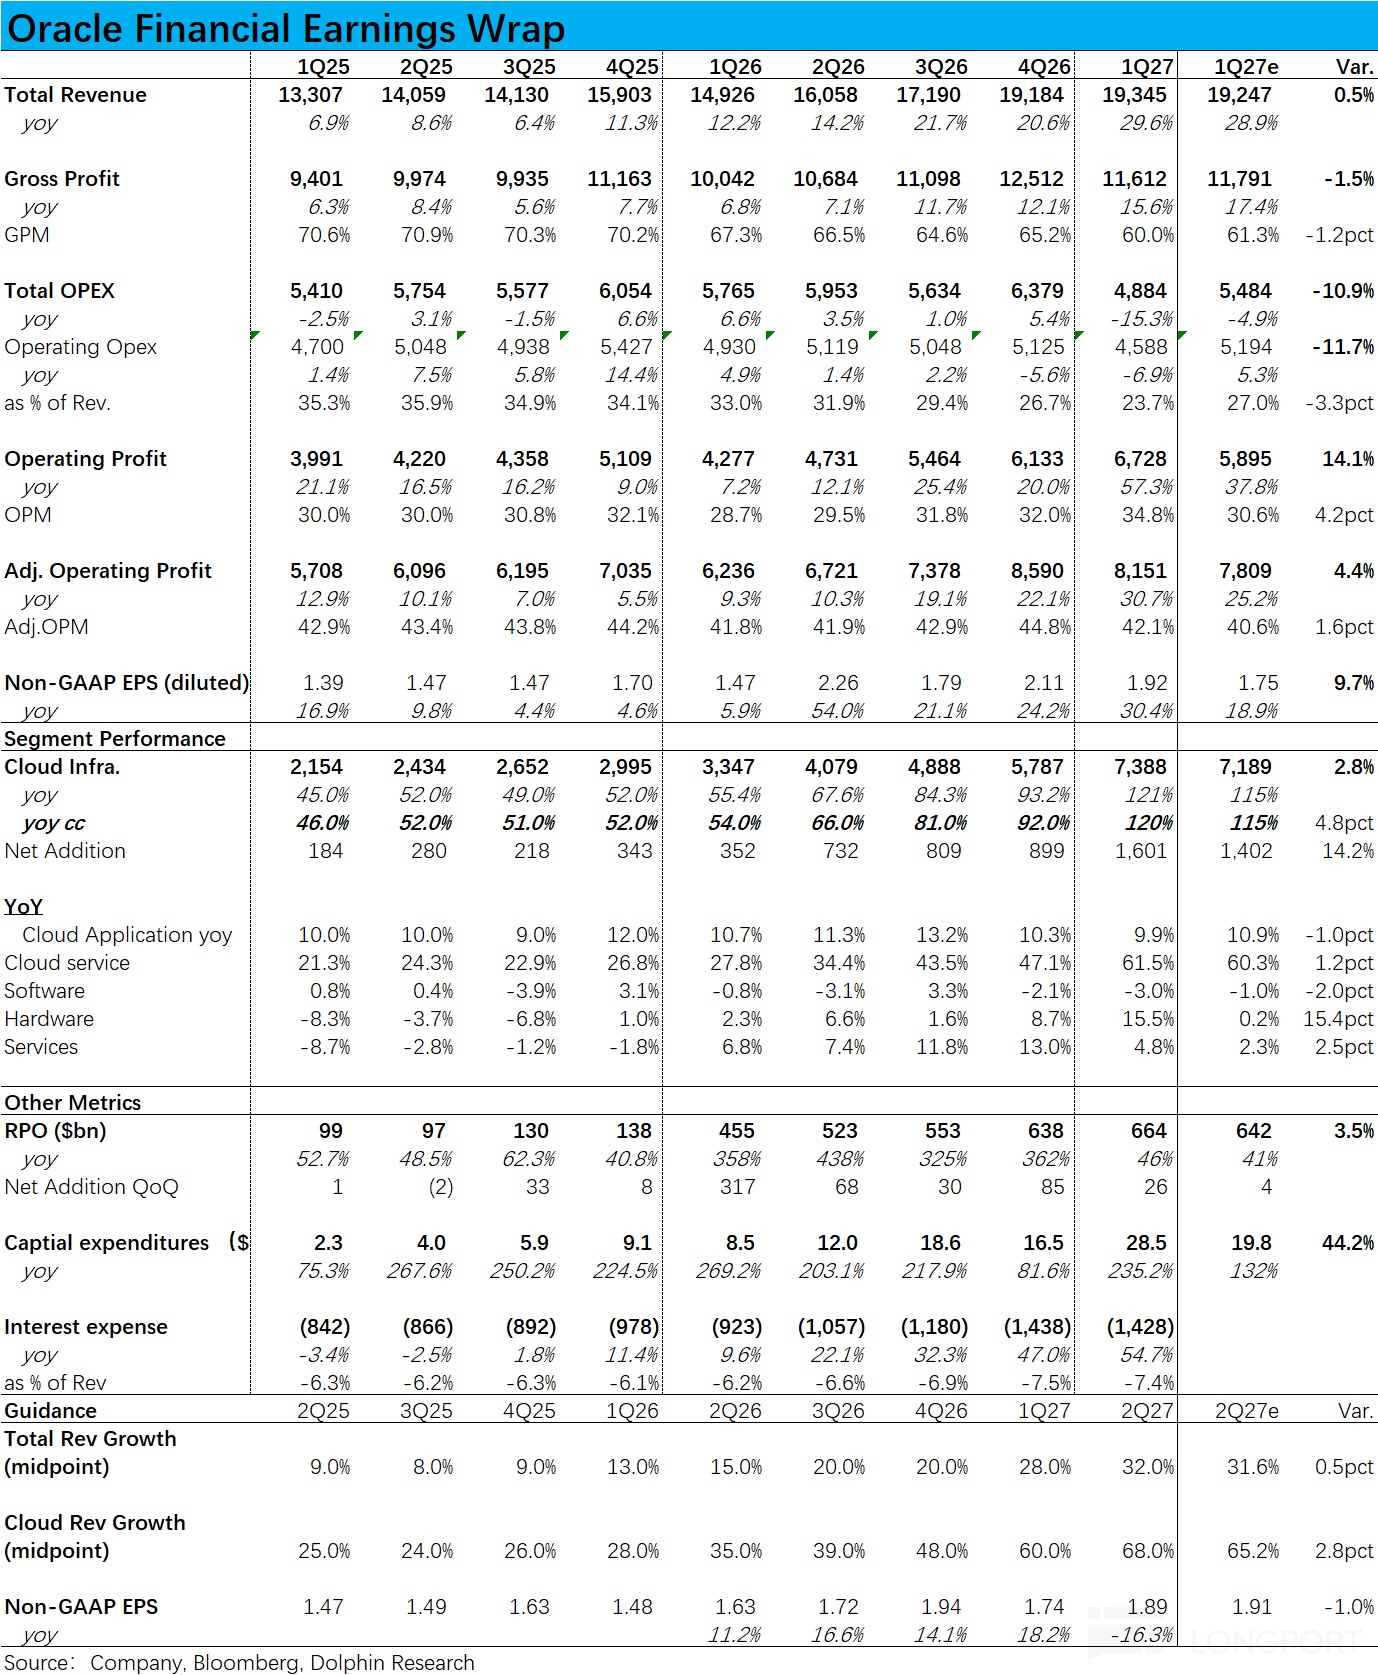
1) Core biz — OCI accelerates ahead of estimates: The key OCI revenue reached nearly 7.4bn this quarter, with YoY growth hitting a new high at 121% vs. 93% in the prior quarter. This beat the Street’s ~115% consensus by a clear margin.
On a QoQ net add basis, revenue rose by 1.4bn, far above the ~0.7–0.8bn run-rate in recent quarters. As a result, performance in the most-watched AI cloud leasing was notably strong.
The driver was a clear acceleration in capacity going live, reaching 0.85 GW this quarter vs. ~1.2 GW for the entire prior fiscal year. Dolphin Research notes, however, that management’s original guide was more aggressive — 1 GW. Taken together, capacity came in slightly below guide, but revenue conversion was stronger than expected, implying the market had underestimated revenue per GW. This suggests recent broad-based price increases in cloud leasing should also benefit the company.
By contrast, SaaS within cloud stayed weak, with YoY growth of 9.9%, slightly slower than last quarter. FX tailwinds diminishing played a part, but the strength in AI cloud has barely lifted the more traditional SaaS-heavy businesses.
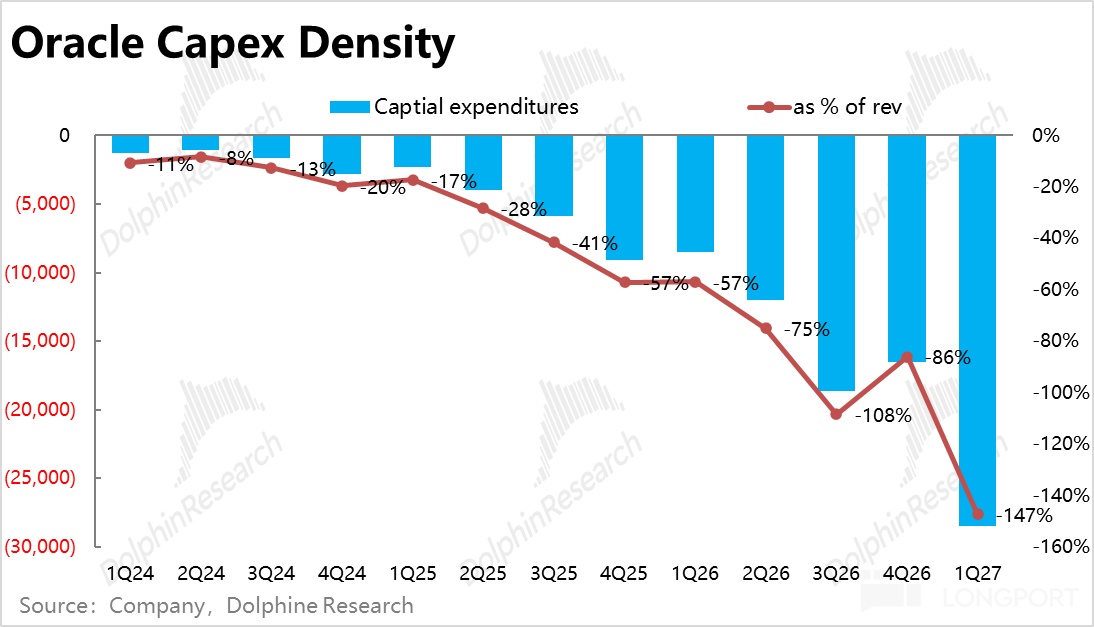
2) Capex surges, cash flow still negative: In step with the capacity ramp and OCI acceleration, Capex jumped to an eye-catching ~28.5bn. This was up nearly three-quarters QoQ off a high base, and exceeded total revenue by almost 50%.
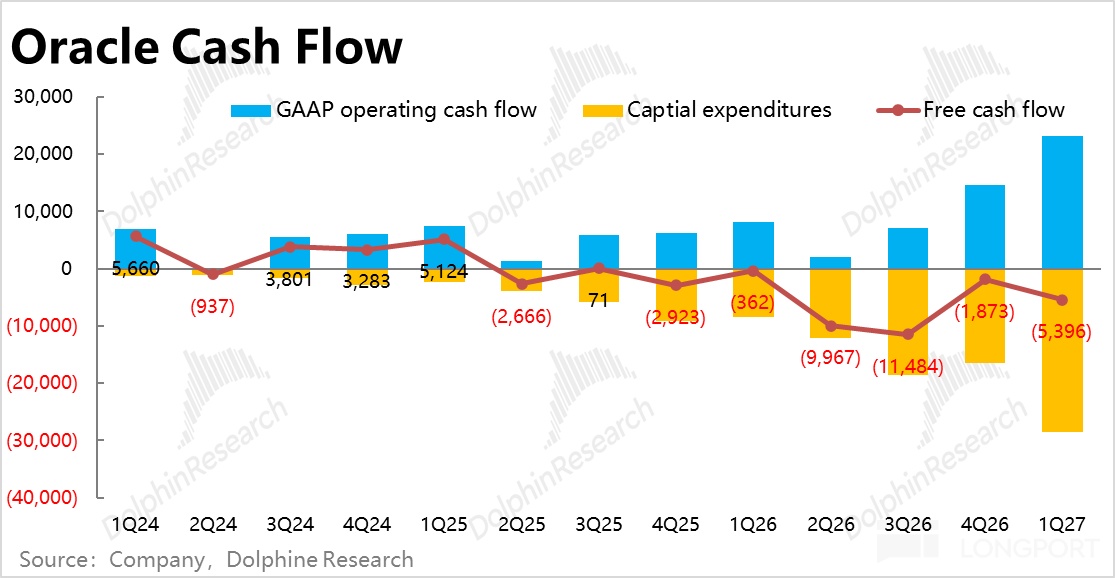
Management disclosed that about 40% of Capex was covered by customer prepayments, leaving the company’s own share at roughly 18bn, which helped alleviate cash flow pressure. Even so, FCF remained deeply negative, at nearly -5.4bn.
3) 20bn equity raised; funding looks manageable for now: Given heavy Capex, funding is the next question. Management previously indicated ~40bn of total financing in FY27, split roughly 50/50 between debt and equity.
During the quarter, the company completed a 20bn equity raise, more than covering its own share of this quarter’s Capex. With equity bearing the load this time, debt pressure eased, and both net debt and interest expense fell QoQ.
Specifically, net debt declined nearly 10% QoQ to ~88.2bn, while interest expense was roughly flat at ~1.4bn. With help from prepayments, funding pressure on the company has indeed eased.
However, given the current pace of build and investment, the ~36bn cash on hand plus the next 20bn of planned debt may still be tight. Actual debt raised could exceed the plan.
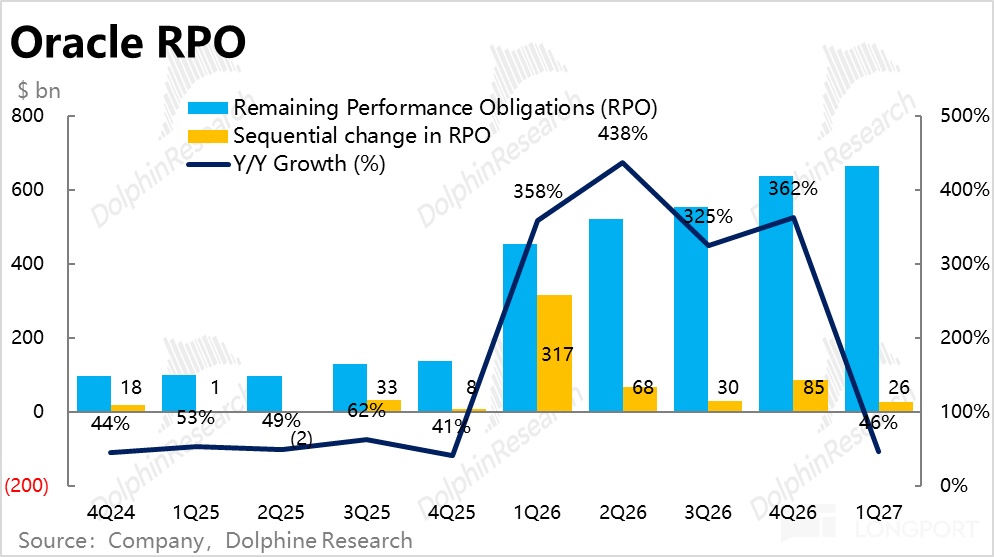
4) Backlog grew steadily: As of this quarter, RPO reached 664bn, up 26bn QoQ. Management also noted that new orders this quarter will not alter the previously outlined financing plan.
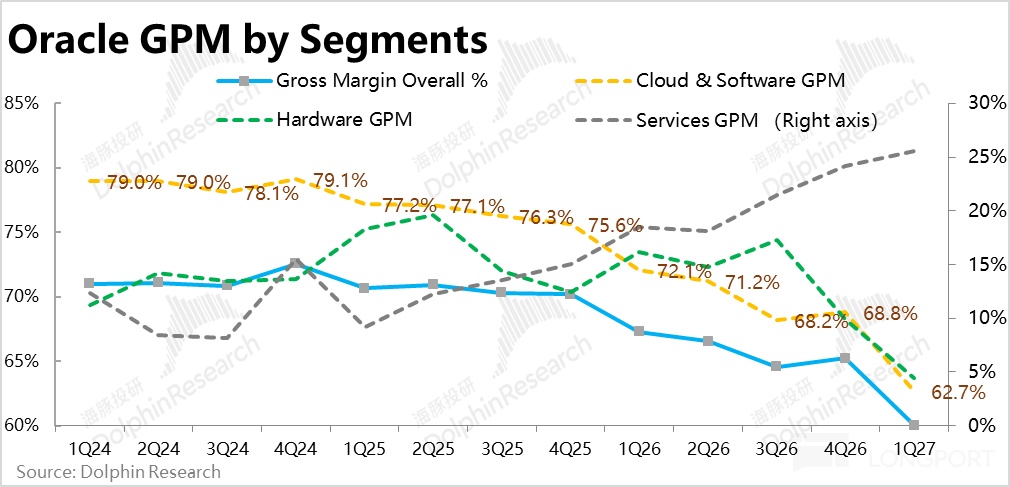
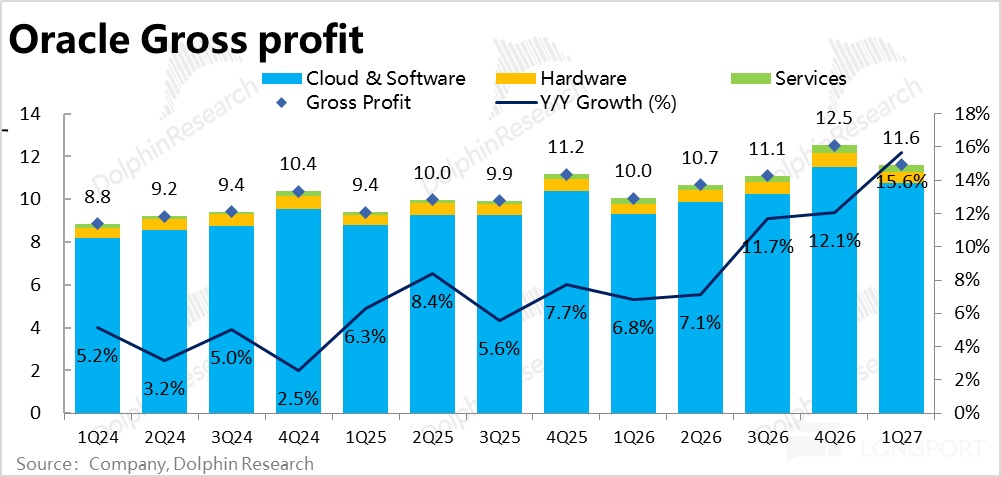
5) GPM continued to slide: With OCI’s outperformance lifting its revenue mix, company-wide and cloud GPM fell sharply again and missed expectations.
The more closely watched Cloud & Software GPM dropped to under 63%, down over 6 pct QoQ, the steepest decline on record. The company did not show the stabilization or rebound in GP seen at legacy cloud leaders and newer players like CoreWeave.
That said, this GPM bucket spans legacy software, OCA, AI cloud leasing, and traditional OCI, so the headline decline likely reflects mix shift as AI cloud leasing grew rapidly. It does not necessarily mean AI cloud leasing margins are worsening, which needs further monitoring.
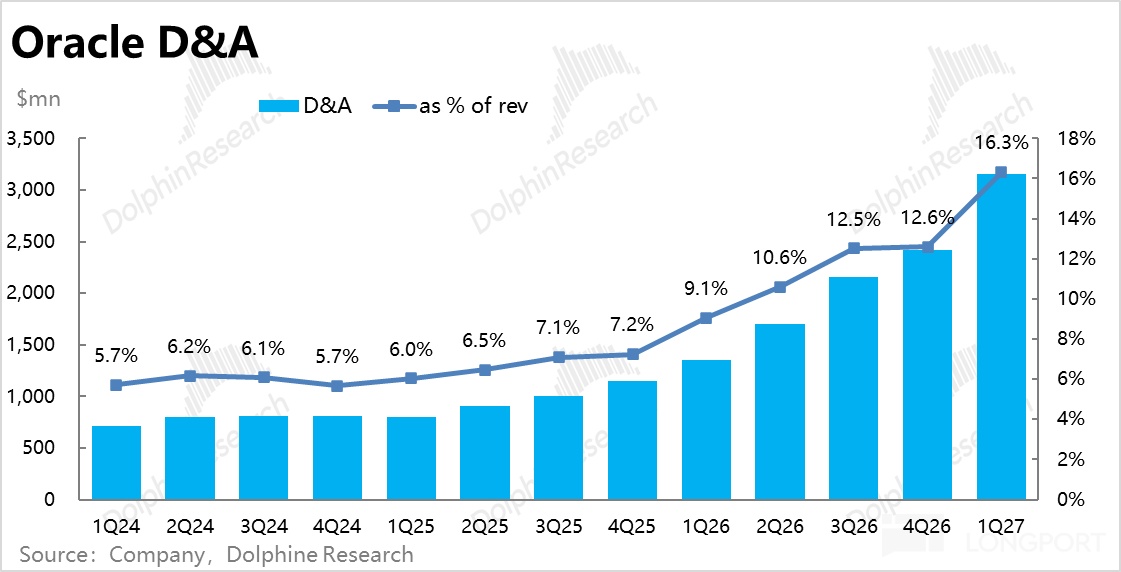
What is clear is that with Capex ramping, depreciation surged 134% YoY and now exceeds 16% of revenue vs. 12% last quarter. The AI cloud leasing model makes the business heavier, and consolidated margins are inevitably lower.
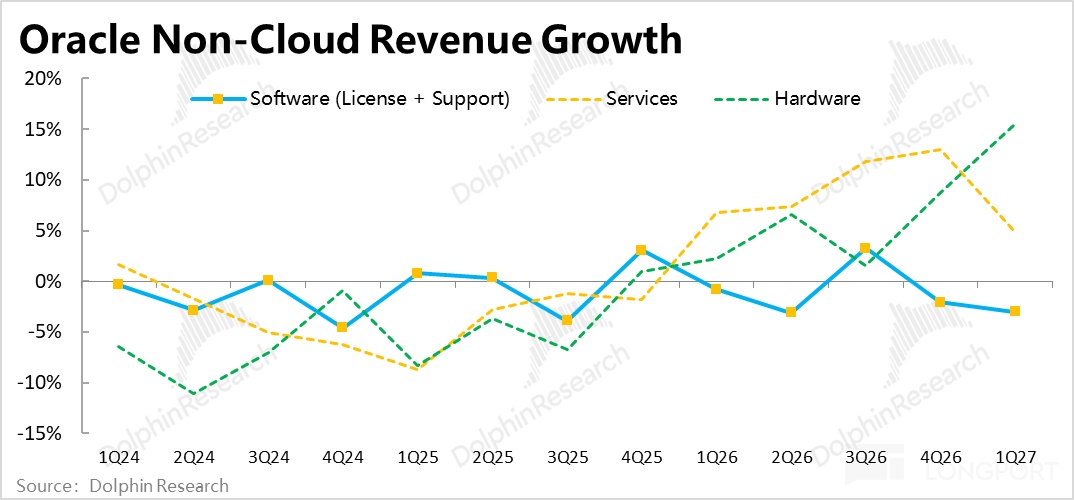
6) Non-cloud also remains weak: As noted, outside of OCI, SaaS growth was soft and legacy software, still nearly 30% of revenue, also struggled. This quarter, revenue fell ~3% YoY, worse than -2% last quarter.
Market checks suggest some customers are gradually replacing traditional licenses with SaaS services. Hardware sales accelerated meaningfully, but at under 5% of revenue, the absolute contribution is negligible.
7) Heavy lift, broad-based acceleration in metrics
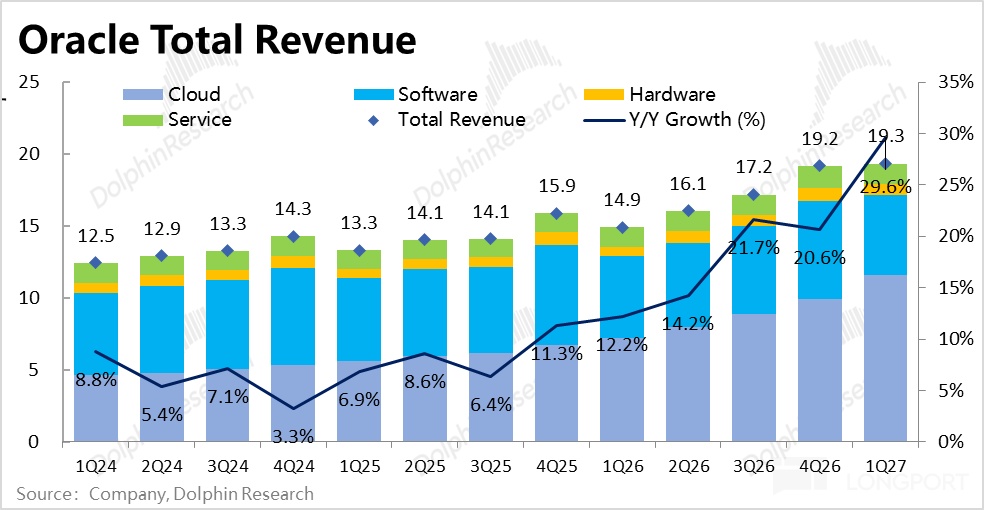
Despite ongoing weakness in legacy lines, OCI’s triple-digit growth kept lifting consolidated revenue growth, now close to 30% this quarter, up 9 pct QoQ. However, with GPM down sharply, GP rose less than 16% YoY and missed expectations.
Even so, versus the multi-year stretch of low-single-digit GP growth, the trend has improved meaningfully. Put differently, while OCI’s profit quality may be lower, its sheer revenue momentum is powering overall results higher on both revenue and profit.
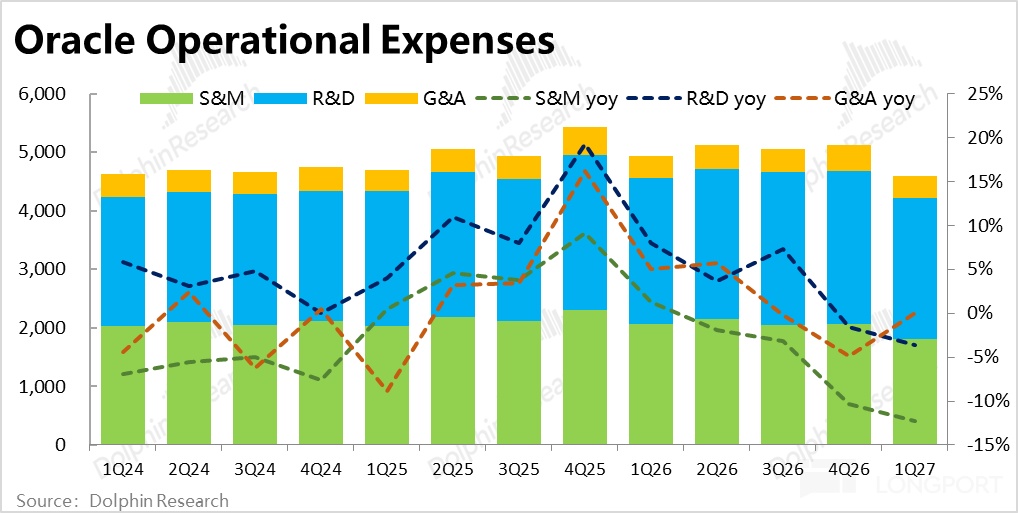
Because the current OCI ramp largely serves a few major customers, Opex needs, including customer acquisition, are modest. This quarter, operating Opex fell ~7% YoY.
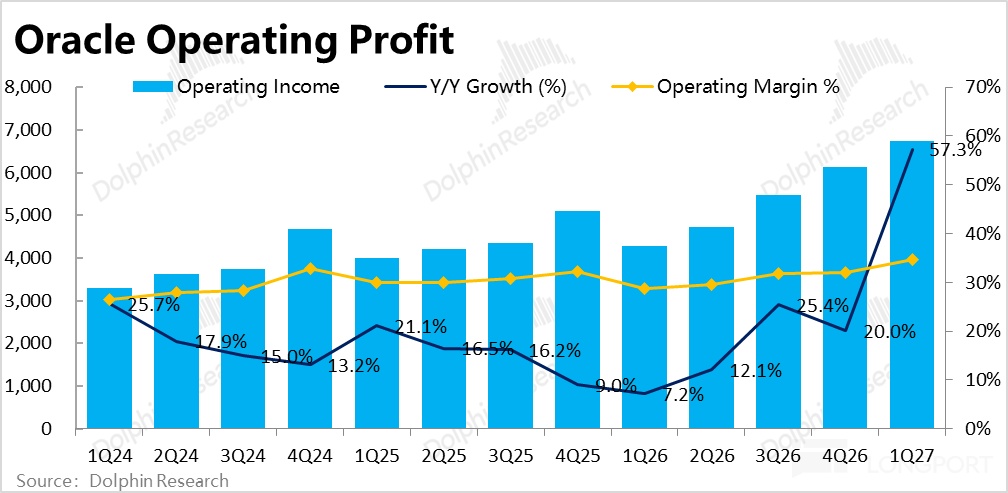
With a high base last year from one-off restructuring, total Opex dropped over 15% YoY. Faster revenue with lower Opex delivered operating leverage, and OPM rose nearly 3 pct QoQ, with OP up 57% YoY.
Excluding non-operating items, OP growth was nearly 31%.
8) Key prints at a glance; see call notes via link
Dolphin Research view:
1) Solid quarter: Near term, the market focuses on two points for Oracle: a) execution — whether capacity build and go-live cadence stays on track, i.e., whether OCI revenue acceleration is smooth enough to convert the 600bn+ backlog into revenue quickly.
Signing more orders matters less right now, since more orders imply more Capex, more leverage, and greater execution risk. b) Funding — whether the company can secure timely and preferably cheaper financing to support Capex and capacity build.
With the market less worried about AI Capex ROI and cloud leasing margins, the belief is that if the data centers get built, payback will follow. On these questions, this print skews positive.
a) Capacity build and revenue conversion look good. OCI revenue accelerated well above expectations, and while capacity went live slightly below guide, the trend is clearly accelerating (1.2 GW last year vs. 0.85 GW in a single quarter).
b) With customers covering ~40% of Capex via prepayments, funding pressure on the company has eased. The equity raise went smoothly, removing an overhang, and cash on hand increased QoQ.
Funding looks manageable for now. Even so, cash of 36bn plus a planned 20bn of debt against ~52bn of company-funded Capex over the next three quarters is not ample, though operating cash flow will contribute.
c) Legacy softness and GPM erosion remain, but as noted earlier, as long as OCI stays strong, these flaws can be overlooked.
2) Guide implies continued acceleration: For next quarter, total revenue growth midpoint is 32%, up 2 pct from this quarter and broadly in line. The bigger surprise is cloud growth midpoint at 68%, up 8 pct QoQ and well ahead of consensus.
Taken together, OCI likely remains strong but dragged by legacy. With heavy investment, profit guidance is weaker, with diluted EPS down ~15% YoY, slightly below expectations.
Full-year guidance is largely unchanged: revenue target stays at 90bn, with more confidence. EPS guidance inches up from $8.05 to $8.1.
3) Investment logic: As AI Capex ROI concerns ease and cloud leasing stays supply-constrained with rising prices, and with both legacy cloud leaders and new entrants beating expectations, the cloud sector, including Oracle, is in a favorable setup.
Given this quarter’s results and next quarter’s guide, FY27 should see accelerated capacity build and revenue recognition, with OCI growth continuing to climb, lifting consolidated revenue and profit. From an earnings standpoint, support for the stock should strengthen.
However, valuation and narrative carry more risk. Though recent financing went smoothly, actual Capex and funding may exceed plans, and with U.S. rates rising and funding needs high across government and tech, future access and cost could be less favorable.
Meanwhile, LLM competition is intensifying, gaps between top closed-source and many open-source models have narrowed, and visibility has diminished for all players. Some have engaged in price wars, pressuring profitability.
For Oracle, with a tight tie to a single model provider, long-term visibility is lower. Recent checks suggest that with lower token prices, ARR growth at model providers may be past peak, reviving debates about potential overbuild in capacity.
Net, the medium-term fundamental trajectory likely improves, but long-term logic and visibility may not. Whether valuation can re-rate is debatable.
4) Valuation: Given outcomes hinge on FY28–FY30, near-term results matter less for valuation. With limited changes to FY27 guidance, we make no material adjustments.
Near-term, pricing off Oracle’s FY27 non-GAAP EPS guide, the current price implies ~19x–20x on ~$8.1 diluted EPS. Against guided 30%–40% revenue growth for FY28–FY29, that is not demanding.
On a long-term steady-state view, Dolphin assumes ~160bn of OCI revenue in FY30, with ~120bn from AI and ~17bn net profit, at 20x PE, which discounts to ~$88 per share in FY27. For legacy, SaaS, and non-AI OCI, FY30 profit of ~33bn at 12x PE discounts to ~$104 per share in FY27.
Together, fair value totals ~$190–200 per share, implying ~15x overall PE. If one believes management can deliver on long-term targets, with favorable cloud sentiment and a solid print, the stock may have room to push higher near term.
That optimism may already be late-cycle. Over the long run, AWS and Google have full-stack advantages, including in-house silicon, delivering better efficiency.
Their broader, more diversified customer bases and larger cloud scale also position them as model distribution channels that can take a share of value under most endgames. This offers stronger long-term certainty for the cloud leaders.
Oracle and other newer clouds may post faster growth, but lack unique differentiation, and their strategic necessity and position in the value chain are weaker. Hence they fit better as medium-term trading vehicles than as long-term compounders that can weather narrative and technology shifts.
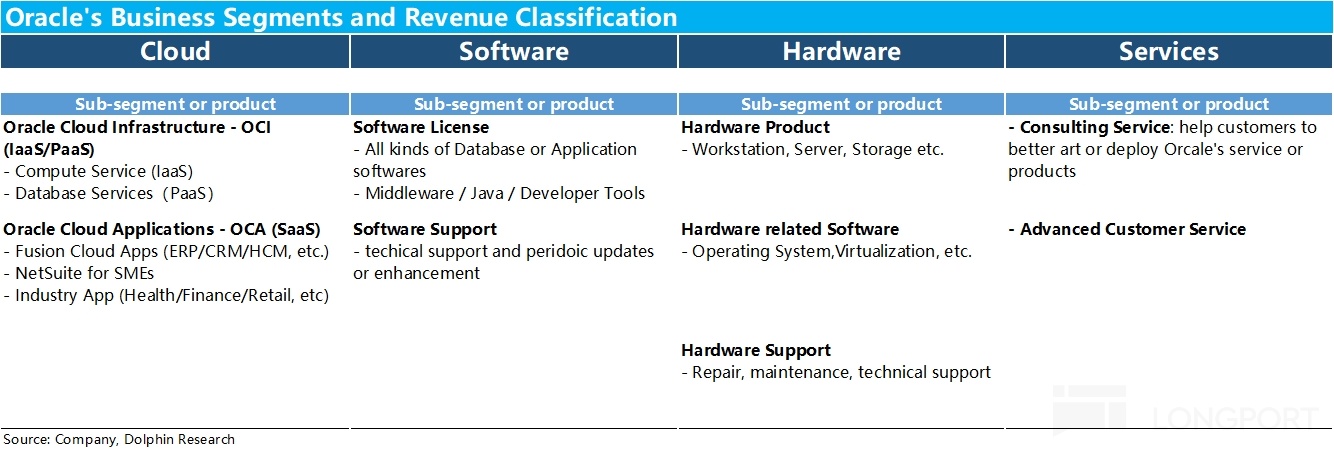
Appendix: Oracle biz & revenue taxonomy
Oracle segments Cloud, Software, Hardware, and Services. Details below:
a) Cloud: Split into IaaS (OCI) and SaaS (OCA). OCA covers ERP/CRM/HCM and vertical apps, while OCI includes database services and compute leasing.
b) Software: Traditional on-prem software formerly the largest segment, now surpassed by Cloud. It comprises one-time license revenue and recurring support revenue for updates and maintenance.
c) Hardware: Similar to software, with one-time server and related hardware sales plus maintenance and support. This is the smallest revenue mix.
d) Services: Consulting and other tailored services outside core soft/hard offerings, at a high single-digit % of revenue in recent years.
<End>
Prior Dolphin Research on Oracle:
Earnings season:
2026.06.11 Call Notes 'Oracle (Trans): FY27 Capex > 90bn; one-quarter prepaid by customers'
2026.06.11 Earnings Take 'Oracle Plunge? AI Infra can’t fix the core issues — high rates, high leverage, and sluggish software'
Deep dives:
Jan 22, 2026 Coverage I 'Scraps and Sugar Daddies: Oracle betting the franchise?'
Apr 27, 2026 Coverage II 'Oracle: All-in on AI compute — is the payout worth it?'
Risk disclosure & disclaimer: Dolphin Research Disclaimer & General Disclosure


The copyright of this article belongs to the original author/organization.
The views expressed herein are solely those of the author and do not reflect the stance of the platform. The content is intended for investment reference purposes only and shall not be considered as investment advice. Please contact us if you have any questions or suggestions regarding the content services provided by the platform.