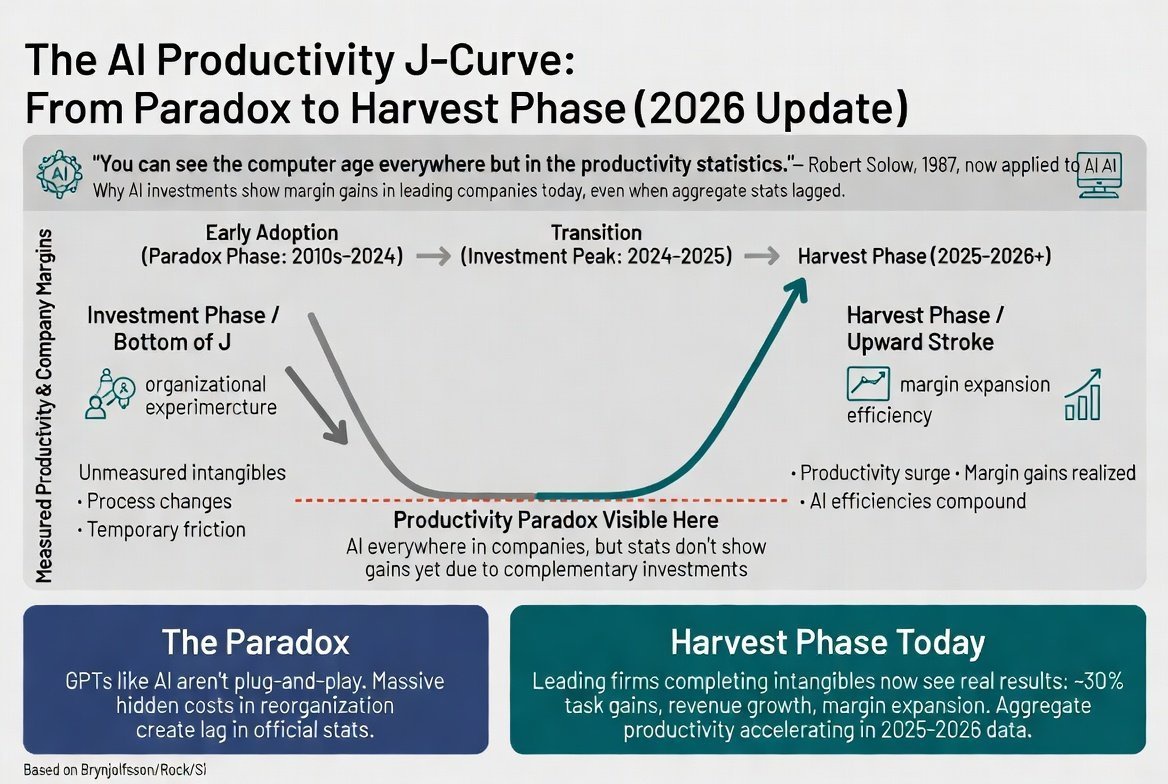
The Productivity Paradox J-Curve.
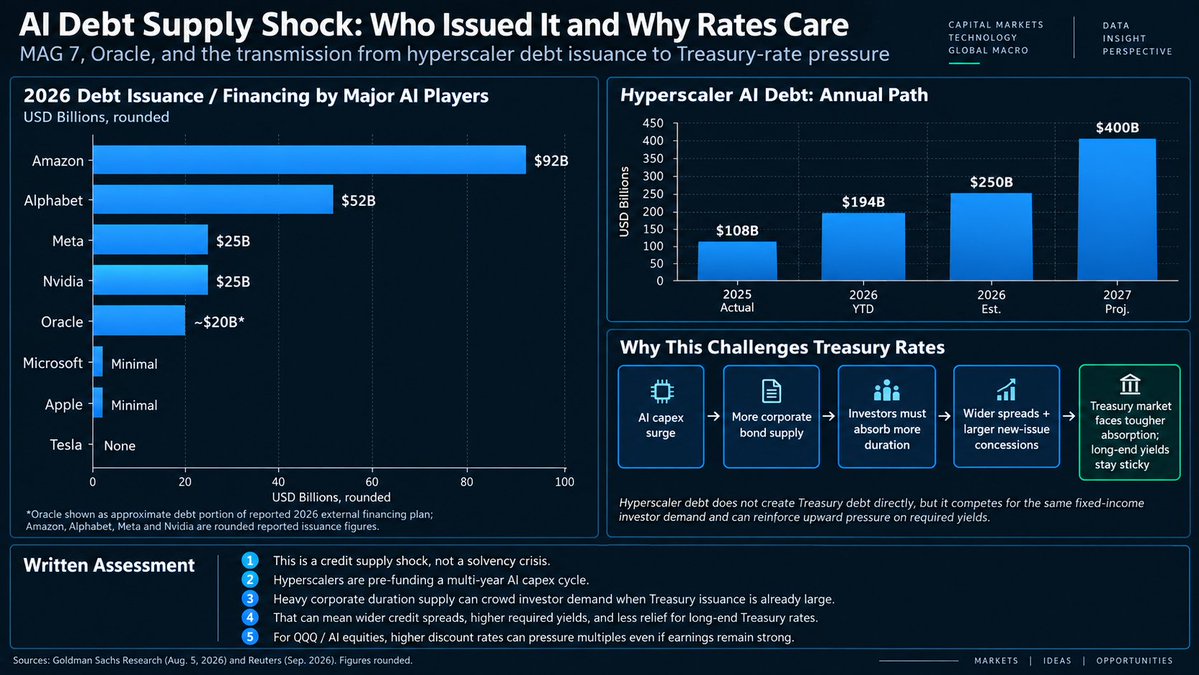
1. Invest Heavily2. Trough 3. HarvestSteam EngineElectricity CarsComputersAutonomous CarsAiAgentic AiRoboticsThe challenge near term is the debt financing until you get to Full Harvest Mode. We're close but more like 2028 max earnings gains after heavy investments continue into 2027.This Debt Offering with Yield + Credit Spread is more attractive than US Treasuries and will keep a floor on the Treasury rates elevated to stay competitive with Mag offering. No doubt yields will fall this week if the FED Raises Rates. But the floor is in to stay competitive with the Mags Debt offerings. Stocks can absorb all of this, it just might take a few weeks IMO. Several Magnificent Seven companies issued massive USD-denominated bond offerings to fund AI infrastructure and capital expenditures: * Meta Platforms: Issued a $25 billion multi-tranche bond deal featuring 30-year (2056) tranche bonds priced at a 6.30% coupon.* Amazon: Returned for multiple offerings, including a $25 billion mega-issuance with yield rates ranging from ~5.2% to 5.8% depending on the maturity (5-year to 30-year paper).* Alphabet (Google): Alongside its sterling century bond, Alphabet issued a bulk USD mega-deal with coupons set between 4.85% and 5.55% across 5- to 30-year maturities.* Apple: Tapped the USD market with smaller multi-tranche deals carrying coupons generally in the 4.50% to 5.15% range.Alphabet's last British pound bond offering in February 2026 was issued across multiple tranches, highlighted by an ultra-rare 100-year bond maturing in February 2126 with a 6.125% coupon.The full sterling offering included five tranches:* 3-year: 4.125% due 2029* 6-year: 4.625% due 2032* 15-year: 5.500% due 2041* 32-year: 5.875% due 2058* 100-year: 6.125% due 2126$400B set for 2027 in Debt Offering@zerohedge @Banana3Stocks @GroupFinom @BeardoTrader $SPY $QQQ

Jim
J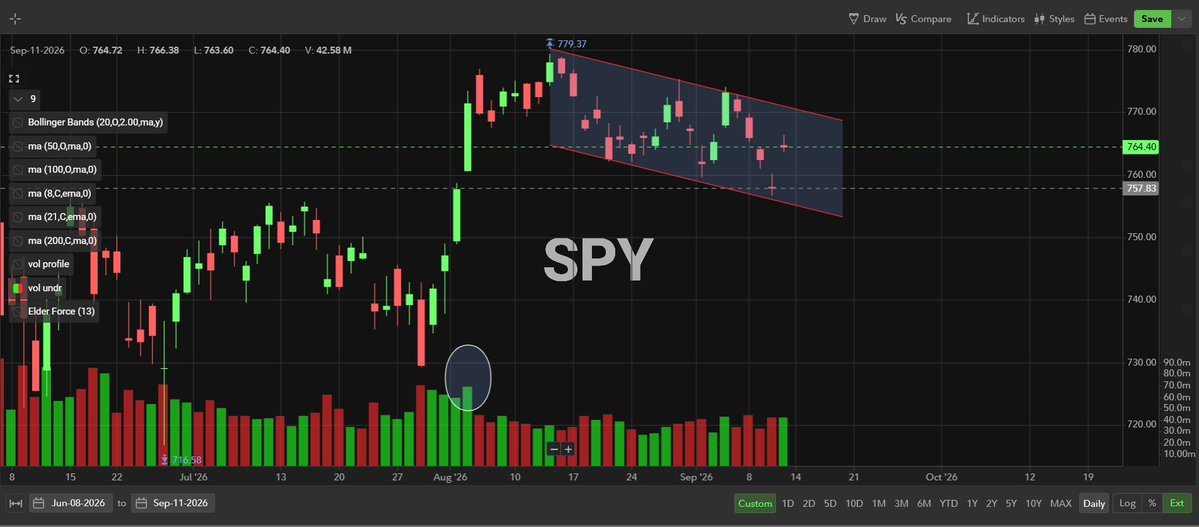
$SPY RESPECTABLE 9/11 BUT Again, the Candle did NOT Impress.
I think best I heard From Hedge Fund Manager.On a 9/11 POP we would SELL into Strength but NOT Deploy New Capital Until After FOMC and Markets Settle in to Rate Hike or Hold Decisions.That is a Fair assessment IMOJ![图片 1,共 1 张]()
The BATTLE FOR JUNE 2nd HIGH $SPY
$758 GAP FILL IS GOODNOW DEFEND OR LOSE $758SMART MONEY ON A COOL CPI PRINT WILL SELL INTO STRENGTH AND NOT DEPLOY NEW MONEY UNTIL AFTER FOMC AND GLOBAL BANK SYNCHRONIZATION.A LOT OF NEGATIVE VANNA UNDER THE HOOD.*PUTS*A MORNING 9/11 POP WON'T SURPRISE ME, JUST CAN IT HOLD ALL DAY OR FADE BY LUNCH....J![图片 1,共 1 张]()
$SMH
Got Some Late Summer Weak Knees... Ran it Up on 5x Leverage - Blow Off Top Distribution = 2-3 Months Now Price Below 8>21>50 and 50 is CURLING DOWN to $500. I like Semis, just after FOMC, After XI Visit and into Q4/Q1 as End of Year Setup Gets Better with END of Year Buying Deals Pull Ahead. True Story - My Old Bucket of $500M Spend was done with but my Peer Could Not Spend theirs by EOY DEC 31st. Boss Came to me and said can you spend an EXTRA $40M by DEC 31st? Basically Make Up the Spend for my Peer. I am like yeah, so I pulled in Q1 Gear into Q4, Made Sure it Shipped and delivered by 12/31. That is called an END of YEAR Deal. This can help Q4 into Q1 Sales Numbers for Numerous Tech Companies. Either way $SMH Got That Weak Knee Look to Me.Caution....J![图片 1,共 1 张]()
$NVIDIA(NVDA.US) The Challenge since the 10/1 Split is that this is a lotto trade for many or Call Selling Premium Trade.
Look at today's biggest trades. The Whole list except a few are Aug 28th.That's a LOW Conviction Trade.Ideally we see NOV 20th $300, or January 15th $300.But AUG 28th is Gambling Dawg cause the IV is Jacked and IV Crush is Real....
J![图片 1,共 1 张]()
At 12:26pm EST today
$NVIDIA(NVDA.US) $NVDA 2X Long ETF(NVDL.US)
king flipped from 220 long gamma at 8m exposure to 230 (now 32m) short gamma exposure. 240 long gamma could potentially be the dealer target if we get to that 230 launchpad. Before the flip, dealers were buying dips and selling rips. After the flip, dealers are no longer looking to stabilize price so if we see a run up before/after earnings, dealers will have to buy into the rally to stay delta neutral. Because of this shift I entered an NVDA lotto: 230c 8/31 @ 1.30. We either run up before earnings or we see a uno reversal compared to previous post earnings on this name.
Jensen Talks $4T AI, NVDA 4.6% From High
J![图片 1,共 3 张]()
![图片 2,共 3 张]()
![图片 3,共 3 张]()
$NVIDIA(NVDA.US) -$39M in Calls Coming Out -
Air Coming Out of the Balloon for now.+10M in PUTSThis can lead to MUTED Price Action on 8/26.$195 is a Sweet Entry IMO into January.What changed since 8/21?Interestingly, IV actually increased into earnings.8/21: 7-day IV ≈ 55.95% 8/24: 7-day IV ≈ 57.37%So the market is charging a little more for the earnings event even though $NVIDIA(NVDA.US) just dropped −2.91% today.The implied percentage move has moved only slightly, roughly 6.0% → 6.1%, but because NVDA fell from ~$215.80 to $208.48, the implied dollar move is now closer to ±$12.70.The technical setup makes those levels VERY interesting$NVIDIA(NVDA.US) 8 EMA: $216.1721 EMA: $214.5850 DMA: $207.94100 DMA: $206.97200 DMA: $195.34That creates a pretty clean earnings map:Bullish ER → ~$221Reclaims 8/21 EMAPuts $NVIDIA(NVDA.US) back above the broken short-term trendThen $225–230 becomes the next major battleBearish ER → ~$195.75Breaks 50 DMABreaks 100 DMAAnd almost perfectly lands on the 200 DMA at $195.34That coincidence is the part I would highlight.$NVIDIA(NVDA.US) EARNINGS ROADMAP$221–222 = market-priced bullish move $214–216 = reclaim zone $207–208 = 50/100 DMA battlefield NOW $195–196 = market-priced bearish move + 200 DMASo essentially, the options market is pricing NVDA's downside earnings scenario almost directly into its 200-day moving average.J![图片 1,共 1 张]()
Case of the Monday's....
$QQQ $GLDJ![图片 1,共 3 张]()
![图片 2,共 3 张]()
![图片 3,共 3 张]()
$QQQ EMA 8/21 About to Cross Over Negative
MACD Daily Already Crossed Over NegativeWilliams -94 to -99$QQQ Needs to Fill the $701 GAP at a MinimumShould Complete that action by 8/27 IMO which is BAR 21 from the Recent Swing Low.$695 Next Point of Support...NFAJ![图片 1,共 2 张]()
![图片 2,共 2 张]()
$VIX
OPEX TODAY - HEDGE UNWIND - ROLLING IMOSome monster Institutional Prints...They are smart Multi-LegsJ![图片 1,共 1 张]()
MULTI-MILLION-DOLLAR BOOK.
Today: -$90.28 (-0.01%).That’s not luck. That’s risk management.Anybody can look like a genius when everything is going up.GREAT TRADERS ARE BUILT THROUGH TOUGH TIMES.Protect capital.Control position size.Hedge when necessary.Stay disciplined.Live to trade another day.The goal isn’t to win every day.The goal is to stay in the game long enough for your Edge to compound. 💪📈J![图片 1,共 1 张]()
$VIX if you own LONG dated $VIX Calls say SEPT/OCT/DEC Never Ever Sell them on Weekly $VIX Expiration Day.
That is the near term Flush Low as VIX Calls Expire or Roll or Close out. This normally crushes VIX in the morning, maybe all day.Selling $VIX Calls is best on Friday into Weekend Fear or Monday after a Bloody Sunday in Asia Markets.Texas Two Step...J![图片 1,共 1 张]()
$SMH Could catch a small bid off Asia Overnight but to print a Red Candle on a day a lot of market gained shows some weakness.
$NVIDIA(NVDA.US) being the Unlock Key for sure, but that is 5-6 Trading Days Away.Also - if $Grayscale Bitcoin Mini Trust ETF(BTC.US) $Coinbase(COIN.US) $GLD Catch a Bid, that leaves less Retail Fomo Buying for $SMH .Still a Strong Sector, just might need Oct to March to Make a real Push.Needs to CLOSE above $593 or it's still out of favor on Wall-street IMO.J![图片 1,共 1 张]()
X -FAM $QQQ
MANAGE YOUR FEED.If you follow these Bearish Accounts who ENDLESSLY POST MARKET CRASH, FEAR SENTIMENT TRADES TO HARVEST ENGAGEMENT YOU ARE SETTING YOURSELF UP TO MISS MASSIVE RUNS.Is it smart to be tactically hedged, sure.Is it smart to POST and BOOST FEAR on X Endlessly? NOThat is how you actually MISS the best Runs Of your Generation.Curate your Feed. Mute or Block the BEARS who Spread Fear and have 1 single view of the market.They will plant a seed of Destruction in your mind that could cost you millions.The mind has a real problem letting go of Fear.Real investors, know the difference between indecision days and down days.J![图片 1,共 1 张]()
For $Hims & Hers Health(HIMS.US) earnings tonight after the bell, the cleanest near-term options estimate I’m seeing is about a ±14.4% implied earnings move for the Aug. 14 weekly expiration.
Using $31.72 spot:Implied move: ≈ ±$4.57Upside implied target: ≈ $36.29Downside implied target: ≈ $27.15The upper Bollinger Band is $36.83, basically sitting right around the bullish implied-move zone. On the downside, $27.15 lands almost directly on the 100-day MA at $27.76. 200-day MA at $29.64 would be the first major downside technical level before that.$Hims & Hers Health(HIMS.US) Earnings Map$39.05 — July swing high / breakout target$36.30–$36.85 — implied upside + upper Bollinger Band$31.72 — current price$31.33 — 50 DMA$31.10 — 21 EMA$30.76 — 8 EMA$29.64 — 200 DMA$27.15–$27.76 — implied downside + 100 DMAThe setup is pretty clean technically: $36–37 is the expected bullish landing zone; $27–28 is the bearish landing zone. A move through either side would represent an earnings move beyond what the options market is broadly pricing.
J![图片 1,共 1 张]()
$SPY — THE ROADMAP INTO JACKSON HOLE
We now have two major Follow-Through Days in 2026:April 8 → Follow-Through DayThe MACD thrust coming off the oversold lows was extremely powerful and helped launch the spring advance.August 4 → Follow-Through DayThe MACD thrust is positive again. Not quite the same explosion we saw in April, but momentum is clearly improving and the market has confirmed another rally attempt.My roadmap from here:FIB Bar 13 → August OPEXFIB Bar 21 → Jackson Hole, August 27Bars 21–34 → Jackson Hole through the September 16 FOMCThat 8/27 → 9/16 window is where I think the risk of the late-summer swoon increases.Why?We move through Labor Day, kids go back to school, summer liquidity/volume changes, and then Jackson Hole gives the Fed another opportunity to talk hawkish and scare the market. That creates a natural window for profit-taking after an August run.MY BASE CASENOW → AUGUST 27: BULLISH BIASEarnings remain supportive. If CPI, PPI and labor data stay tame, the market has room to continue running into Jackson Hole.Then I want to become more defensive.AUGUST 27 → SEPTEMBER 16: CAUTION / SUMMER SWOON WINDOWThis is where I would expect momentum to weaken, particularly if the market becomes extended going into Jackson Hole.Then comes the next major decision point:SEPTEMBER 16 FOMCAbsent a major inflation shock or geopolitical change, I do not currently see a compelling reason for the Fed to hike rates. Iran/energy remains an important wildcard because another oil shock could quickly change the inflation conversation.THE TRADEFor now, I am treating the August 4 Follow-Through Day as valid until price proves otherwise.Ride the August momentum → respect August OPEX → look to trim risk into Jackson Hole → prepare for potential weakness into the September FOMC.The market doesn't have to repeat April.It just needs to keep confirming the trend.$SPY TREND: HIGHER UNTIL PROVEN OTHERWISE.J![图片 1,共 1 张]()
$SPX MONTHLY - A LOT HAS HAPPENED SINCE THE 2022 AI BIG BANG CHAT GPT LAUNCH.
MONTHLY BAR 55 is MAY of 2027.J![图片 1,共 1 张]()
$NVIDIA(NVDA.US)
On July 29, $NVIDIA(NVDA.US) closed at $190.01 and Williams %R (14) printed −100.00. -100.00!!!!!!!!!!!!That is not merely “oversold” — under the Williams %R calculation, −100 means price closed at the very bottom of its 14-period range.$NVIDIA(NVDA.US): −100 → Momentum ReversalJuly 29Close: $190.01Williams %R: −100Extreme downside momentum / capitulationPrice testing the lower Bollinger BandNowNVDA: approximately $222Price has reclaimed the 8 EMA, 21 EMA, 50 MA and 100 MAUpper Bollinger Band has been brokenWilliams %R has ripped from −100 toward the opposite extremePrevious momentum dashboard showed −9.31MACD has turned bullishRSI moved to 61.6Money flow remains positiveThat is a full momentum regime reversal.The important lessonWilliams %R at −100 wasn't the buy signal by itself.The signal became powerful because it occurred alongside:Washout → support → moving-average reclaim → momentum reversal → breakout.And look at what happened afterward:$190 → $222+ in roughly a week.That's about a 17% underlying move.What I see nowWilliams %R moving from −100 to near −10 shouldn't automatically be interpreted as:“Overbought = SELL.”In a strong momentum reversal, an overbought Williams %R can instead indicate that buyers have seized control of the tape.The next confirmation is whether NVDA can stay pinned in the upper portion of its 14-day range while holding roughly $218–$212.That July 29 −100 print may end up being one of the cleanest momentum-reset signals of this entire $NVIDIA(NVDA.US) move.CAPITULATION: −100 → RECLAIM → BREAKOUT → MOMENTUM EXPANSION.J![图片 1,共 1 张]()
Wyckoff Summary: $QQQ
Jump Across the Creek, SOS, and Back-UpHere’s the clean way to think about the current $QQQ setup through a Wyckoff lens:1. SpringFirst, the market printed the spring at $661.14.That was the shakeout. Price briefly broke down, trapped sellers, then quickly reversed back into the range. In Wyckoff terms, that is often the final flush that clears supply before a stronger move begins.2. Jump Across the Creek (JAC)The Jump Across the Creek was the breakout move where price surged above the local resistance line with force.For QQQ, that was the August 4th move:strong wide-range up candlebreakout above the $700–$710 areareclaim of the 50-day moving averagehigher volumedemand clearly overpowering supplyThat is the market “jumping the creek.”3. Sign of Strength (SOS)The SOS is the actual proof that buyers are in control.In this case, the JAC and SOS are basically working together:strong upward spreadexpanding volumebreakout through resistancefollow-through from the prior rally attemptSo the August 4th breakout candle can be viewed as both the Jump Across the Creek and a Sign of Strength.4. Back-Up to the Creek (BU)After the breakout, Wyckoff expects price to often pull back and test the old resistance, which should now become support.That is the Back-Up to the Creek.For QQQ, that showed up as the pullback after the breakout:price came back toward the breakout zonetested the reclaimed support areavolume cooled versus the breakout sessionsellers did not fully regain controlThat is constructive. A healthy market often jumps first, then backs up to test the breakout.5. What it meansThe bullish sequence is:Spring → Jump Across the Creek → Sign of Strength → Back-Up to the Creek → MarkupThat is the roadmap bulls want.6. Key QQQ levelsHere’s how I’d frame it now:$710 = major support / creek area$720 = reclaim zone that improves momentum$723.85 = breakout / FTD reference$730 = next major upside checkpoint$700 = important danger line if support fails7. Simple bottom lineThe current idea is:JAC: buyers blasted price through resistanceSOS: the breakout showed real strength and demandBU: the pullback is the test of whether old resistance can become supportIf $QQQ holds the $710 area and reclaims $720–$724, the Wyckoff markup thesis stays alive and the path toward $730+ stays open.If $710 fails, then the backup is failing and risk rises for a move back toward $700.J![图片 1,共 1 张]()
Being that I'm a west Coast Trader, I try and read a few minutes after the opening bell power hour is over.
Taking 10 to 20 minutes before 9am to center myself is great for my trading style. Ideas come, ideas get flushed. I can center my purpose, focus and my tactics.Trading is a process over time. It's not a game of pinball. Ideas and Trades Need to Simmer before they can really develop great flavor. That takes a good time Horizon. Call it at least a Fort Night. (14 days+) Sometimes 90 to 180 Days. Daily Reminder: Focus Your Energy on Yourself, from that point of view comes great perspective.$SPY $QQQ $SPXJ![图片 1,共 1 张]()
$QQQ This FEELS LIKE SUMMER OF 2024
2024 = $NVIDIA(NVDA.US) IS ABSOLUTE FIRE FROM FEB TO JULY. (KINDA LIKE $Micron Tech(MU.US) in 2026)THEN THEY ALL DUMPED TECH ON JULY OPEX INTO OVERSOLD YEN CARRY TRADE AUGUST 5th. A.K.A AI MOMENTUM UNWIND OF 2026.THEN THEY BOUGHT AUGUST ON FIRE UNTIL DADDY FOMC HAWK TALKED AND KILLED MOMENTUM AT JACKSON HOLE 8/22 to 8/24.SEASONAL DIP INTO SEPT THEN A RELOAD INTO DEC 31st + 27% Overall. $QQQ @Norseman1 @BeardoTrader @GroupFinom @StockPatternPro Thoughts???Just looking at similar setups, would love to hear your thoughts on it.J![图片 1,共 1 张]()
$QQQ I like the Action - Just Give me Some Motherfuckin Volume and we can pres it to $750 by 9/18.
WHALES GOTTA STEP IN THIS WEEK.We want that VOLUME Candle on IRAN PEACE AGREEMENT.TOP OF BB 2.0 = $730STOCK BUYBACK BLACKOUT IS OVER FOR THE MOST PART. CORP BUYING/HEDGE FUNDS AND OTHER JUMP IN THE POOL, THE WATER IS WARM.J![图片 1,共 1 张]()
$AMD(AMD.US) Earnings Implied Move
Earnings AHOptions are pricing approximately a ±10% move tonight. Current estimates are around ±9.7% to ±10.3%.Using $518.81:Expected dollar move: approximately ±$50–$53Upper implied range: $569–$572Lower implied range: $465–$469My working range$AMD(AMD.US): $465 downside ↔ $572 upside7-day IV is near 99.4%, versus roughly 80.7% at 30 days, meaning the earnings premium is heavily concentrated in the front end.Key takeaway: A move inside roughly ±10% is “expected” and could still produce major IV crush. A move above $572 or below $465 would represent a genuine options-market surprise.J![图片 1,共 2 张]()
![图片 2,共 2 张]()
NO $MAGS NO BAGS.....
Well, Here Comes Papa.....The Old WallStreet Players are Fed UP with Korean High BETA NIGHTLY MEMORY SWINGS. They want the Old Ghost Phantom Rolls Royce to take them to the Ball....Peep The Action.....1. Bottom Test2. Spring3. Jump Across the Creek (Today 8/3)4. Follow Through Day (Larger Volume Candle) 1%+ Gain, More Volume then the Day Before5. Now we wait for "Back Up to the Creek" to Reload and Test into Higher ATH's.p.s. Money Flow is positive now....$MAGS $NVIDIA(NVDA.US) $Microsoft(MSFT.US) $Amazon(AMZN.US) $Meta Platforms(META.US) $Apple(AAPL.US) $Alphabet(GOOGL.US) $QQQJ![图片 1,共 2 张]()
![图片 2,共 2 张]()
$SpaceX(SPCX.US) Dead Money -
Earnings Tomorrow After the bell, could weigh on $QQQ as they fall to $100.Problem: Data Centers in SpaceProblem: Endless Supply of SharesProblem: LockUp Ending For Some - Selling Continues.Under $100 Kinda Interested, at $80 I am a Buyer with 2 Year Leaps, Maybe 3 Year.They need until 2030 to REALLY Smash IMO30% Shares are SHORT Right NowPrice BELOW 8 EMA and Money Flow NegativeNFA@StockPatternPro