

METAM

Nebius: New cloud 'Magic Pill' — gold or bubble?
 I'm LongbridgeAI, I can summarize articles.
Dolphin Research previously covered Oracle and $Coreweave(CRWV.US) (CRWV), two emerging 'neo cloud' giants. This time we turn to the so-called 'demon seed' of the neo cloud cohort — $Nebius(NBIS.US) (NBIS).
On scale, NBIS is a lightweight: 2024 revenue was only about $90 mn (ex-Toloka, which was spun off), less than 1/20 of CRWV. Even by 2027E revenue, NBIS is still under half of CRWV.
On market cap, NBIS has since pulled ahead: when CRWV listed in Mar 2025, NBIS was under one-third its size and, by early Jun, briefly fell to under one-eighth. Yet within a year, NBIS overtook CRWV in Jun 2026 and, as of the Oct 26 close, sits around $42 bn, nearly 40% above CRWV.
The valuation gap is even starker: NBIS trades at ~3.5x its 2027E revenue vs. CRWV at ~1.1x. For the same dollar of revenue, the market is willing to pay roughly 3x for NBIS.
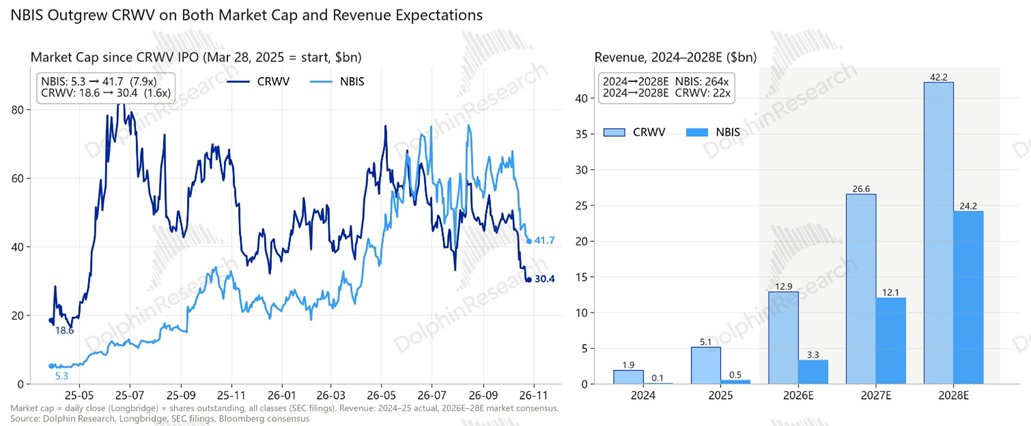
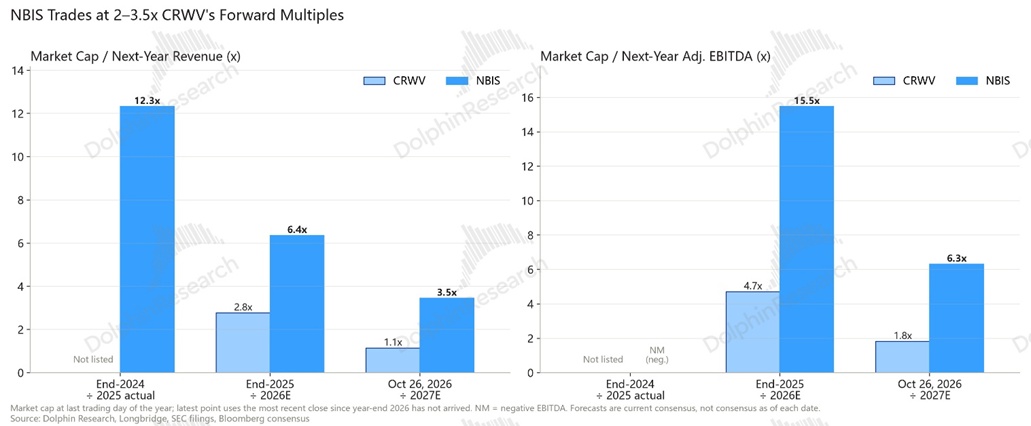
Smaller revenue base, lower margins, yet a much richer valuation — what exactly is the market paying NBIS for? This article breaks it down:
1) How do the founding teams, histories, and depth of ties with NVIDIA differ?
2) Both are 'neo cloud', but are their biz. models, growth outlooks, and visibility the same?
3) CRWV appears to have higher margins — why does NBIS get the premium?
4) Compute and capex: who is scaling faster? Who secured the DCs and power?
5) The base layer: which has the stronger financing structure, capacity, and balance sheet?
6) What is NBIS actually worth?
Details below:
I. Different origins, converging paths
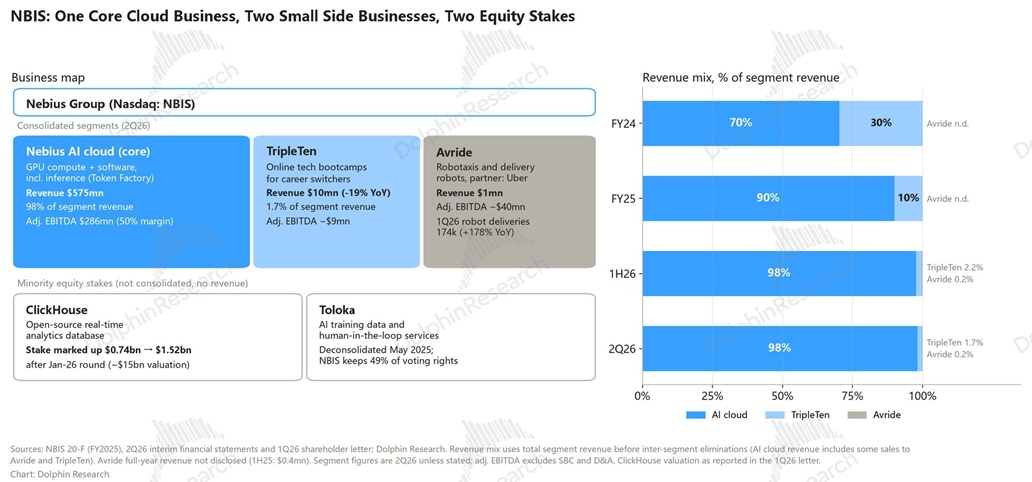
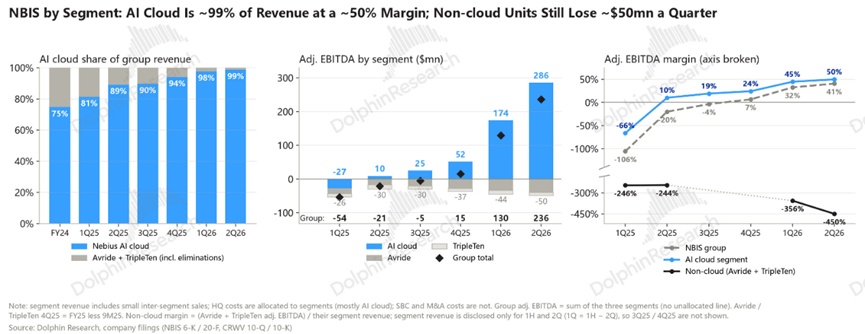
NBIS can be summed up as 'one core biz., two side bets, two equity stakes'. The core is the AI cloud (Nebius AI Cloud): renting GPU compute with software like the inference platform Token Factory. In 2Q26, AI cloud revenue was $575 mn, contributing 98% of total revenue and all of the profit.
The side bets are Avride (autonomous driving) and TripleTen (online vocational training), both still loss-making: a) Avride spans driverless cars and sidewalk delivery robots, primarily deployed via an Uber partnership. Volumes are growing fast, but quarterly revenue is only about $1 mn, with 2Q26 adj. EBITDA loss of roughly $40 mn.
b. TripleTen offers online tech upskilling for career switchers and is adding more AI content. It posted 2Q26 revenue of $10 mn with a loss of about $9 mn.
NBIS also holds minority stakes in two businesses — the open-source real-time analytics DB ClickHouse and AI training data firm Toloka. Both were spun off and are no longer consolidated, impacting net income only via investment gains.
On mix, non-cloud still accounted for about 30% of 2024 revenue. As AI cloud scaled rapidly, its revenue share rose to around 90% from 2Q25 and hit 98% by 2Q26, making NBIS effectively a 'pure-play' cloud company.
1.1 Management: different roots, similar outcomes
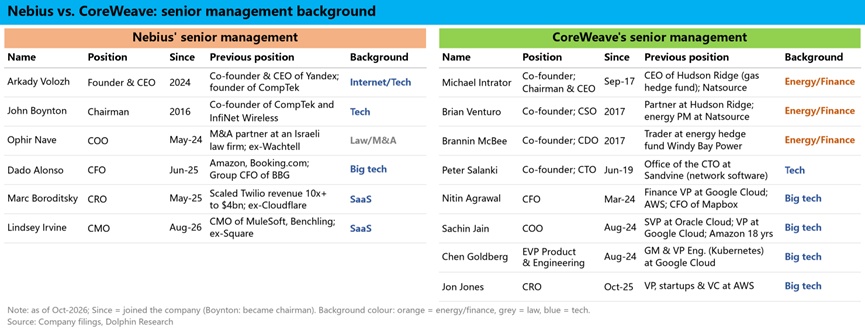
Bottom line: they started almost opposites, but post-IPO each plugged gaps, and their expansion playbooks and management builds now largely converge. The company or leadership pedigree is not the key driver of their valuation gap.
At inception, CRWV was founded by three energy traders who started in crypto mining, skilled at securing power and financing — a 'business-first, capabilities-later' path.
NBIS spun out of Russia's tech giant Yandex; CEO Volozh, a Yandex co-founder, relaunched with 1,000+ engineers and a full cloud tech stack — a 'capabilities-first, business-later' approach.
On expansion, NBIS is effectively replaying CRWV: land an anchor mega-customer → bring in a big-tech CFO → lever contracts to raise financing → align with NVIDIA → lock GW-level power. The lag is shrinking fast, from ~26 months at the Microsoft win to about six weeks at the Meta win and NVIDIA's equity entry.
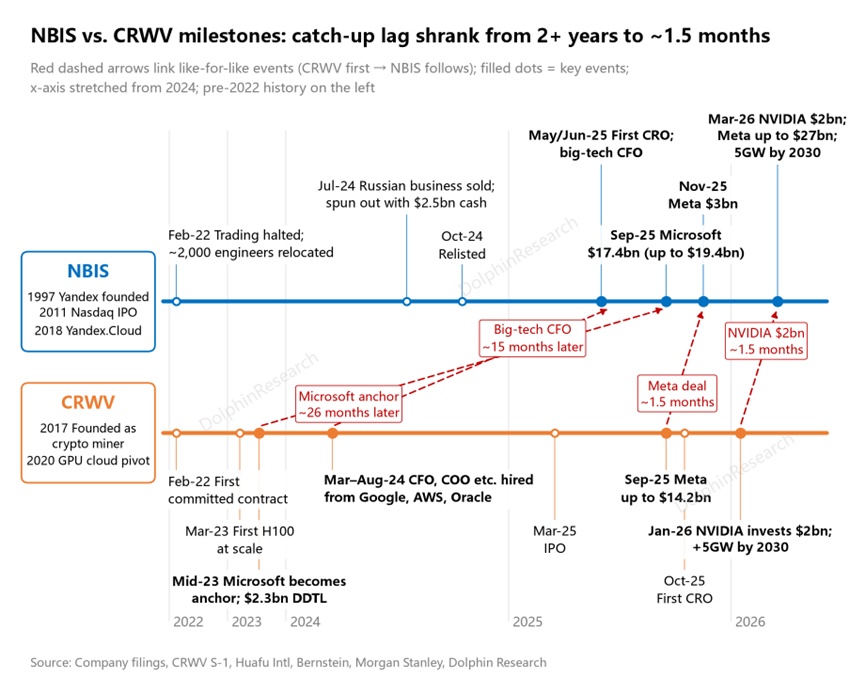
On leadership, both filled gaps: in 2024, a year pre-IPO, CRWV brought in a CFO, COO, and product/engineering leads from Google Cloud, AWS, and Oracle to bolster cloud capability.
NBIS lacked commercialization and capital markets experience; since 2025 it hired a CFO from Amazon and a CRO and CMO from Twilio and MuleSoft.
Today both have similar professional manager benches, with primary differences at the founder level.
1.2 With NVIDIA: both took investment, CRWV is more tightly bound
This year NVIDIA invested about $2 bn in each, with similar stakes, but timing and depth of business linkage differ meaningfully.
CRWV is effectively NVIDIA's 'prime affiliate', arguably an off-balance-sheet exposure. NVIDIA was an early shareholder; operationally the ties are multi-layered:
a) NVIDIA is CRWV's key supplier; it also rents compute from CRWV as a customer and has committed to take unsold capacity, providing revenue backstop.
b) Since this year, NVIDIA has used its own balance sheet to help CRWV accelerate land, power, and DC access. CRWV is NVIDIA's spearhead to pry open the cloud incumbents' club.
NBIS looks more like a later-stage 'bet'. NVIDIA previously made small follow-ons, then this year invested at scale via pre-funded warrants.
Collaboration centers on technology — priority supply on new platforms, AI factory design, inference software, and fleet monitoring. Technically, treatment is similar, but the business and financing linkage is shallower.
1.3 The valuation gap is smaller than it looks
Before the side-by-side, strip out the 'water' in the top-line valuation gap: over 60% of the apparent ~3x spread comes from capital structure differences.
CRWV scaled via debt: at the Oct 26 close, equity accounted for only about half its EV (market cap ~$30.4 bn, net debt ~$28.4 bn). NBIS has net cash, with EV around $45 bn, slightly above market cap, factoring NVIDIA warrants and in-the-money converts (~$9.6 bn), then netting cash and equity investments (~$6.3 bn).
On EV/revenue using 2027E, NBIS is ~3.7x vs. CRWV at ~2.2x, narrowing the gap from ~3x to ~1.7x.
II. Revenue outlook: CRWV more defensive, NBIS more elastic
Two revenue questions matter most: growth — who has greater upside elasticity; and visibility — who has higher forward coverage and lower downside risk.
Bottom line: two different models with pros and cons mirror-imaged.
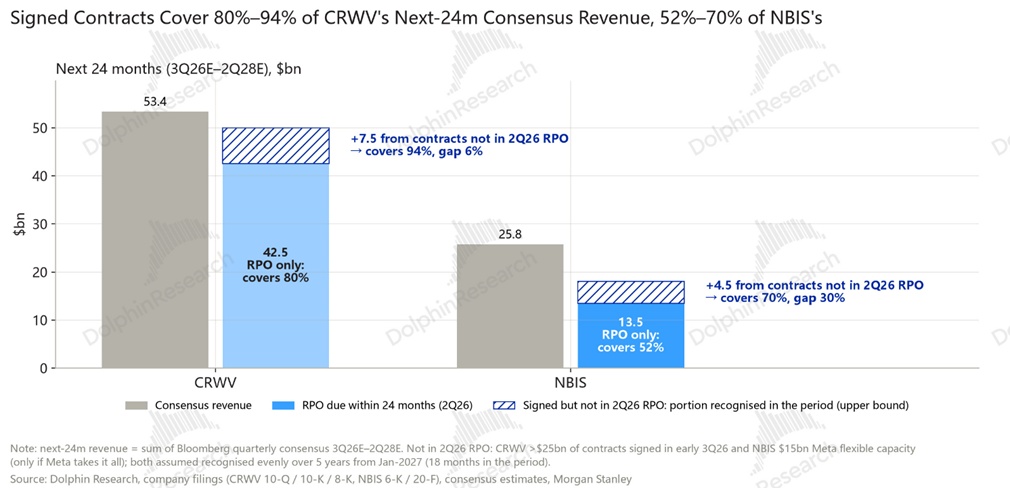
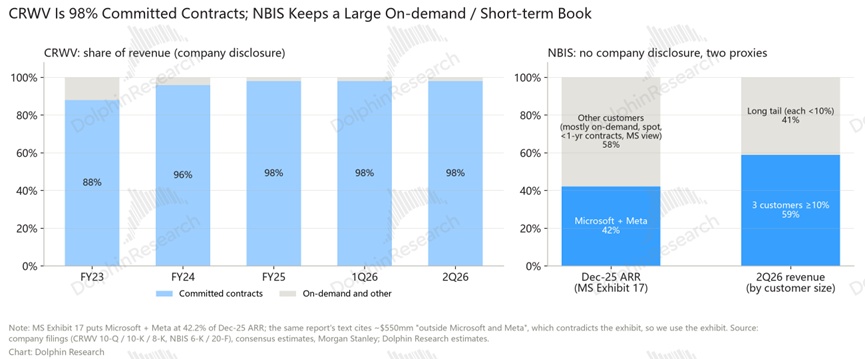
CRWV relies on take-or-pay LT contracts and resembles 'managed DC operations' for a few large customers. Usage and price are largely locked at signing, with around 80% of expected revenue over the next two years covered by RPO. Downcycle risk sits more with customers, but bargaining power is weaker and upside is capped.
NBIS skews to on-demand and short-term deals with a more diversified customer base, akin to a traditional cloud platform: aggregating broad demand and pricing independently, it enjoys greater elasticity in ARPU, revenue, and margin when supply is tight. But RPO covers only about half of expected revenue over the next two years, leaving NBIS to shoulder more upside and downside; if supply/demand flips, there is less LT protection.
2.1 Backlog: CRWV has higher revenue visibility
On relative growth, NBIS is much faster; on absolute size, CRWV is still larger. Even on QoQ dollar adds, CRWV is about 2.8x NBIS.
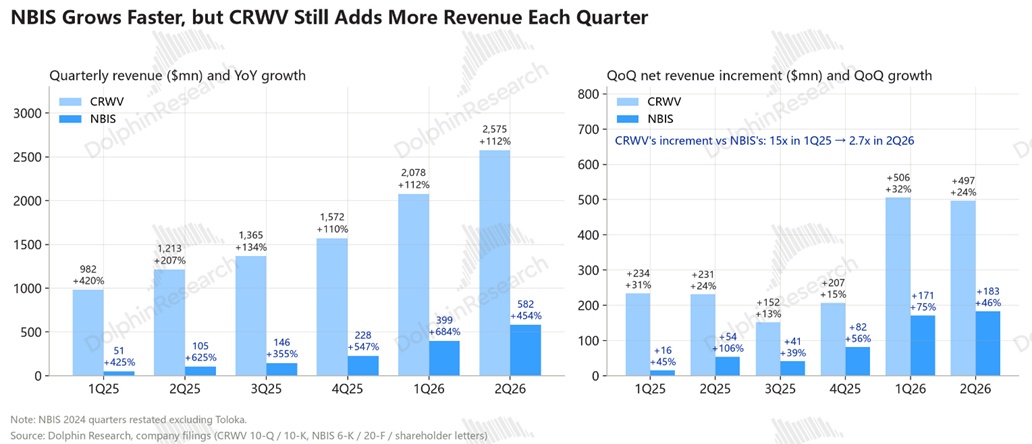
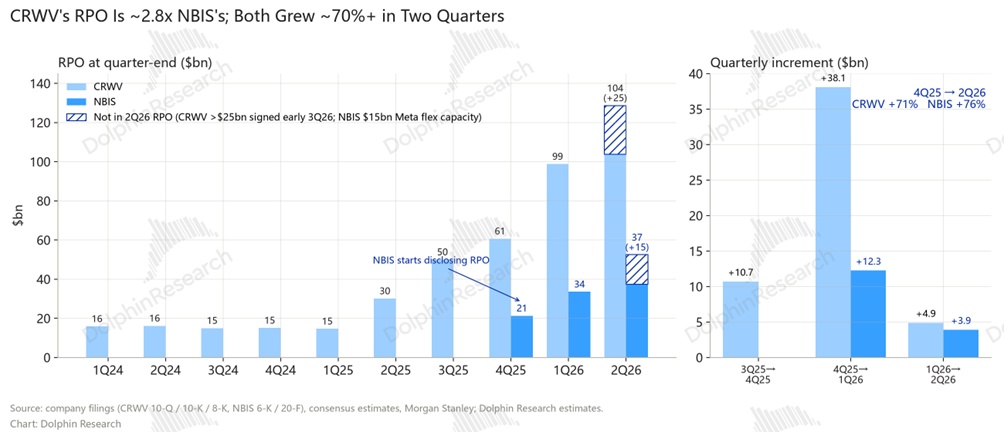
More importantly, look ahead: future revenue depends on RPO (remaining performance obligations). CRWV is clearly ahead here:
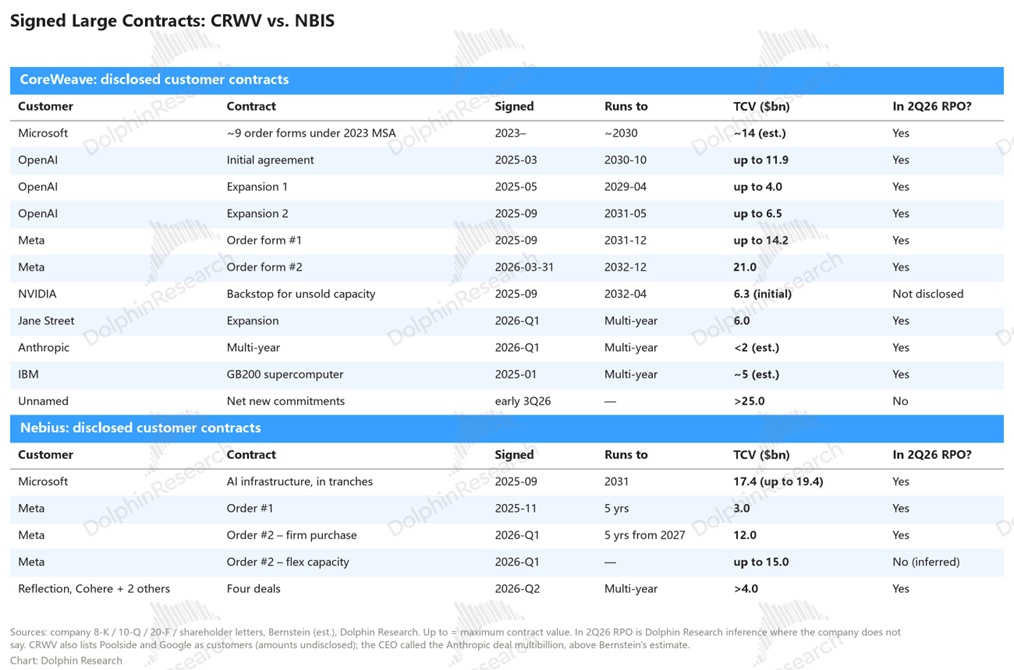
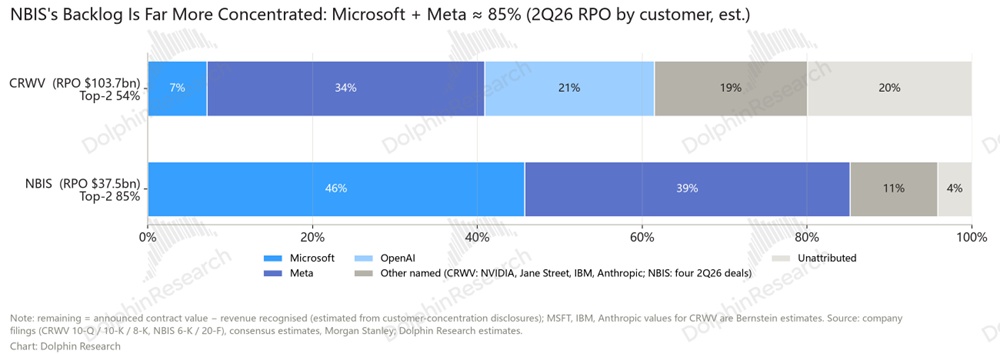
NBIS's RPO is about one-third of CRWV's and roughly 85% concentrated in Microsoft and Meta. CRWV's top two (Meta and OpenAI) account for about 54% combined.
As of 2Q26, CRWV's RPO was $103.7 bn vs. NBIS at $37.5 bn. About 80% of CRWV's next 24 months expected revenue is covered by RPO, while NBIS is around 52%.
In part, NBIS is choosing to leave large capacity for free pricing to capitalize on today's strong market.
2.3 Contracted vs. on-demand: two models with mirrored trade-offs
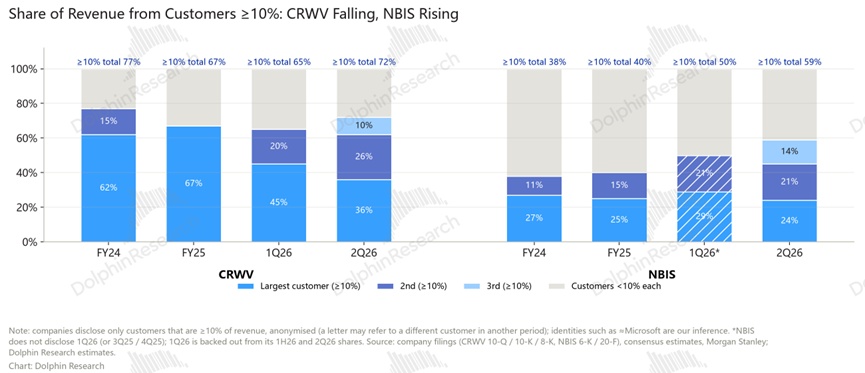
While NBIS has more concentrated RPO, its actual revenue is more diversified. In 2Q26, CRWV's top three customers contributed 72% of revenue vs. NBIS at 59%.
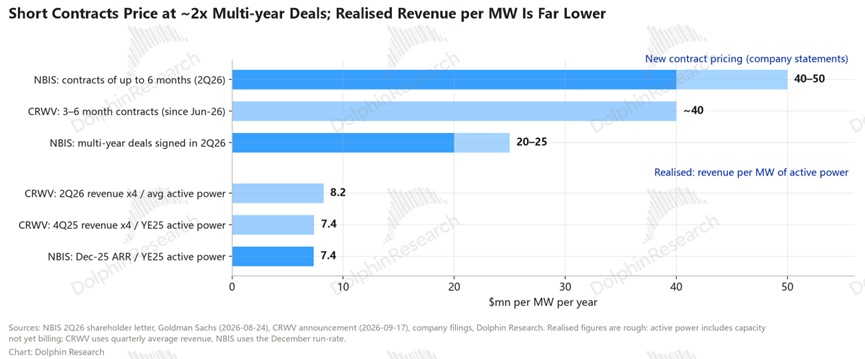
The contrast is as noted: NBIS leans on spot and short-term sales with many smaller customers; CRWV gets nearly all revenue (~98%) from multi-year contracts.
NBIS does this to fully capture GPU rental pricing upside: in 2Q26, NBIS's new LT deals priced around $20–25 bn per GW per year, but short-term pricing in Q3 exceeded $40 bn.
Legacy deals might be only $8–10 bn. In a downcycle, falling GPU rentals will hit short-term and on-demand revenue first, unlike LT deals that are 'all-weather', and some revenue can go to zero.
In that scenario, NBIS's execution speed is key — turning capex into revenue as quickly as possible during the pricing boom.
III. Margins: a headline 28-pt gap, but actually similar
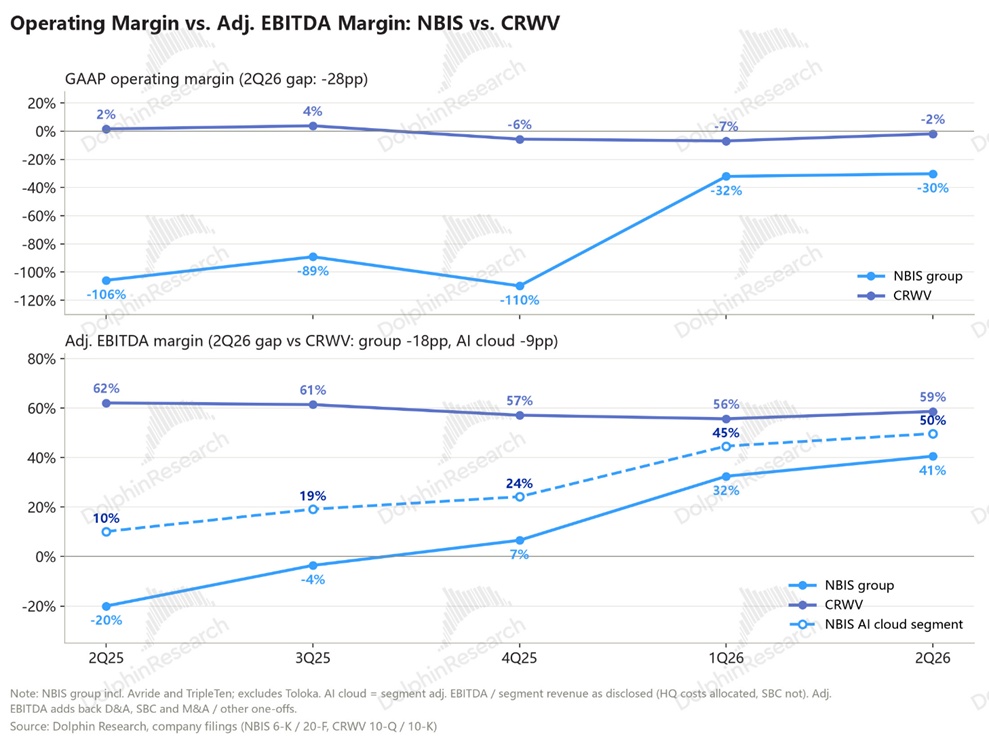
Bottom line: CRWV's reported OPM looks ~28 pts higher than NBIS, but the gap is driven by NBIS's loss-making side bets, higher sales expense, and SBC. Cloud-only, the difference is about 9 pts.
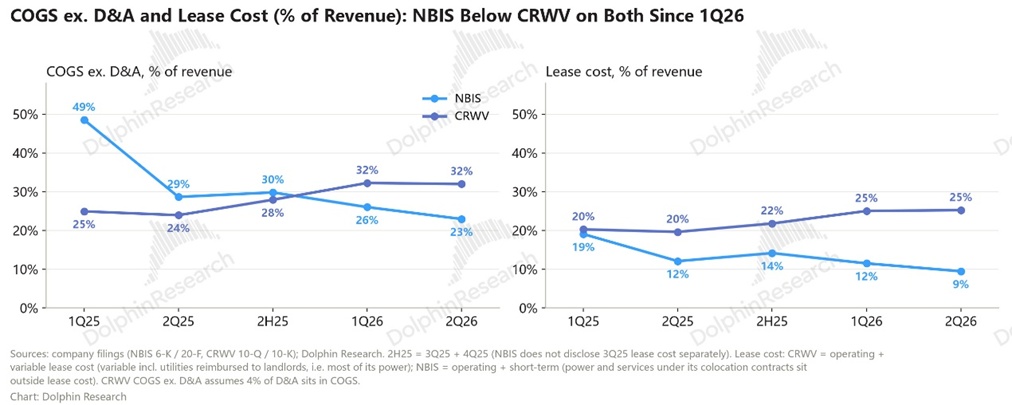
On infra costs, NBIS screens leaner than CRWV, mainly because some DCs are self-built, with buildings depreciated over 20 years and shown separately with other D&A, lowering cost of sales on paper.
The chart shows CRWV's margin stable over the past year-plus, while NBIS is rising rapidly.
3.2 Costs and opex: free-selling needs more sales expense
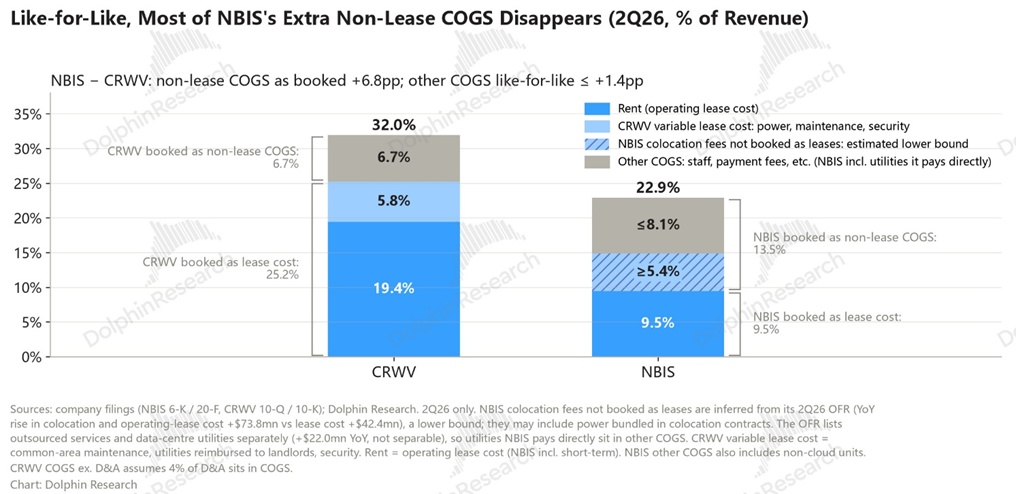
(i) With self-built DCs, NBIS's 23% COGS ratio is lower than CRWV's 32%, largely due to accounting differences noted above.
CRWV fully leases DCs, booking rent in COGS; NBIS has five self-owned DCs out of 21 planned, booking building costs into D&A rather than COGS. Adjusting for rent accounting, power and O&M cost ratios are essentially similar.
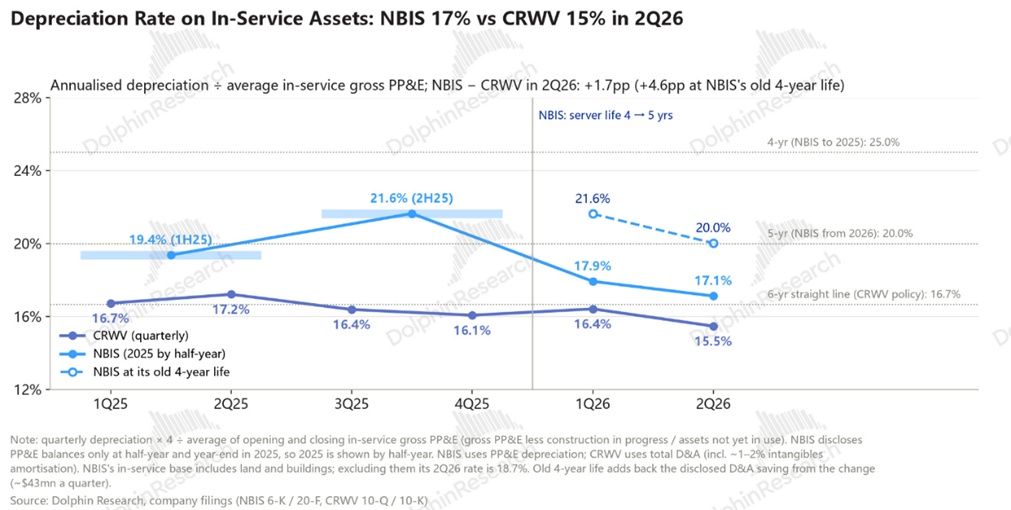
Under this setup, NBIS's D&A ratio should not jump much either, since buildings are depreciated over ~20 years, much longer than ~5 years for IT gear. Property D&A likely stays below 10% of NBIS's total D&A, with the trade-off being higher upfront cash capex.
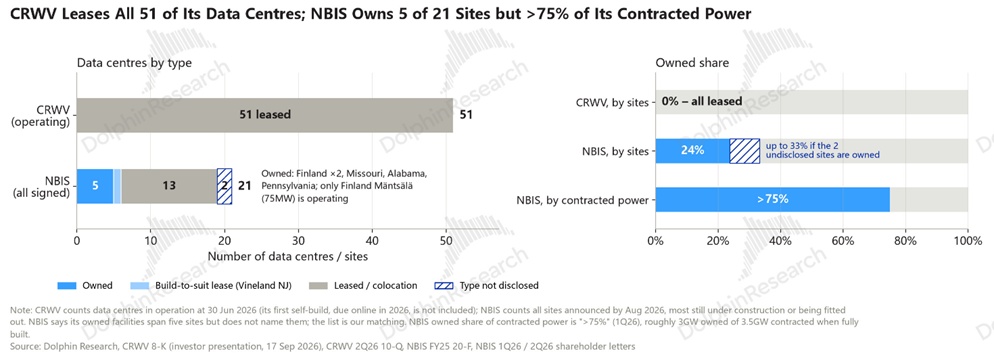
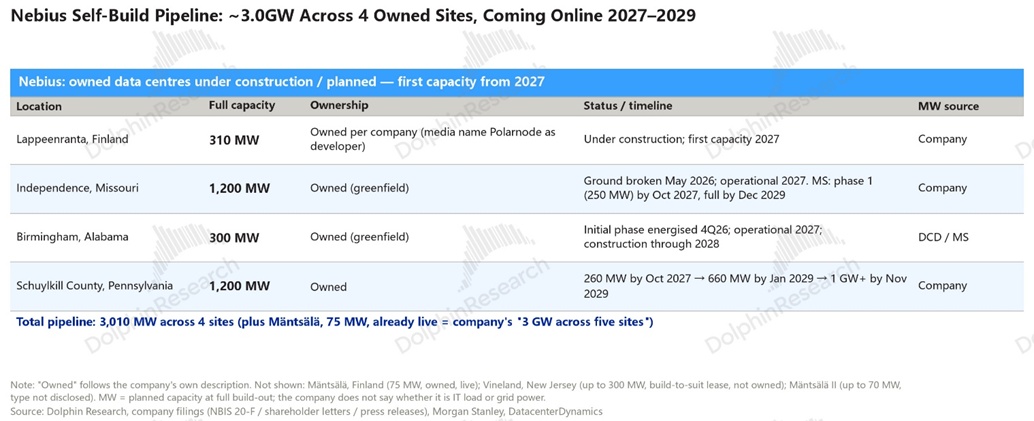
Only Finland is live among owned DCs, with 75 MW capacity, accounting for about 44% of NBIS capacity slated to go live by end-2025. NBIS rent will surge thereafter:
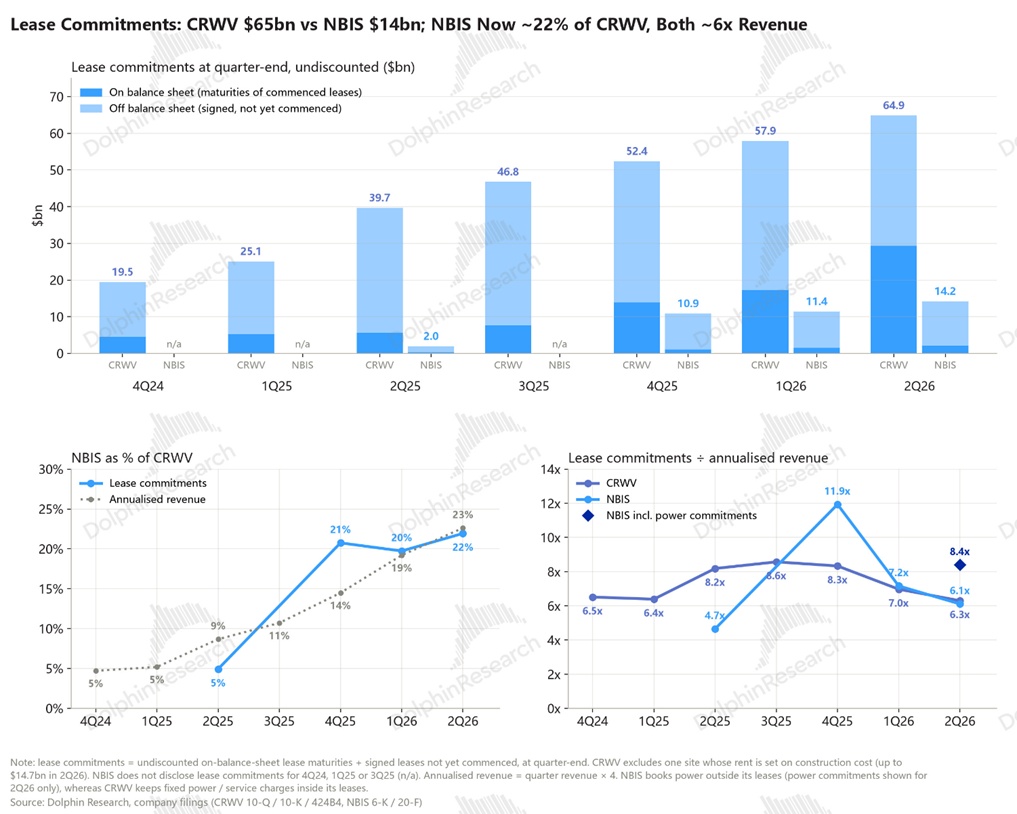
Total on/off-balance lease liabilities rose from about $2 bn in 2Q25 to over $14 bn in 2Q26 and will phase in over 2026–27. Still, the plan remains self-build heavy: of the 5 GW locked for end-2026, about 3 GW will be on owned sites.
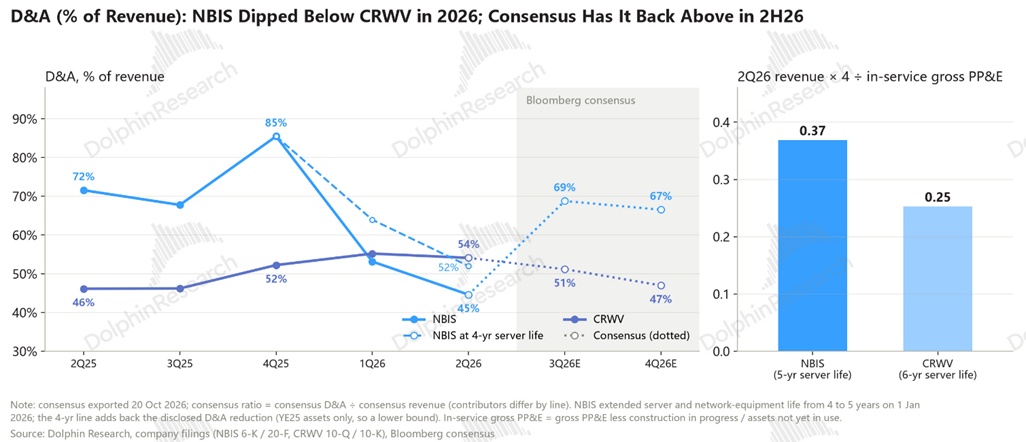
(ii) D&A: NBIS's D&A ratio is lower for now, but may not stay so
In 2Q26, D&A was 54% of revenue at CRWV vs. 45% at NBIS. Including D&A, true GPM was 32% for NBIS vs. ~14% for CRWV, with NBIS ahead by about 18 pts.
First, NBIS's rental pricing has risen more in recent quarters, generating more revenue per unit of assets. Second, much of its asset base is under construction and not yet depreciating: NBIS has more assets under construction than in service ($7.8 bn vs. $6.3 bn).
As many sites go live from late 2026 to 1H27, D&A will front-run revenue, likely pushing the D&A ratio up sharply and potentially above CRWV.
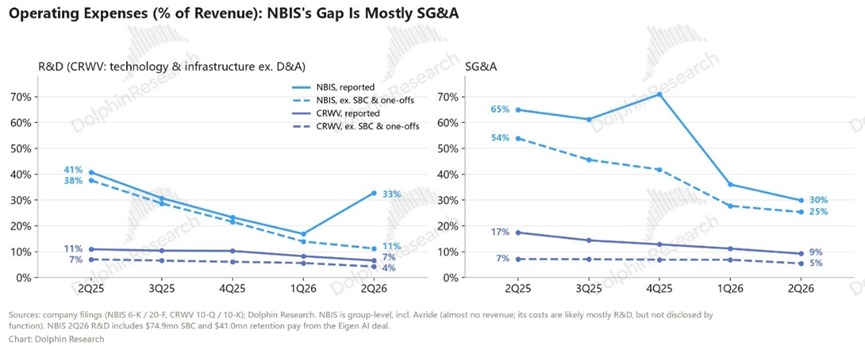
This comparison is not entirely fair, since a large portion of CRWV capacity is tied to short-term completion and needs heavier sales BD and upkeep. The higher expense intensity reflects a deliberate model choice.
The right metric is true GPM minus sales expense ratio — the 'gross-to-sales spread'. Ex-SBC in 2Q26, NBIS's sales expense ratio was as high as 25% vs. CRWV at about 5.5%.
After this further deduction, NBIS's gross-to-sales spread was 7%, actually below CRWV's 8.5%.
Takeaway: NBIS has greater upside
In our view, this is the fair comparison: with revenue at roughly one-quarter of CRWV's, NBIS's gross-to-sales spread is nearly on par, suggesting more room for margin expansion.
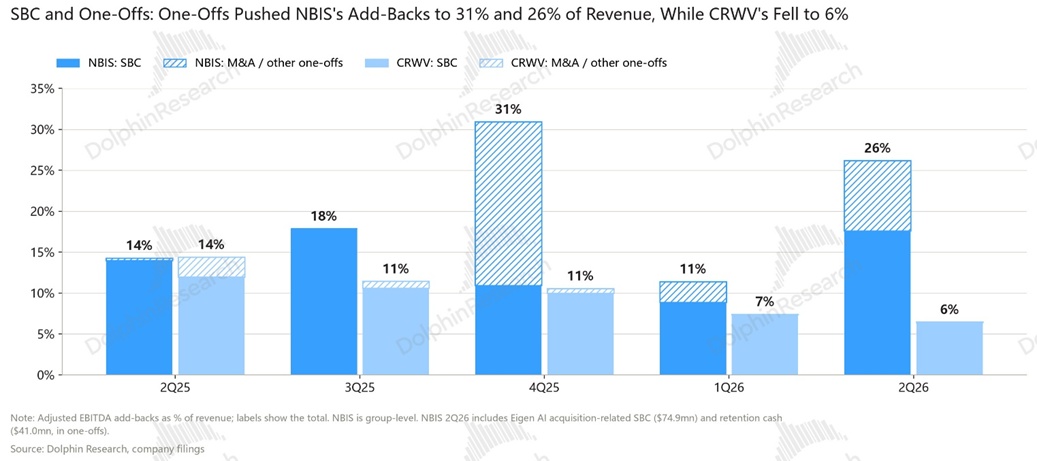
Other items like SBC and M&A are noise and not worth overemphasizing.
The next question: how much extra capex is needed to free up compute by self-building, and where will the funding come from? We move to capital deployment.
IV. Compute and capex: NBIS builds faster and prices higher
Bottom line: NBIS is investing heavily, but building fast, which should accelerate revenue ramps, albeit with slightly higher unit compute costs.
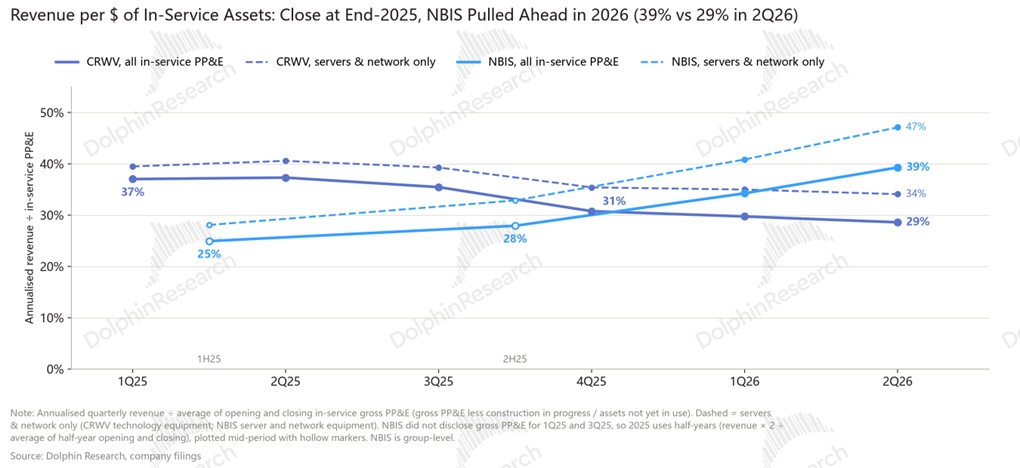
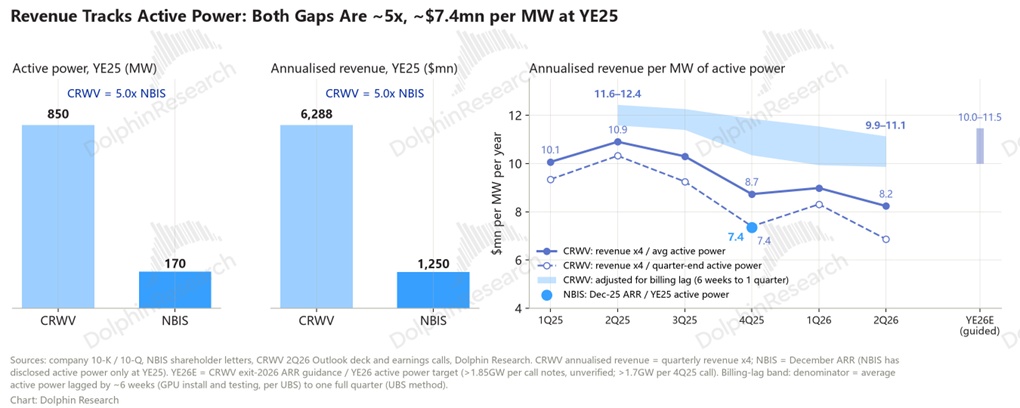
Short-term deals also bring higher revenue per watt elasticity, with asset revenue efficiency rising from about 25% in 1H25 to ~39% in 2Q26. CRWV's slope is flatter due to LT lock-ins.
Once again, market-based pricing ultimately tests execution on project delivery.
4.2 Power: NBIS has locked more, but the comparable metric is 2030 live capacity
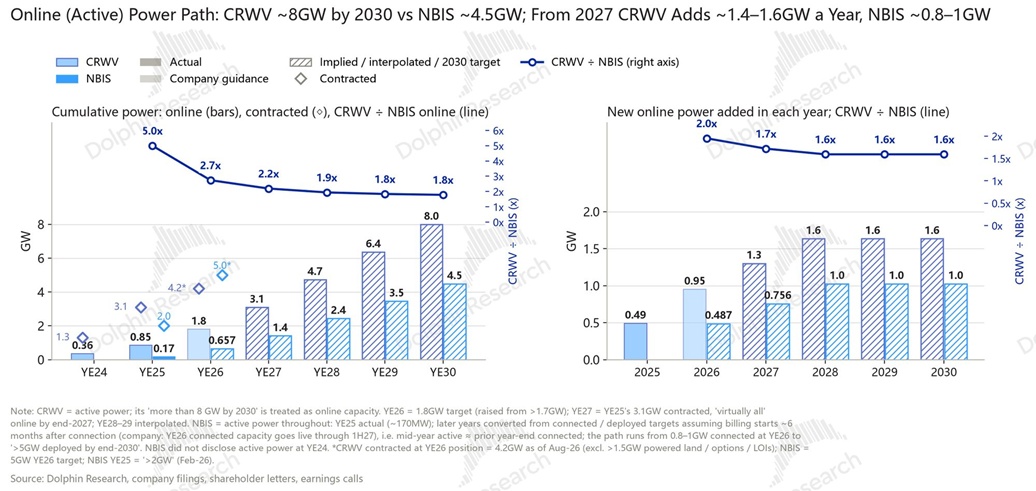
On contracted power, NBIS targets 5 GW by end-2026, above CRWV's ~4.2 GW as of Aug. But signatures alone mean little; what matters is 'live' power:
a. CRWV's contracted power has a clear live schedule, with ~3.1 GW largely live by end-2027.
b. Most of NBIS's is long-dated self-built parks; only 0.8–1 GW connects by end-2026, with 1+ GW per year from 2027, and the 5 GW fully absorbed by 2030–31.
By 2030, CRWV plans to exceed 8 GW; NBIS plans to reach 5 GW and, assuming a ~6-month lag to bill, would have ~4.4 GW live.
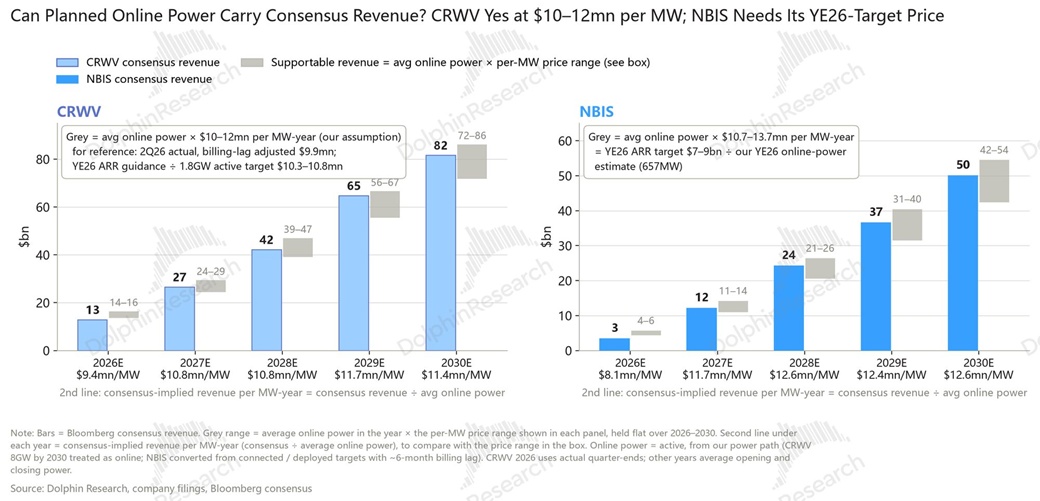
Can these capacities support 2030 consensus revenue? Back-solving on live capacity to 2030, CRWV needs about $11.4 mn revenue per MW per year.
NBIS needs about $12.6 mn, implying heavier price lifts for the latter or, put differently, sustained 'free-sale' premium ahead.
4.3 Capex: NBIS spends harder mainly to build faster, with slightly higher unit cost
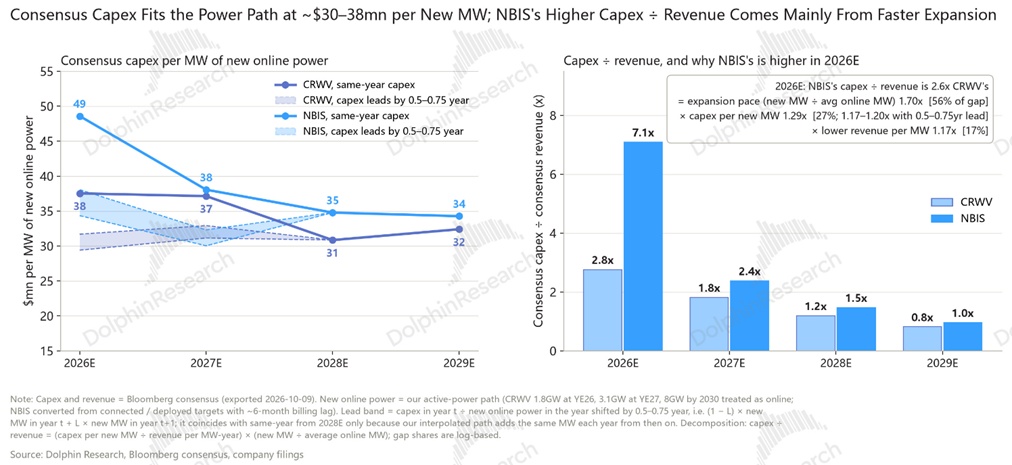
On a paid-cash basis, NBIS's capex intensity is much higher relative to revenue: in 1H26, NBIS spent $8.1 bn, about 8.3x its revenue. CRWV spent $14.1 bn, ~3x revenue.
Our read: NBIS is building more and at slightly higher unit compute cost
NBIS is pouring in capex, with many assets not yet productive and substantial capacity slated to go live between late-2026 and 2027. CRWV has far less WIP relative to in-service assets, and a higher WIP mix inherently means heavier spend.
Matching capex to live capacity with a 2–3 quarter lag, NBIS's per-GW cost (~$35 bn) is nearly 20% higher.
V. Funding: CRWV borrows, NBIS leans on prepayments and equity
Over the long run there is no absolute right or wrong model; what matters is the funding source and cost, and whether the model fits the company's capabilities.
CRWV's 'managed-operations' model is financed with project DDTL loans collateralized by customer contracts — debt-like capital.
NBIS uses equity-risk capital — follow-on equity, converts, plus large-customer prepayments — with the trade-off of ongoing dilution.
In our view, for NBIS, dilution is acceptable if execution is efficient — converting financing into high-ARPU revenue fast enough to outrun share issuance.
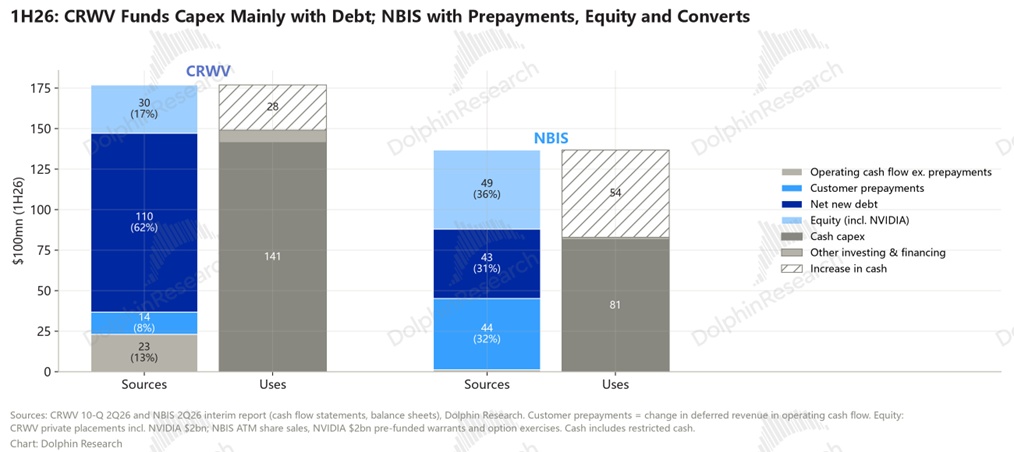
5.1 Sources: CRWV ~60% debt-funded; NBIS ~60% equity-funded
In 1H26, about 60% of CRWV's cash capex was covered by net new debt. For NBIS, headline sources split roughly one-third each across customer prepayments, converts, and equity, though the converts are likely to turn into equity, making the overall mix equity-heavy.
5.2 Debt: CRWV borrows more with rising rates; NBIS uses converts with dilution
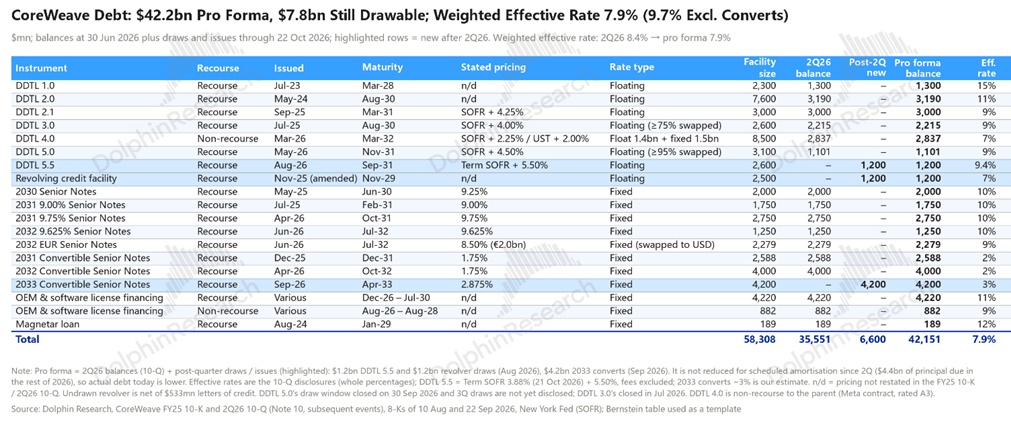
With a debt-first model, you win when borrowing costs are low and cloud pricing is high — a spread business at heart.
CRWV's DDTL costs had trended lower, but rose to 9.4% in Aug, with secondary implying ~15%. The funding environment is deteriorating.
Higher costs with LT contracts capping revenue upside compress the spread and inevitably the valuation.
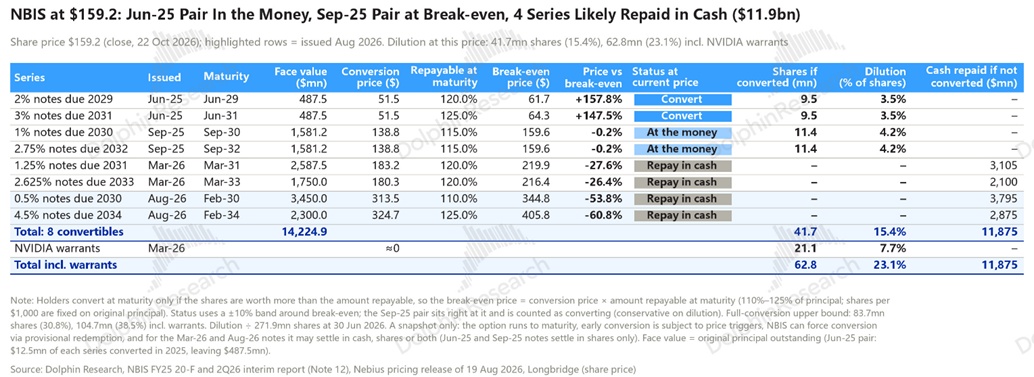
Today's cloud rental pricing clearly favors NBIS's model: equity does dilute, but if execution is fast and converts cash into live revenue quickly, and revenue growth outruns dilution, the math works.
The cost, however, is potential dilution of up to 23% at the Oct 26 share price from four 2025 convert tranches plus NVIDIA warrants.
In return, market-priced cloud services bring higher revenue elasticity, implying potential revenue nearly doubling from 2026 to 2030.
Under this logic, NBIS will go full-throttle to bring compute online, converting financing into revenue-generating capacity as fast as possible while the supply/demand gap persists. The result is heavier cash burn relative to revenue vs. CRWV.
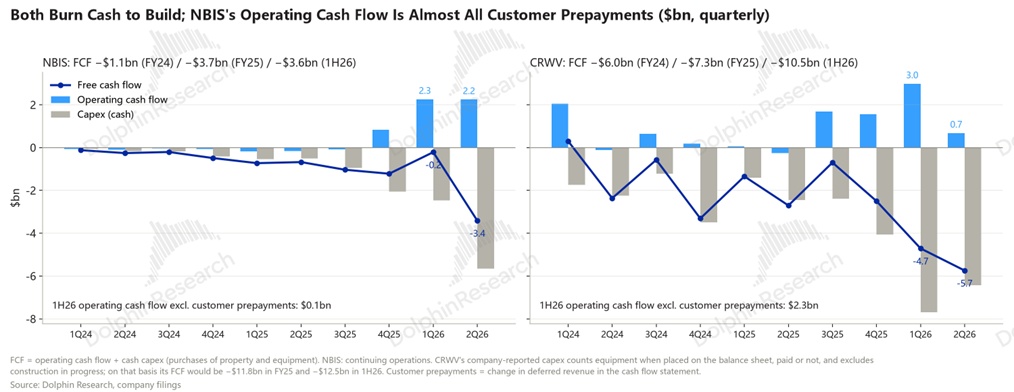
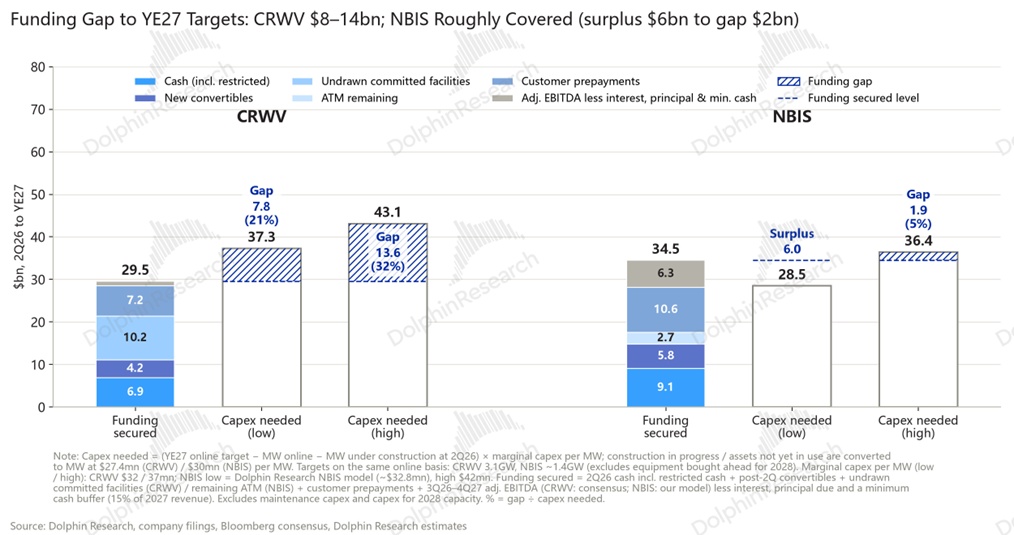
5.3 Funding gap: equity funding eases NBIS's pressure
The reason is simple: with equity-heavy funding, NBIS has a smaller share of cash tied to principal and interest. Operating cash flow can be deployed into go-live capacity rather than interest service.
VI. Valuation: is NBIS worth it?
Putting it together, the current cloud rental market favors NBIS's model.
During a pricing upcycle, revenue elasticity is higher, and equity funding avoids fixed debt service. NBIS just needs to execute hard, bring compute online quickly, and recoup investment.
If prices fall, shareholders knowingly bear the risk. But once cloud rental prices roll over, the 'fund-and-spin-revenue' model stops working, and the stock will underperform sharply — a high-beta proxy on cloud rental pricing.
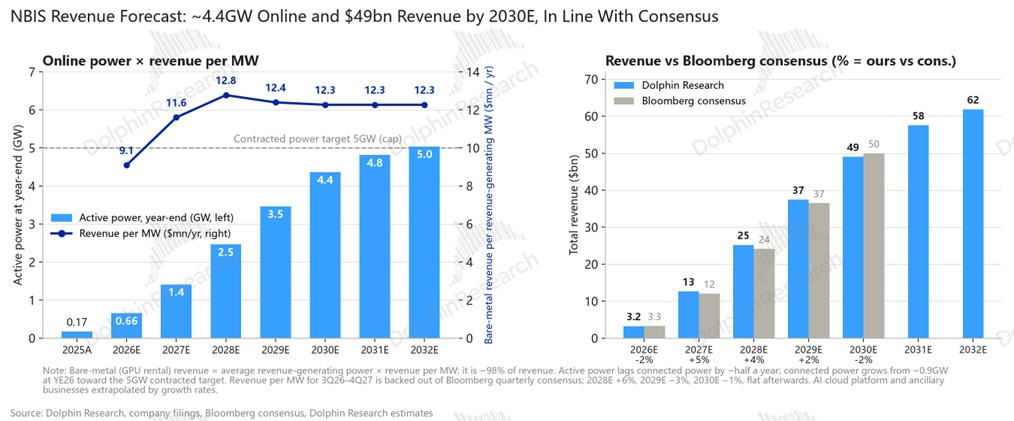
6.3 Base case:
With relatively fixed costs, the key is per-MW revenue. In our base case, the current ~$35 bn per GW revenue run-rate is not sustainable.
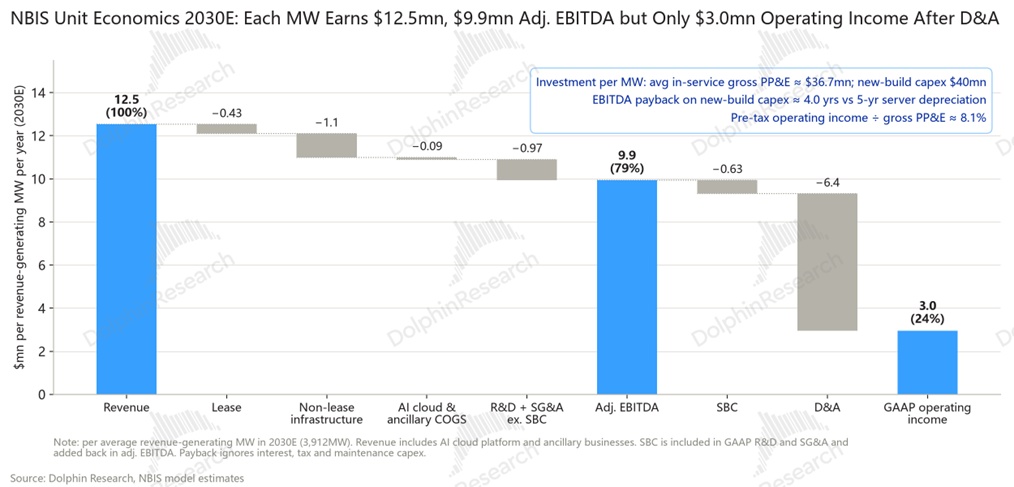
We assume avg. price rises from a ~$10 bn baseline to around $12.5 bn by 2030, delivering adj. EBITDA of $9.9 bn per GW (about a 4-year payback) with a 79% margin. After D&A of roughly $3 bn per GW, operating profit is about $6.9 bn, or a 24% OPM.
This is above market estimates, driven by unit cost and R&D leverage as per-GW revenue rises. GAAP OP turns positive in 2027 and reaches about $11.6 bn by 2030 at roughly 24% OPM.
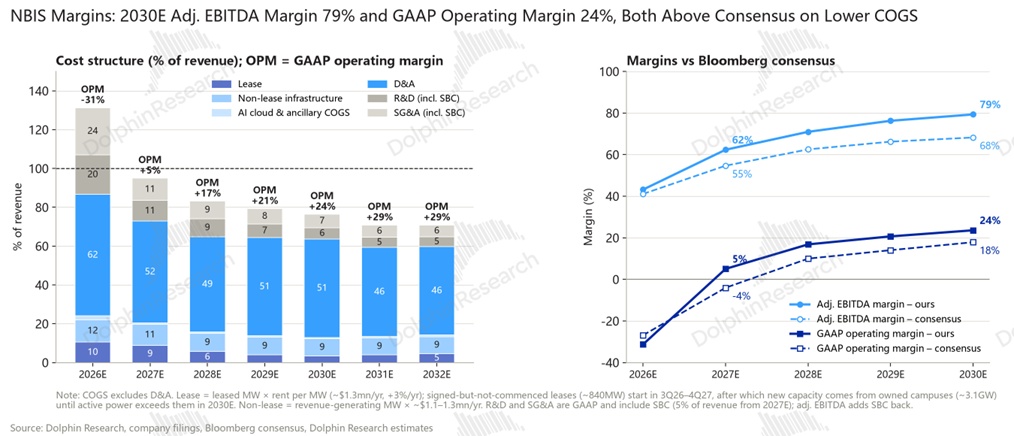
The cost-side hinges on servers being rentable near original pricing post-depreciation and per-MW upgrade capex stabilizing rather than rising.
6.4 Valuation: base TP about $209; per-MW pricing sets the range
Under the base case above, our per-share target is $209 (dilution-adjusted).
If capacity supply runs long and per-GW pricing lands at 90% of base, the stock could fall sharply to $81.
In a bull case, with per-GW pricing 10% above base ($12.5 bn), the stock could reach $375.
This highlights how sensitive NBIS's valuation is to cloud rental pricing!
In essence, this is a high-operating-leverage business under a heavy-asset model — once cost is sunk, it is fixed. Profit elasticity, and thus valuation elasticity, hinge on revenue per watt; every incremental dollar drops heavily to the bottom line.
As for dilution — ending 2030 share count at 500 mn vs. 270 mn in 2Q26 — as long as revenue elasticity is strong, it can be absorbed.
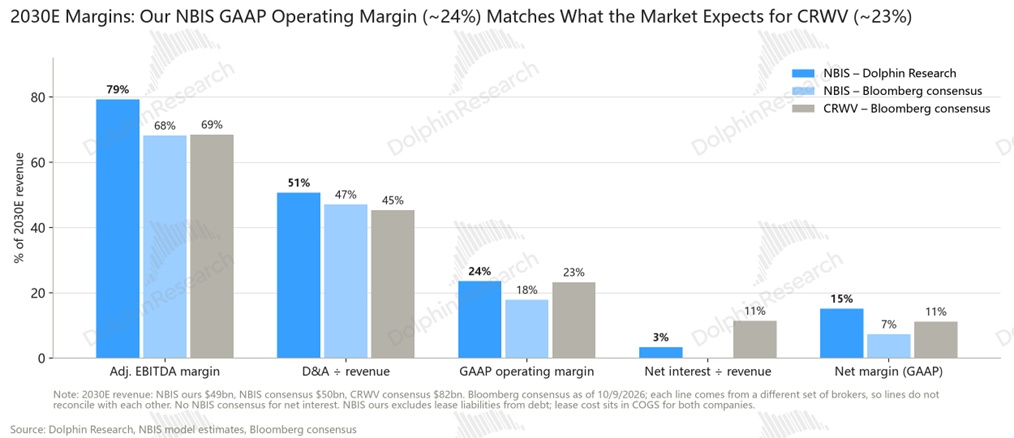
Overall, because NBIS assigns more capacity to high-elasticity short-term sales rather than high-visibility LT contracts, it enjoys greater earnings and valuation elasticity while compute is tight and rental prices are rising. In an upcycle, NBIS is our top pick among neo cloud names.
Conversely, in a downcycle with falling compute prices, the lack of LT protection means greater downside elasticity in both earnings and the current valuation premium.
Once a turning point toward lower compute pricing is in sight, NBIS should be exited decisively, as it may face a harsh setup of no contracts or revenue but rigid compute costs.
<End of text>
Risk disclosure and statement:Dolphin Research Disclaimer and General Disclosure
The copyright of this article belongs to the original author/organization.
The views expressed herein are solely those of the author and do not reflect the stance of the platform. The content is intended for investment reference purposes only and shall not be considered as investment advice. Please contact us if you have any questions or suggestions regarding the content services provided by the platform.