

SKHL

AI can't rewrite the DNA — how long can SanDisk's rally last?
 I'm LongbridgeAI, I can summarize articles.
In the prior pieces 'From Sidekick to Center Stage: How AI Inference Can Rewrite NAND’s Fate' and 'NAND’s Innate ‘Fertility’: How SanDisk Defends 80% GPM?', Dolphin Research noted that AI is not merely lifting NAND demand to a higher plane. It also has the potential to break NAND’s long-standing silicon cycle destiny.
Under an inference-led paradigm, NAND is shifting from a peripheral data warehouse to a must-have component on the compute path. This is a structural change, not just a cyclical upswing.
With the shift from training to inference and the rise of long-context workloads, today’s SSDs have become a ‘token battery’ storing compute capacity. They are now core to system performance, not optional extras.
This report follows that thread and answers two questions:
1. How long can this super-cycle of price hikes run? 2. At the current valuation point, does post-rebirth SanDisk still have upside?
1. How long can this super-cycle of price hikes run?
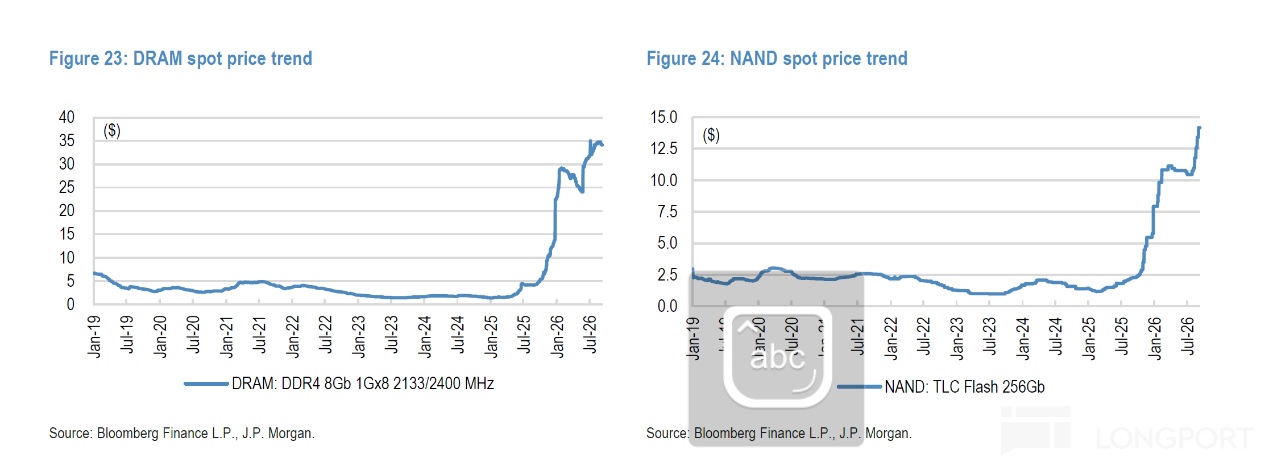
At the industry level, the current rally is a once-in-decades super-cycle for memory: Over the past year+ since Jul 2025, DDR4 8Gb spot prices surged 7–8x, from ~$4.5 to ~$35. NAND is similarly eye-popping, with 256Gb TLC spot rising from ~$2.5 to ~$14, a 5–6x increase.
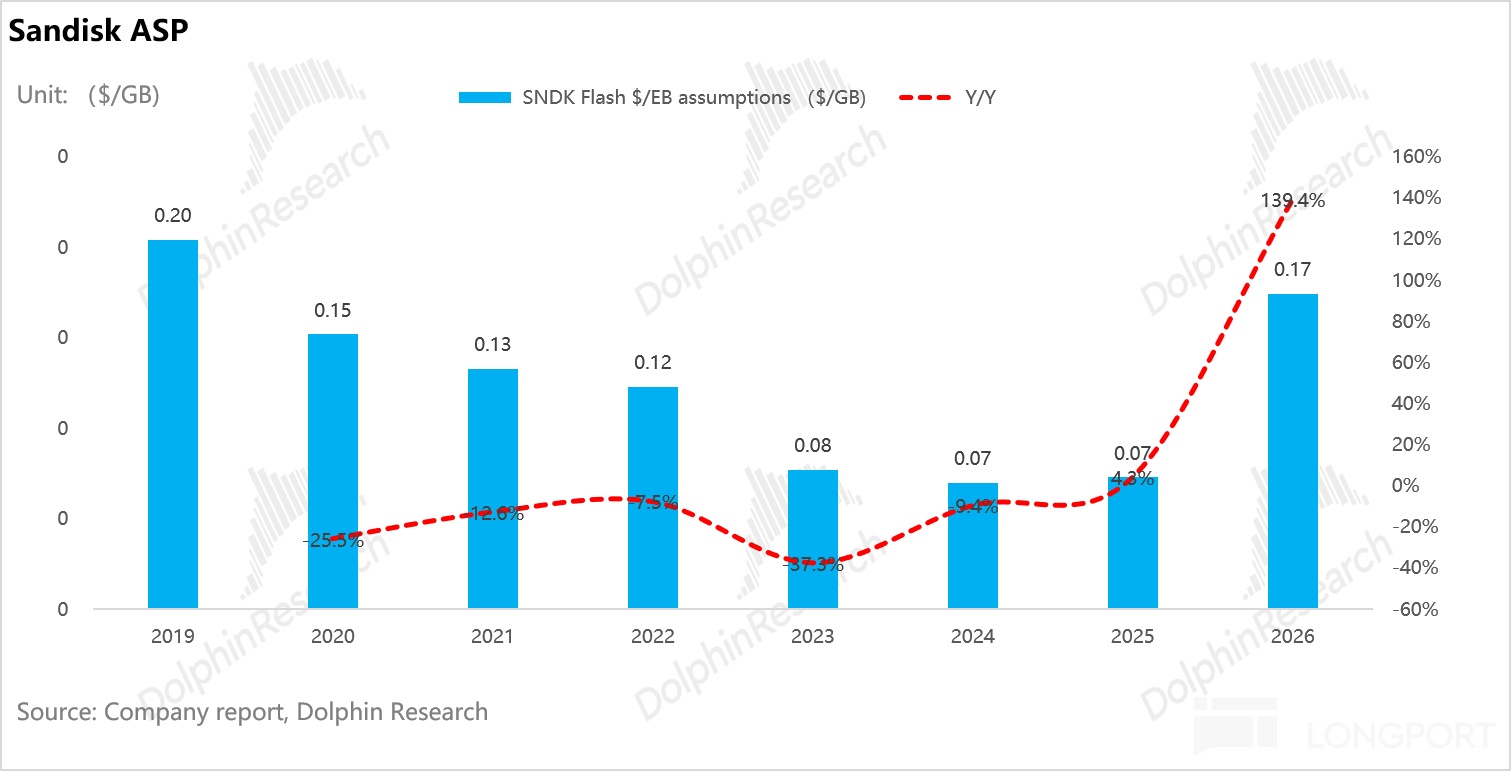
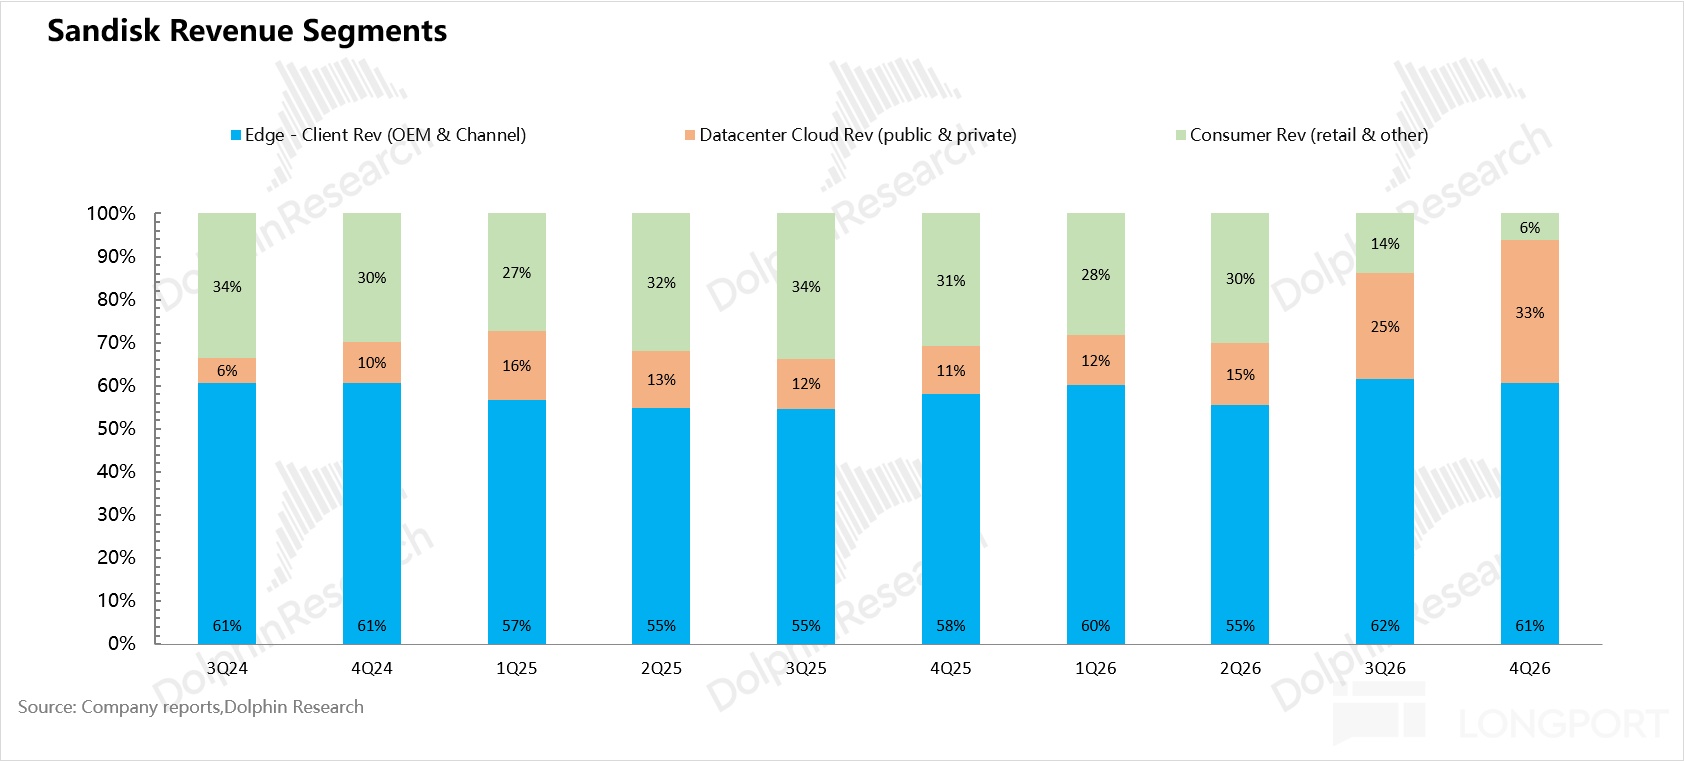
By our estimates, $Sandisk(SNDK.US) FY26 (year-end Jun 2026) blended ASP was ~$0.17/GB, up ~139% YoY. That trails spot gains, largely because price lifts were muted in 1H and SanDisk has many LTAs, while DC mix only rose to 25%/33% in FY26 Q3/Q4.
On a quarterly basis, FY26 Q4 ASP was ~$0.31/GB, up ~340% YoY. That nearly caught up with spot at ~$0.33–0.34/GB over the same period.
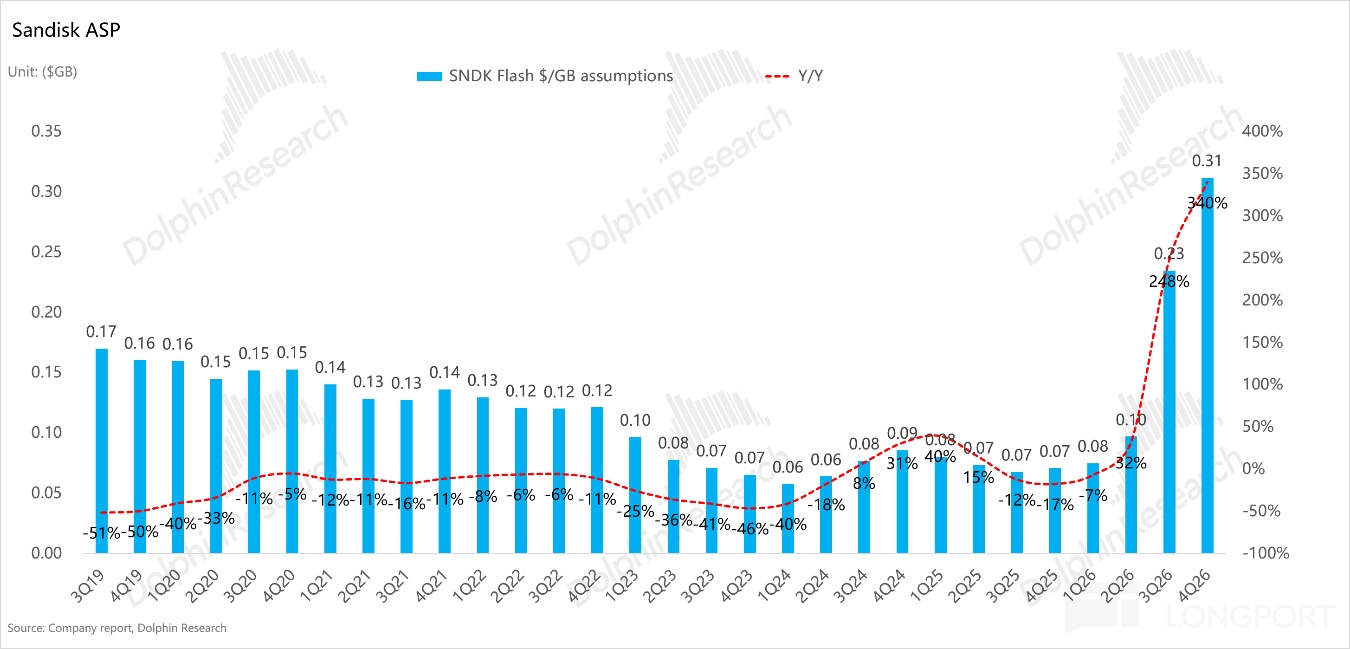

SanDisk FY26 Q4 revenue was ~$9.0bn, up 372% YoY, almost entirely price-driven. Bit shipments rose only ~7% YoY to 29EB.
By segment, data center grew fastest: FY26 Q4 revenue was ~$3.0bn, up ~13x YoY, with mix rising from 11% to 33%. This reflects a rapid pivot to DC-grade products.
On AI use cases, performance TLC eSSDs are driven by KV cache and HPC inference. Capacity-led UltraQLC eSSDs (128TB+) began shipping in FY26 Q4 (Apr–Jun 2026) with revenue recognized, after qualification at several hyperscalers; the 256TB version is expected in mid-to-late 2027.
GPM rebounded from a trough of 22.5% in FY25 Q3 (Jan–Mar 2025) to 84.6% in FY26 Q4. The improvement is almost entirely price-led.
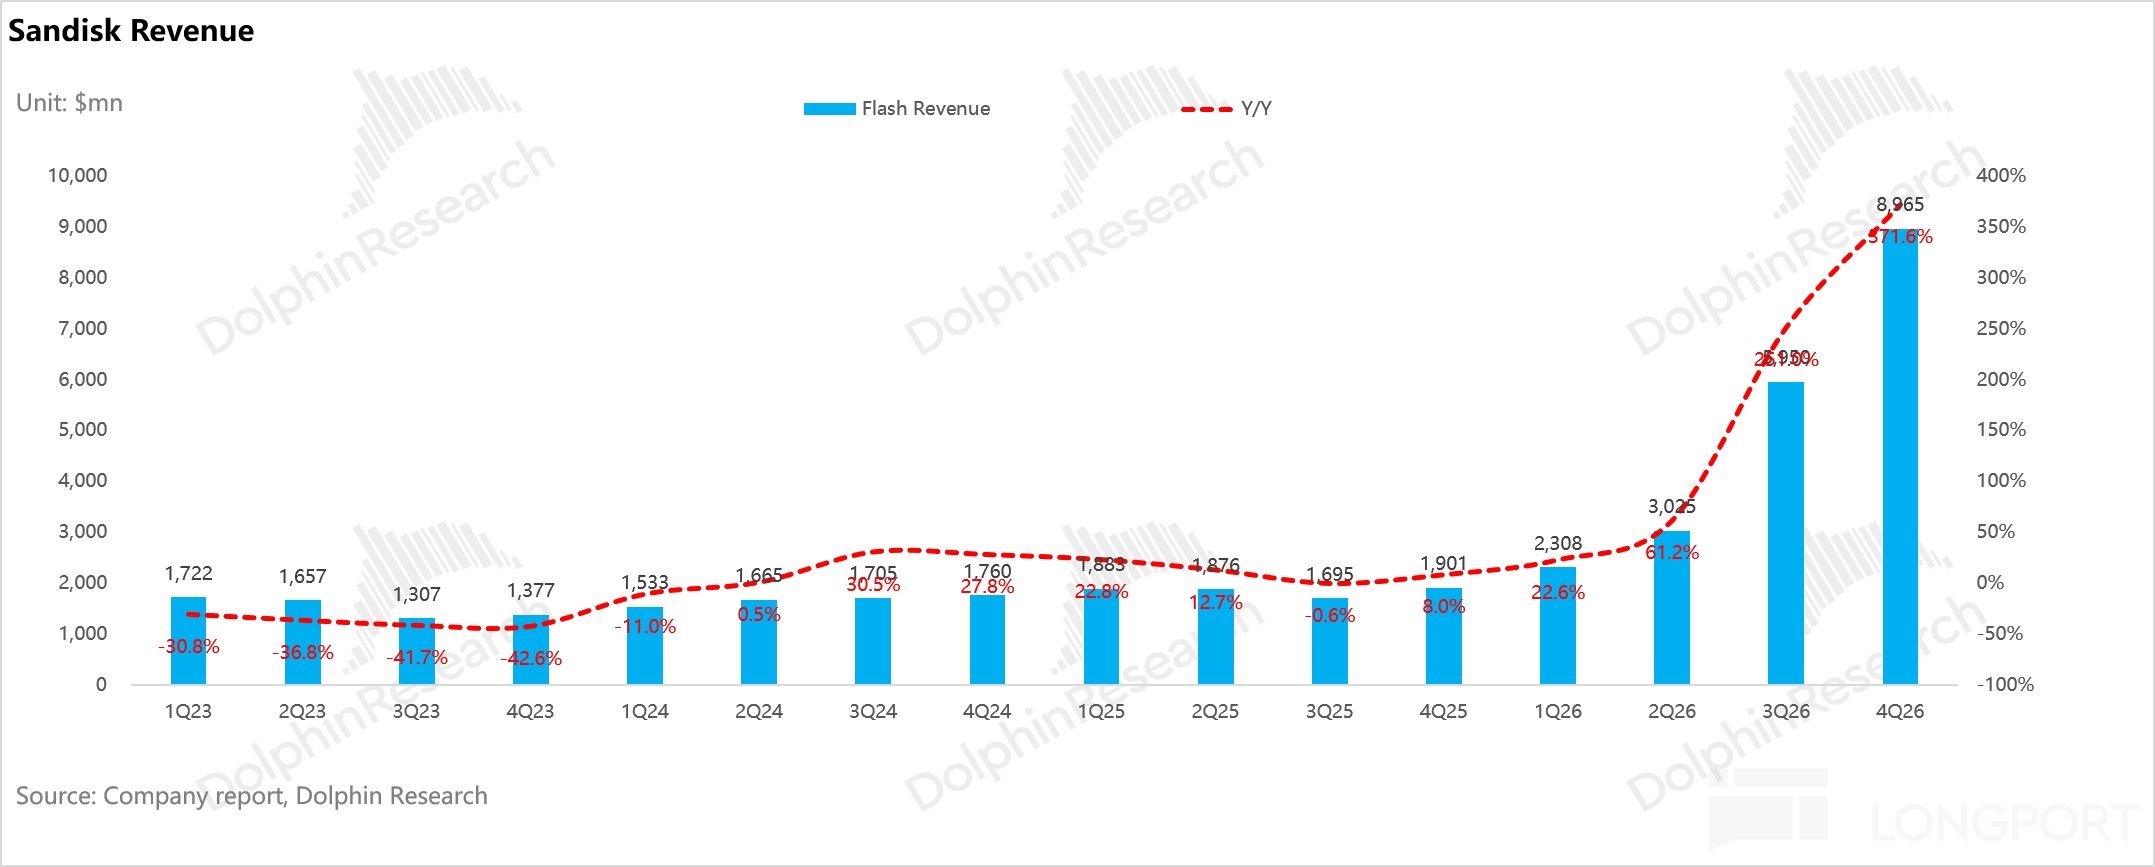
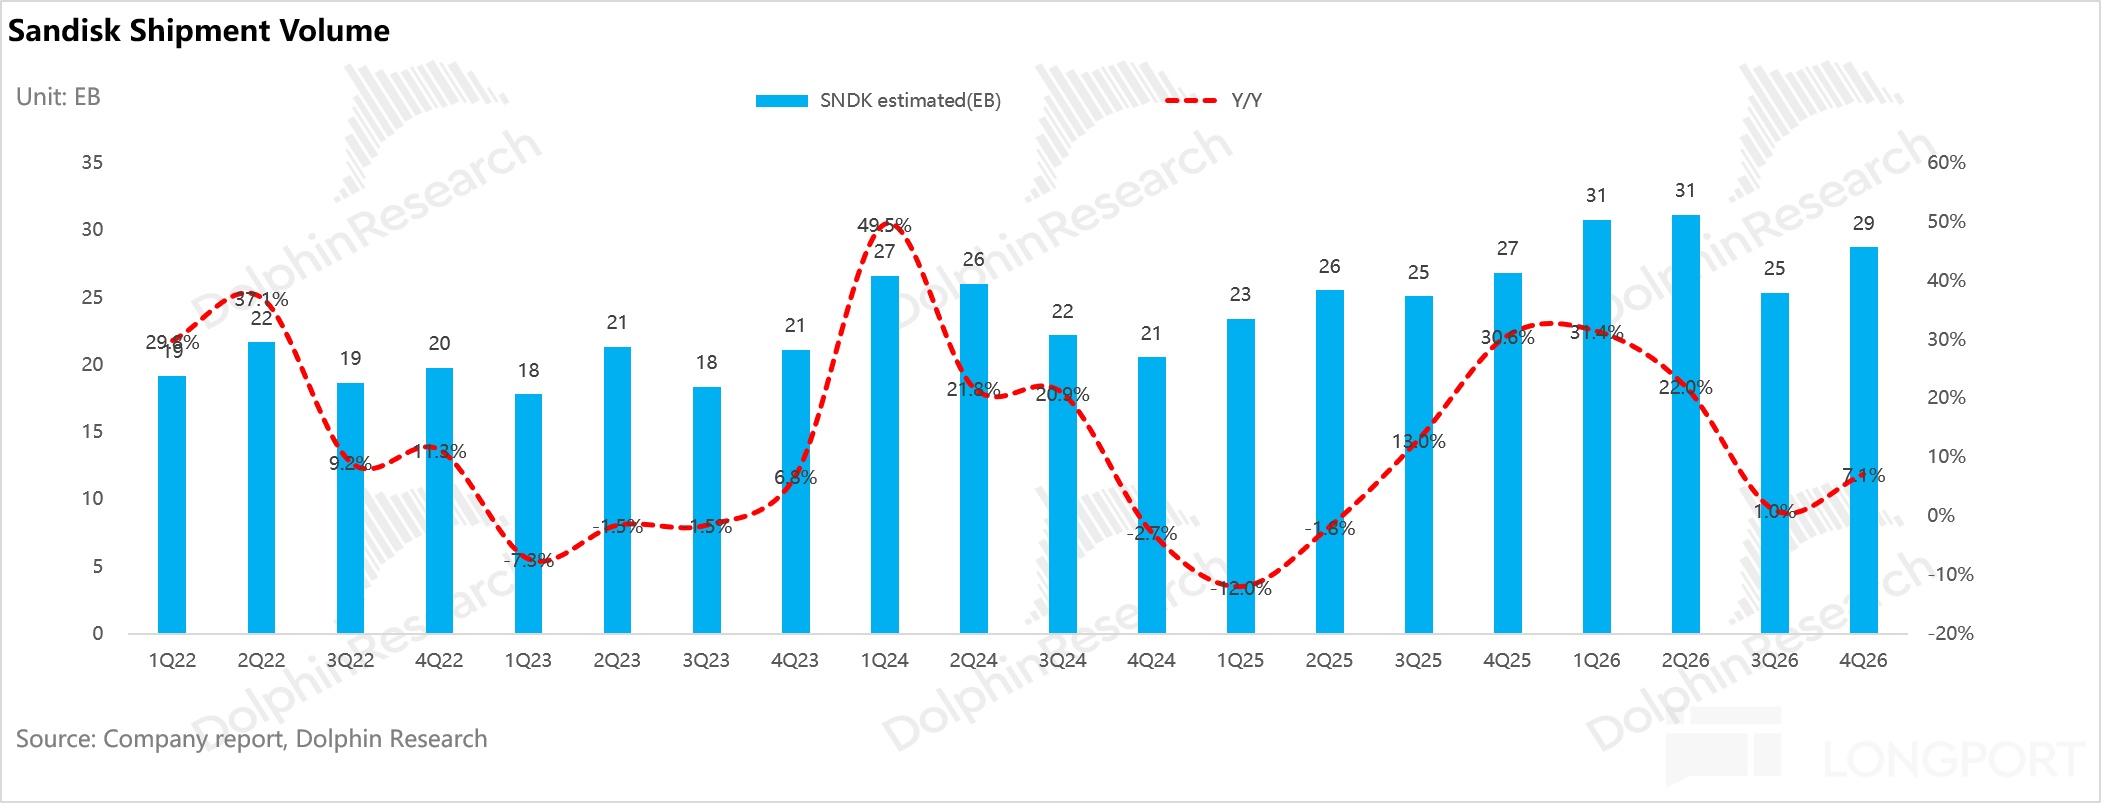
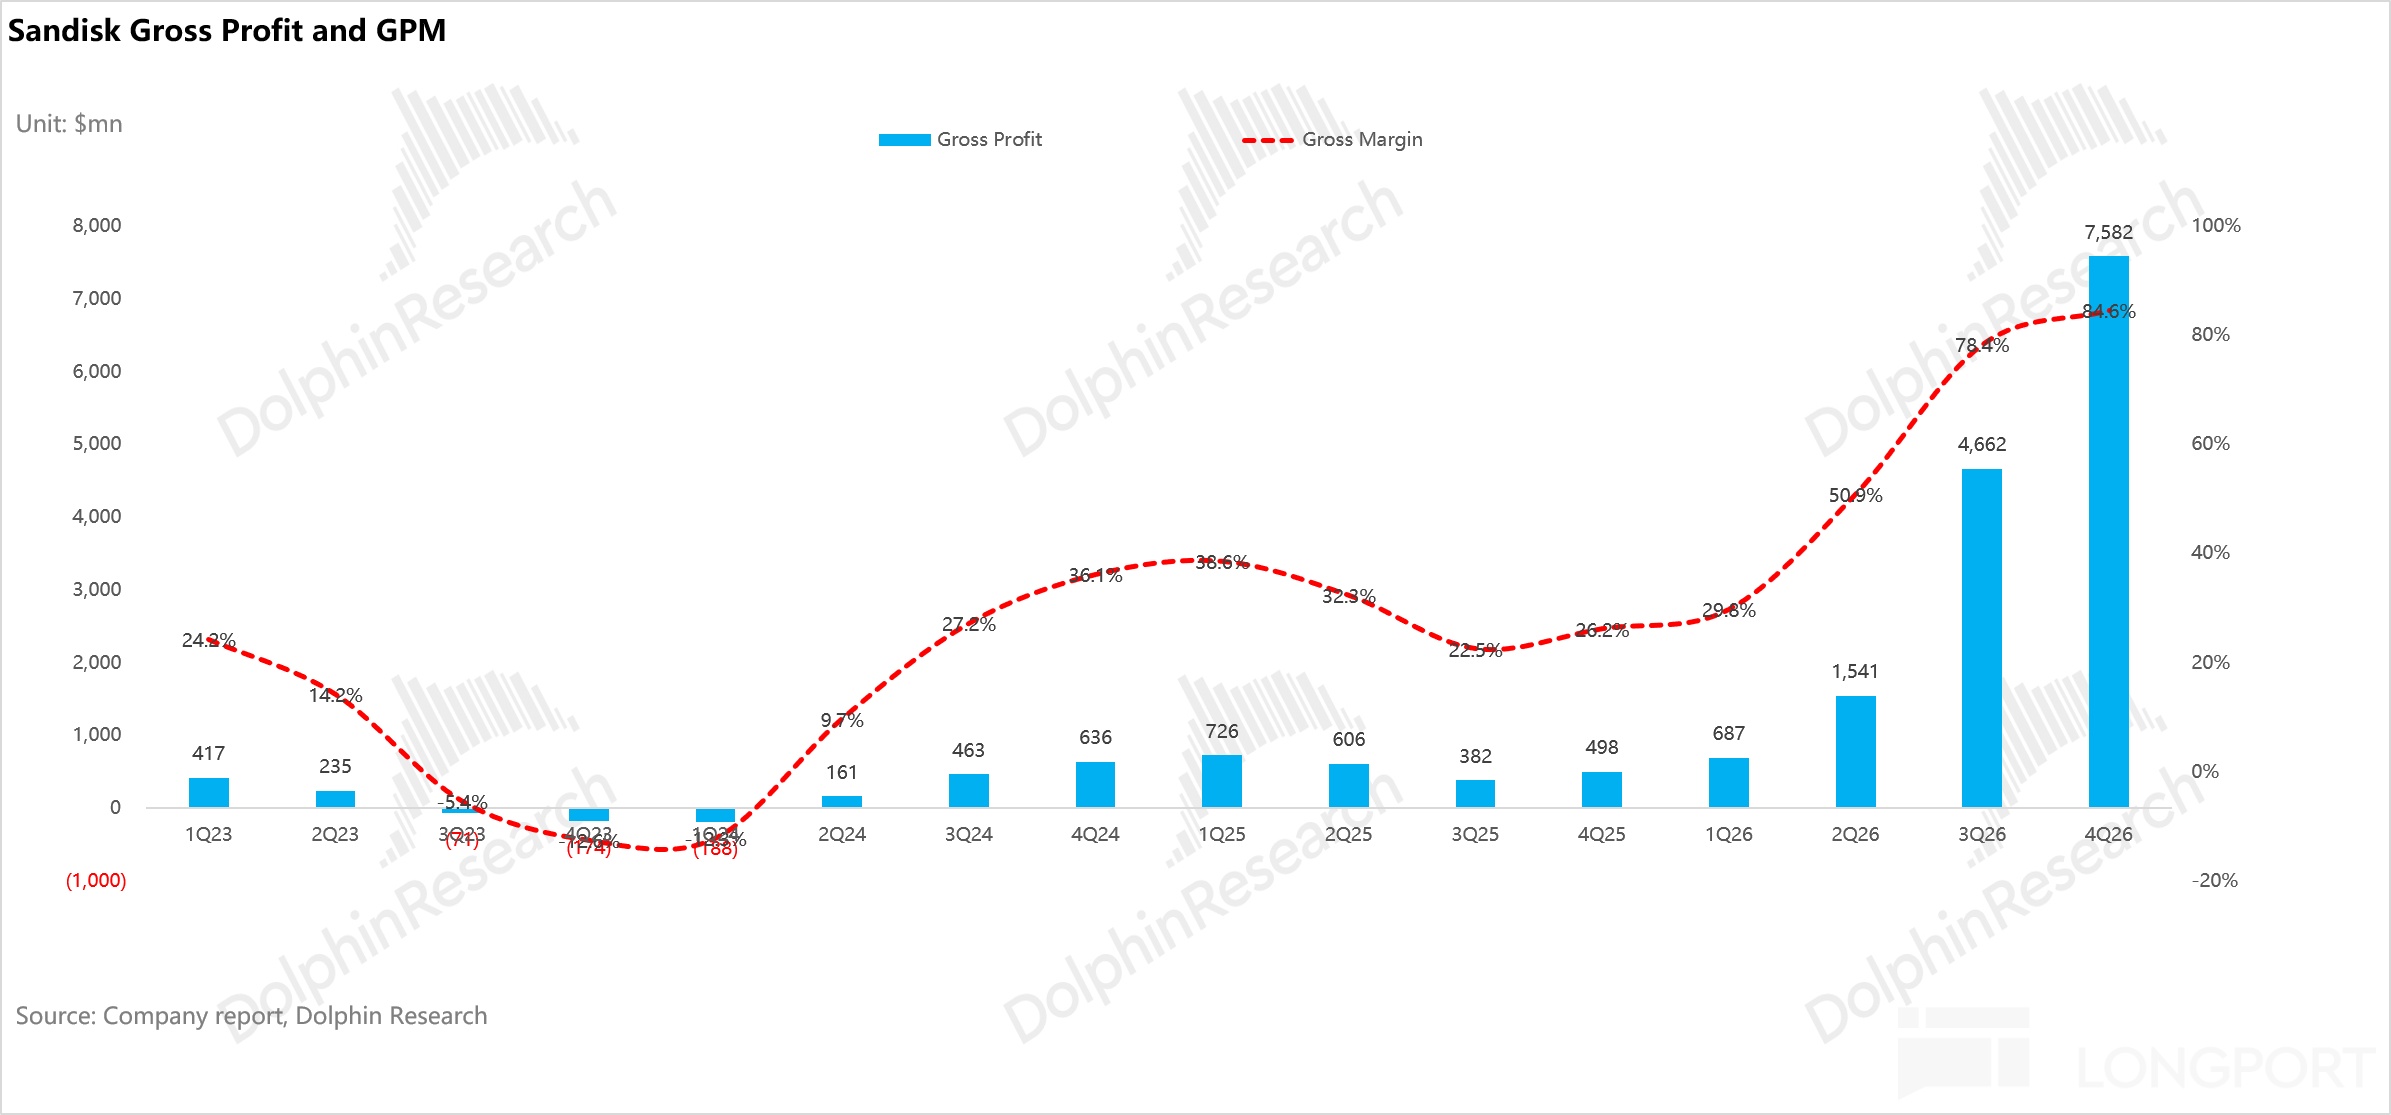
The question is: how long can this super-cycle last, and how sustainable is SanDisk’s 80%+ GPM?
Dolphin Research evaluates this through NAND’s aggregate supply–demand:
1.1 Supply side:
(i) NAND capacity expansion: not via new fabs, but without heavy capex Despite an AI-led demand surge, NAND vendors have stayed disciplined on capex after deep losses in the last downturn. The contrast below is clear.
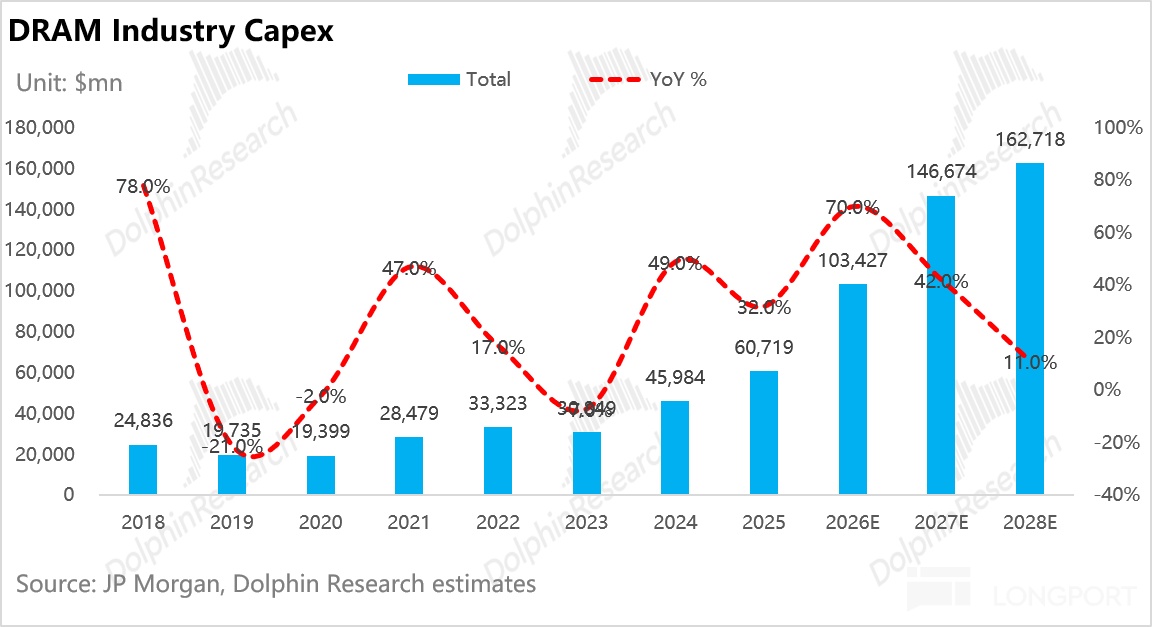
Memory capex is being raised, but the lion’s share goes to DRAM/HBM — est. $162.7bn in 2028 (3Y CAGR 39%). NAND investment is modest, rising to only ~$38bn by 2028, a 3Y CAGR of 25%, with NAND’s share of total memory capex falling from ~25% in 2025 to ~19% in 2028.
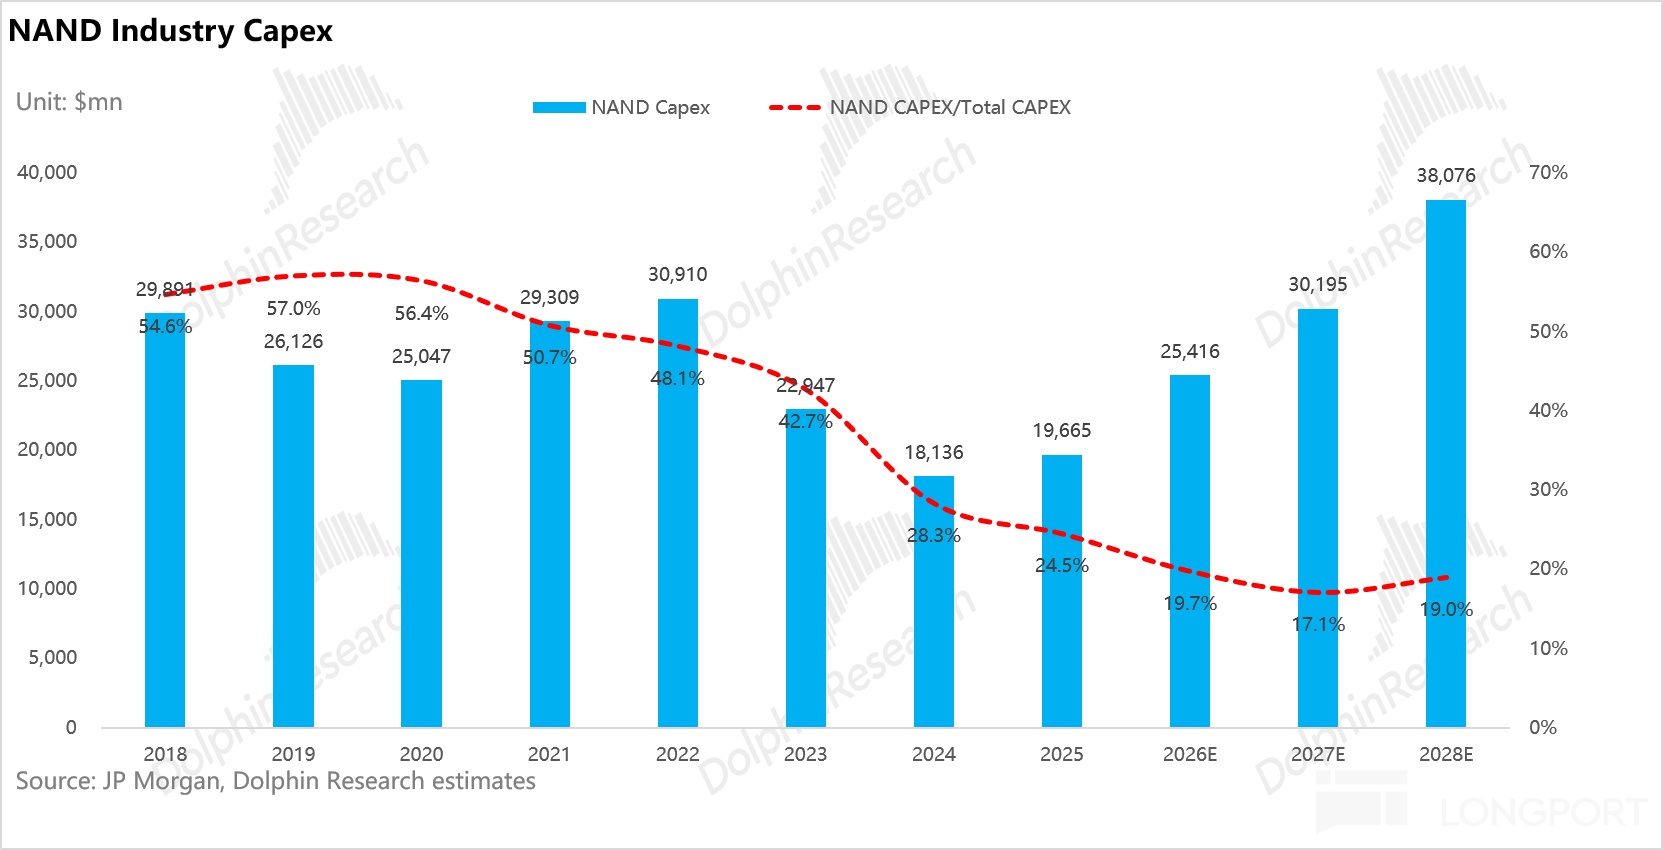
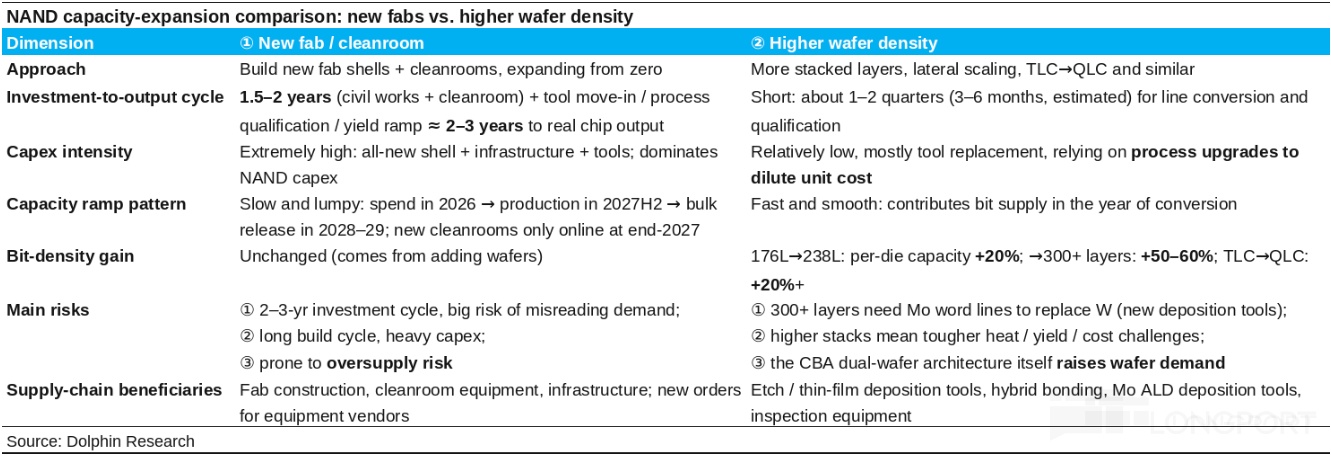
(ii) Capex pivot: ‘squeezing’ output via tech migration Overseas incumbents have fundamentally changed expansion tactics. In 2026–2027, cleanroom constraints limit large-scale new capacity, so capex focuses on upgrading existing lines — chiefly raising 3D stack layers toward 200+/300+, plus higher bits-per-cell and architecture tweaks to lift bits per wafer.
New wafer fabs start to land from 2028, still DRAM/HBM-led. Large-scale NAND capacity release is more a post-2029 story.
Versus greenfield fabs, density upgrades require less investment and ramp faster. Major tool swaps typically take 3–6 months (with a temporary output dip), far quicker than 2–3 years to build new fabs.
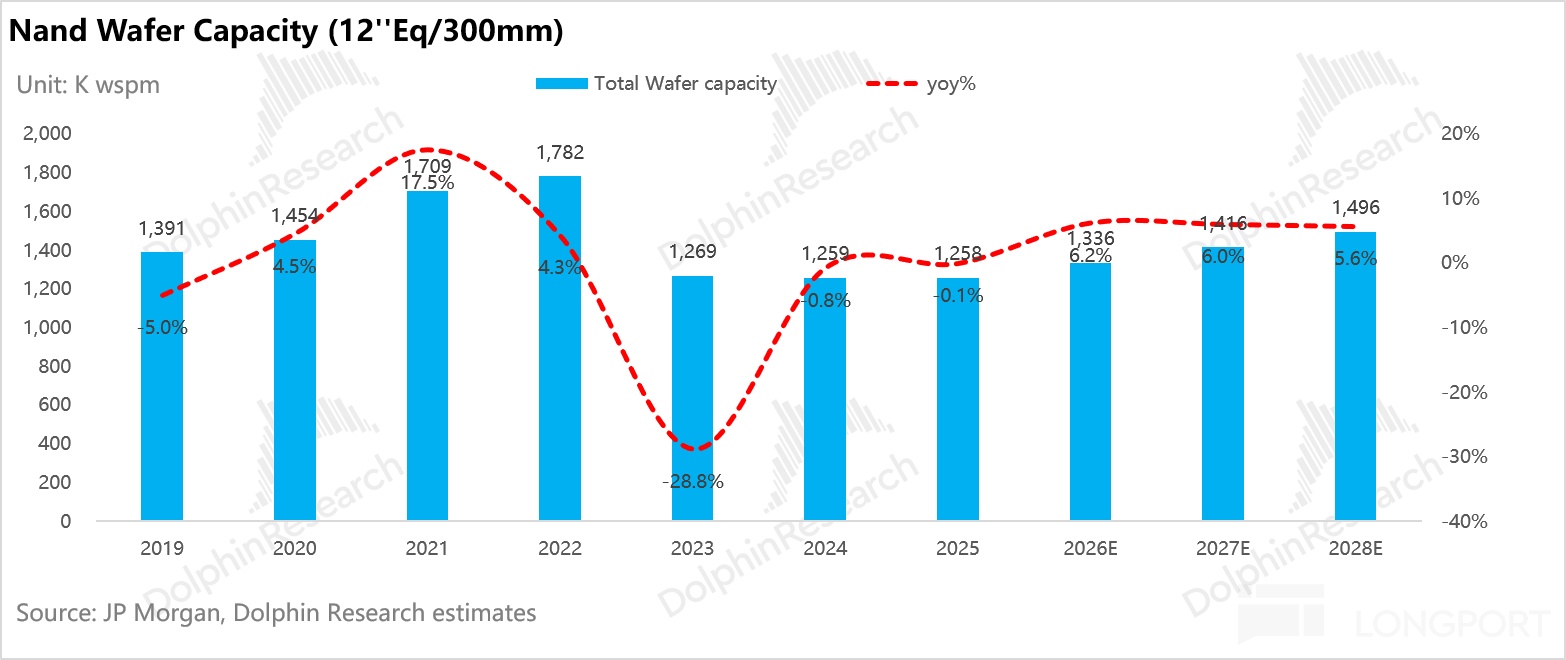
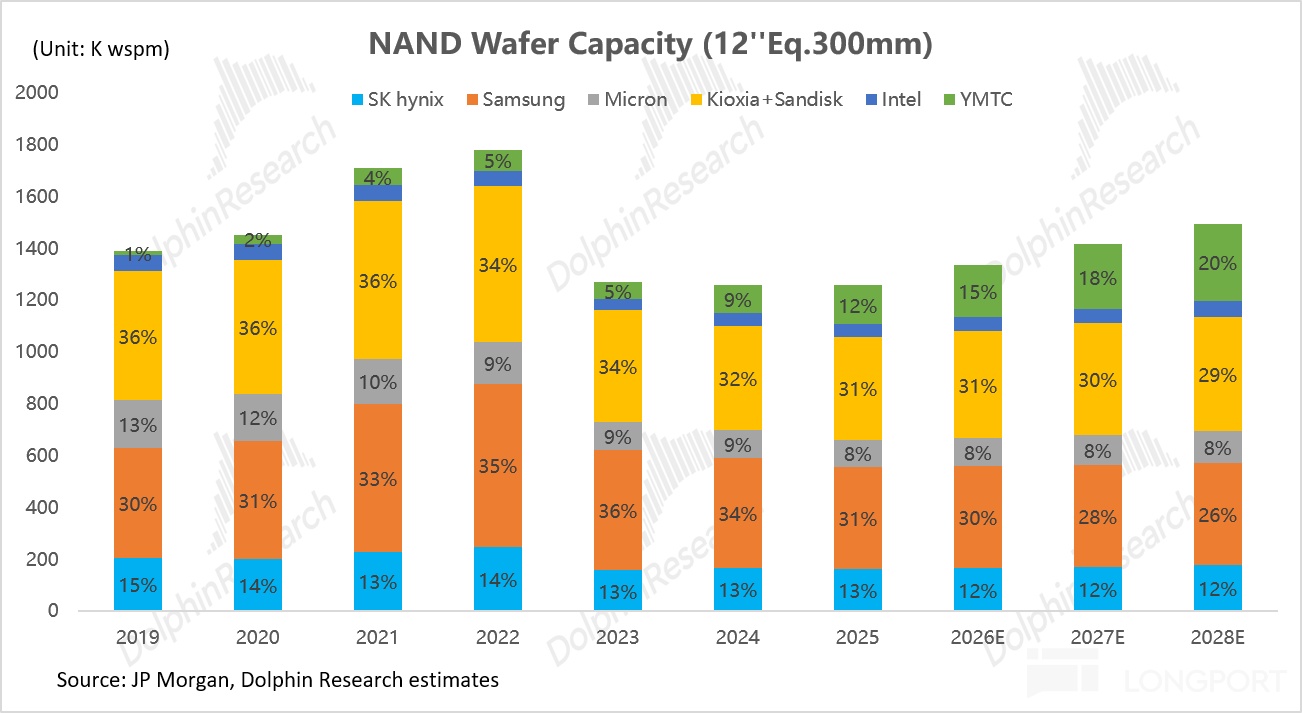
(iii) Capacity release cadence: China-led line additions in 2026–2028, global new lines cluster post-2029 On wafer starts, global NAND capacity is ~1.26mn wpm in 2025, rising only to ~1.50mn by 2028, a 3Y CAGR of ~6%. Of the 240k wpm addition, YMTC contributes ~150k, raising share from ~12% to ~20%; Samsung’s physical capacity is flat, with share sliding from ~31% to ~26%.
New lines are staggered by region and timing: limited release in 2027–2028, with jump-risk in 2029:
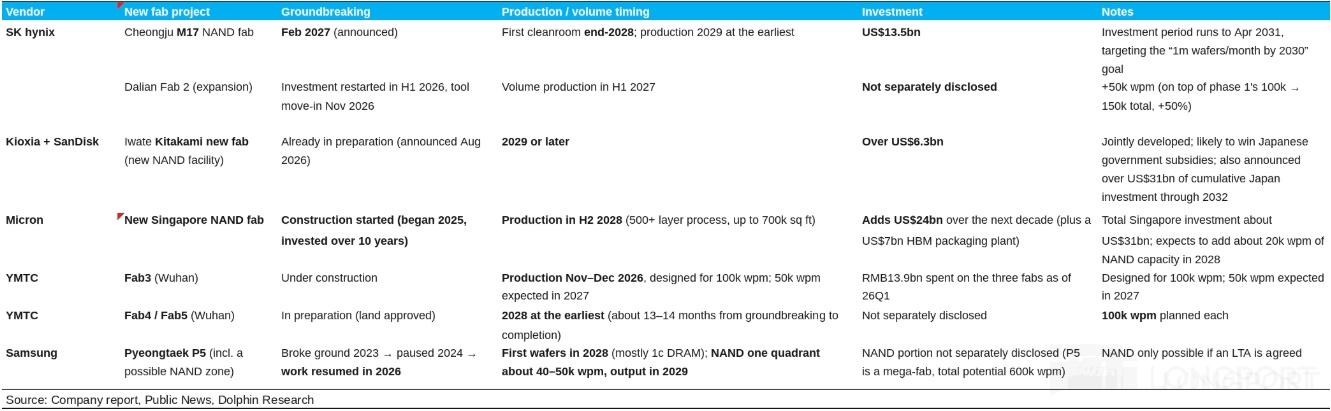
2H26–2028 (China-driven expansion): New fabs mainly include YMTC Fab 3 and SK hynix’s Dalian Fab 2. Overseas players have few large new fabs coming online (Micron’s Singapore fab releases small output in late 2028), and 2027–2028 is the weakest phase for overseas supply elasticity, with bit growth heavily reliant on layer migration.
2029 and beyond (overseas new fabs cluster): Samsung P5, Kioxia/SanDisk’s new northern Japan fab, and SK hynix M17 ramp in tandem. Supply growth could spike, so project schedules and LTA signings must be closely tracked.
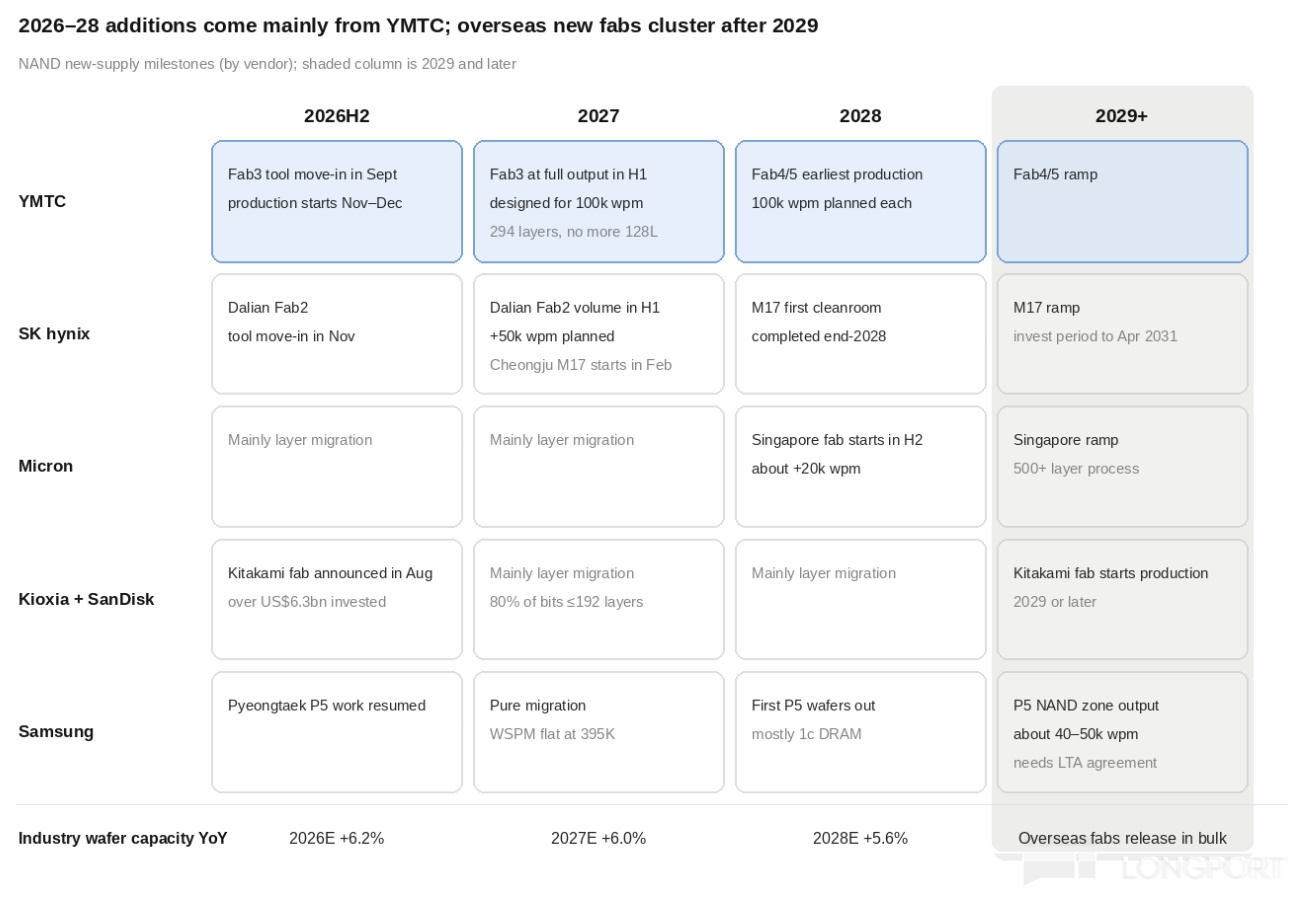
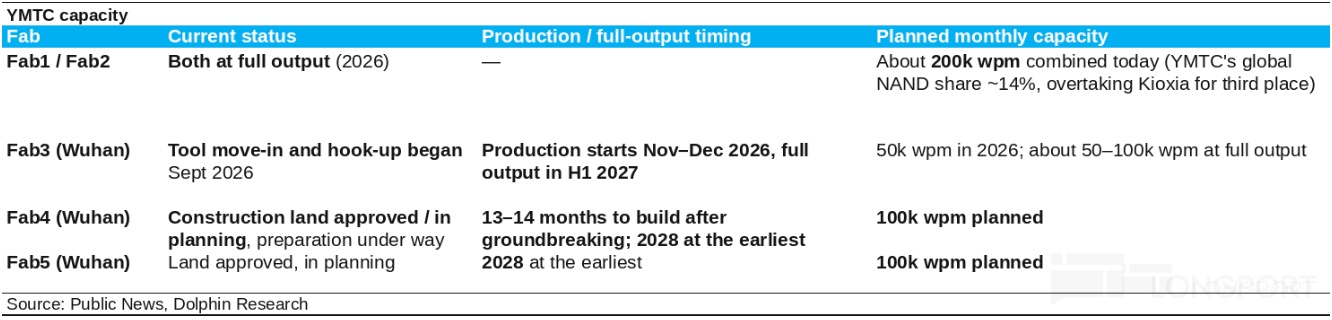
a. YMTC: dual engines — layers + new lines drive expansion over the next three years YMTC capacity rises from ~200k wpm in 2026E to ~300k in 2028E. Fab1/Fab2 are already full (~200k wpm), and Fab 3 (design 100k wpm) is slated to start by end-2026, with monthly output reaching ~50k in 2027.
Its next-gen Xtacking 4.0 enables 1Tb TLC and 2Tb QLC products across enterprise and consumer. Fab 3 will directly ramp 294-layer parts, targeting enterprise SSDs at a 60% mix.
Fab 4/Fab 5 land use is approved (each designed at 100k wpm). If construction is pulled forward, 2028 supply could be revised up.
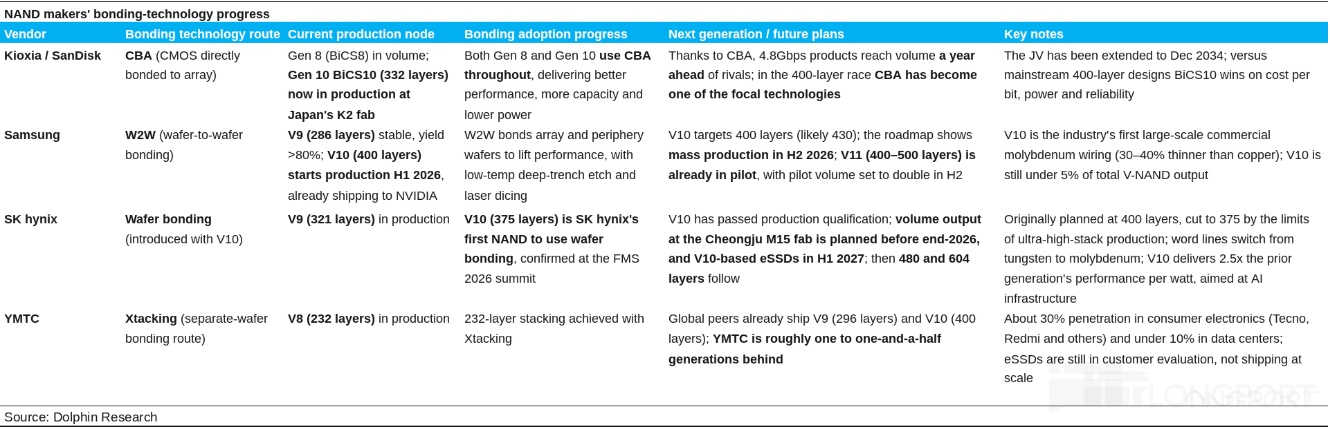
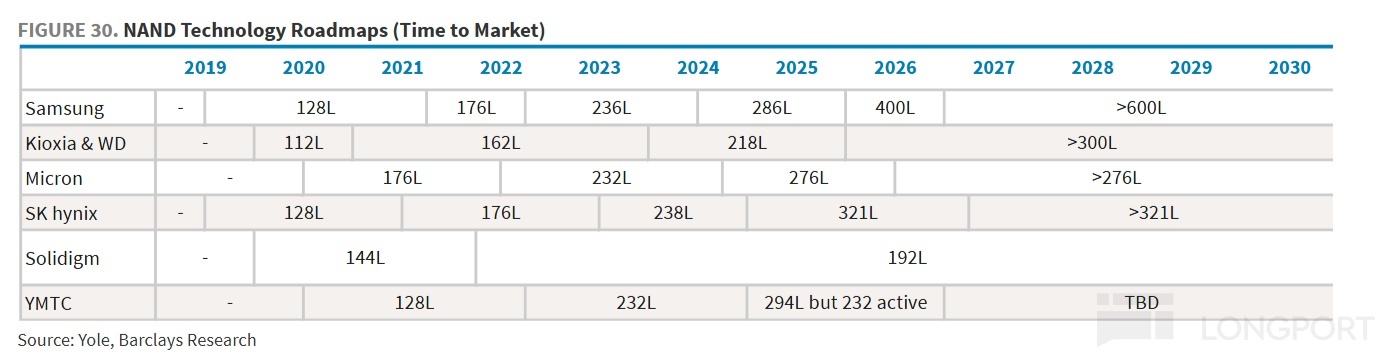
On expansion via layer counts: YMTC’s 232-layer is in volume, 294-layer (Xtacking 4.0) enters volume in 2025, and 300+ layers are in R&D. This underpins higher density per wafer.
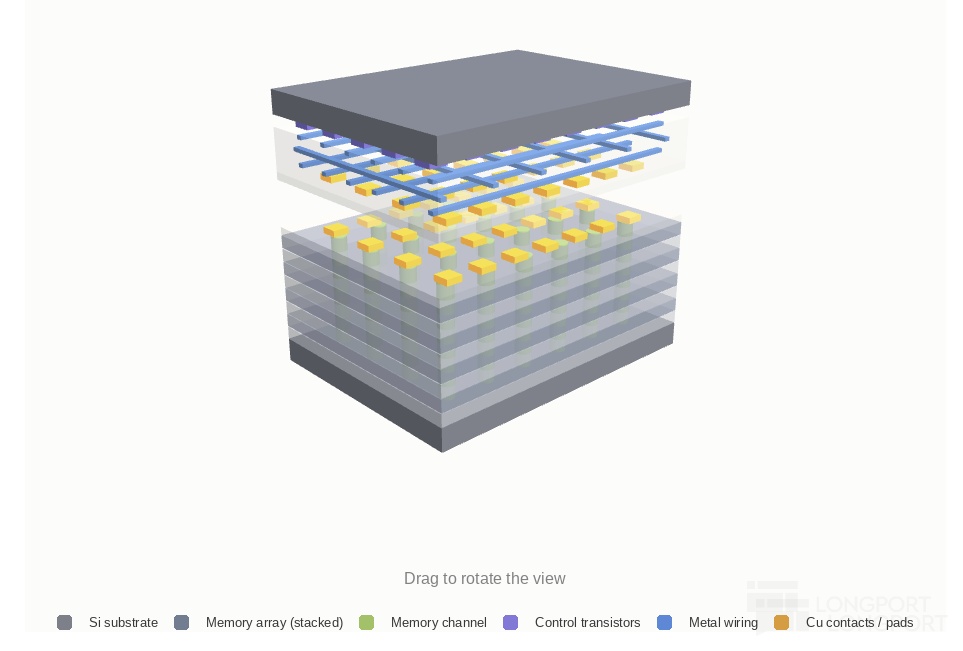
Beyond 400 layers, wafer-to-wafer copper bonding (array and control made on two wafers, then bonded face-to-face via copper pads) is becoming the mainstream route across vendors.
Samsung is pushing ~430-layer next-gen V-NAND via W2W bonding (V10 has already mass-produced 400 layers). Kioxia/SanDisk’s Gen8/Gen10 adopt CBA, and SK hynix confirmed V10 will introduce wafer bonding (mass production at Cheongju M15 by end-2026). As the route’s originator, YMTC has first-mover advantage.
b. Samsung: zero capacity growth, relying purely on layer migration Samsung channels almost all NAND capex to tech migration, keeping total output at ~395k wpm. Some 286+ layer output surfaced in 2026, and after Pyeongtaek P5 resumes, DRAM is prioritized, with NAND output no earlier than 2029 and paced by LTA progress.
c. SK hynix: near term via Dalian expansion, longer term via M17 greenfield Near-term adds come from Dalian Fab 2 (+50k wpm, mass production expected in 1H27). The new Cheongju M17 fab ($13.5bn investment) breaks ground in 2027, with little substantive output before end-2028.
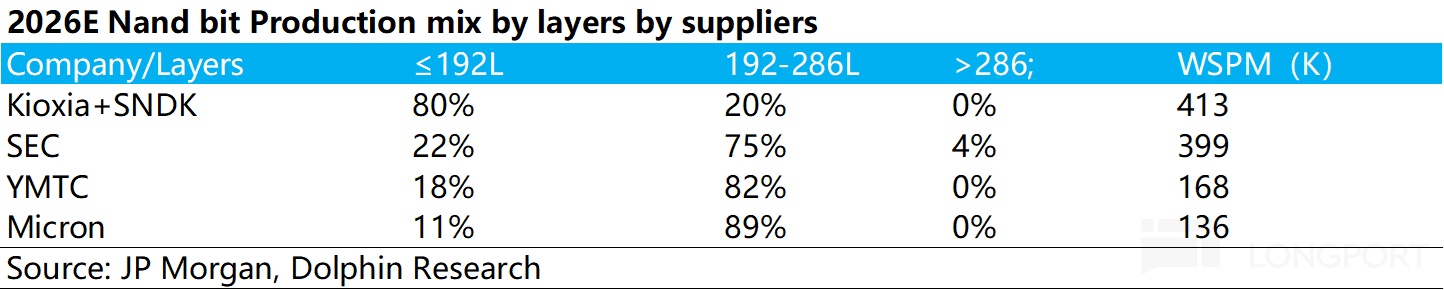
d. Kioxia & SanDisk: biggest migration elasticity in legacy lines, with new fab after 2029 Capacity rises modestly from ~390k to ~440k wpm over three years, but migration headroom is large. In 2026E, ~80% of output is still ≤192 layers, and the new northern Japan fab (>$6.3bn) won’t ramp before 2029.
e. Micron: Singapore new fab is the sole ex-China new build variable in 2028 Total capacity rises from ~100k to ~120k wpm. The Singapore fab (500+ layers) targets late-2028 start, contributing only ~20k wpm that year.
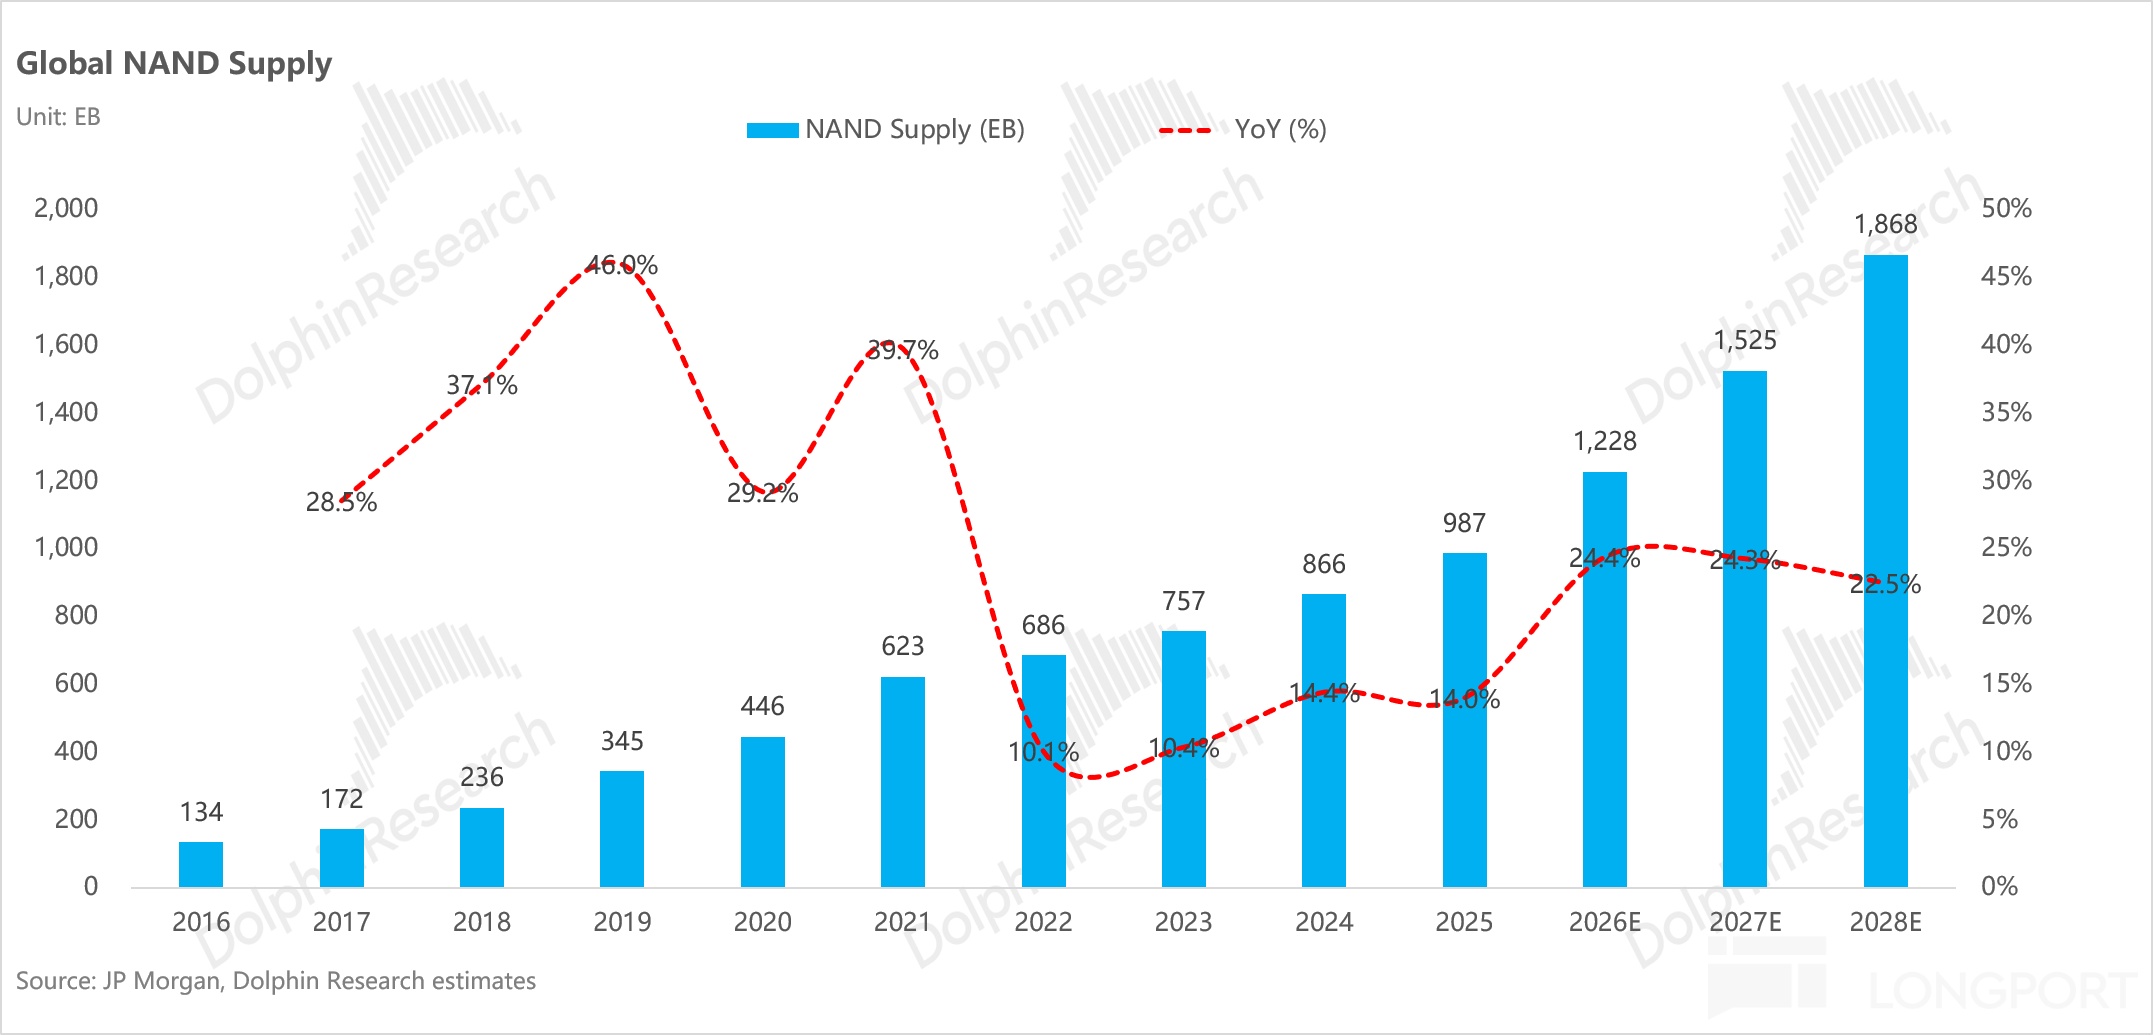
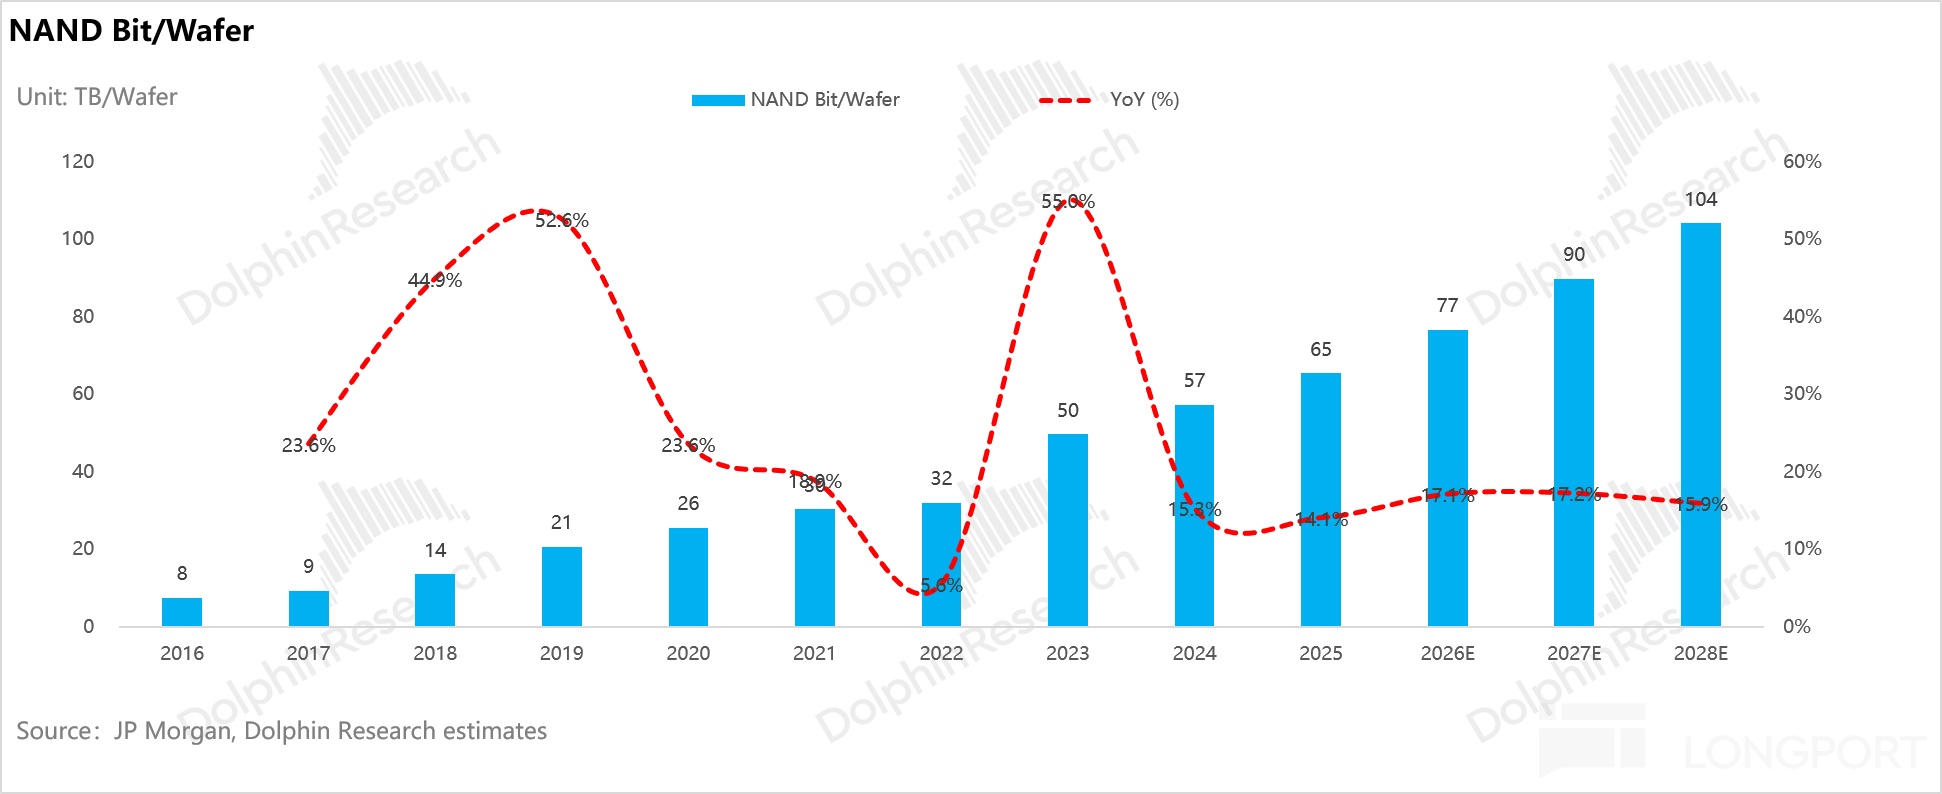
(iv) Aggregate supply: ‘trading tech for capacity’ From wafer capacity (how many raw wafers a line consumes monthly) to actual output, the key is bits per wafer. NAND bit supply = wafer capacity (wpm × 12) × bits per wafer. We estimate global average bits per wafer at ~65TB in 2025.
As NAND breaks past 300 layers (Kioxia/SanDisk BiCS10 at 332 layers, SK hynix pushing 321), we expect ~104TB per wafer by 2028, a 3Y CAGR of ~17%. Layer migration is the primary driver.
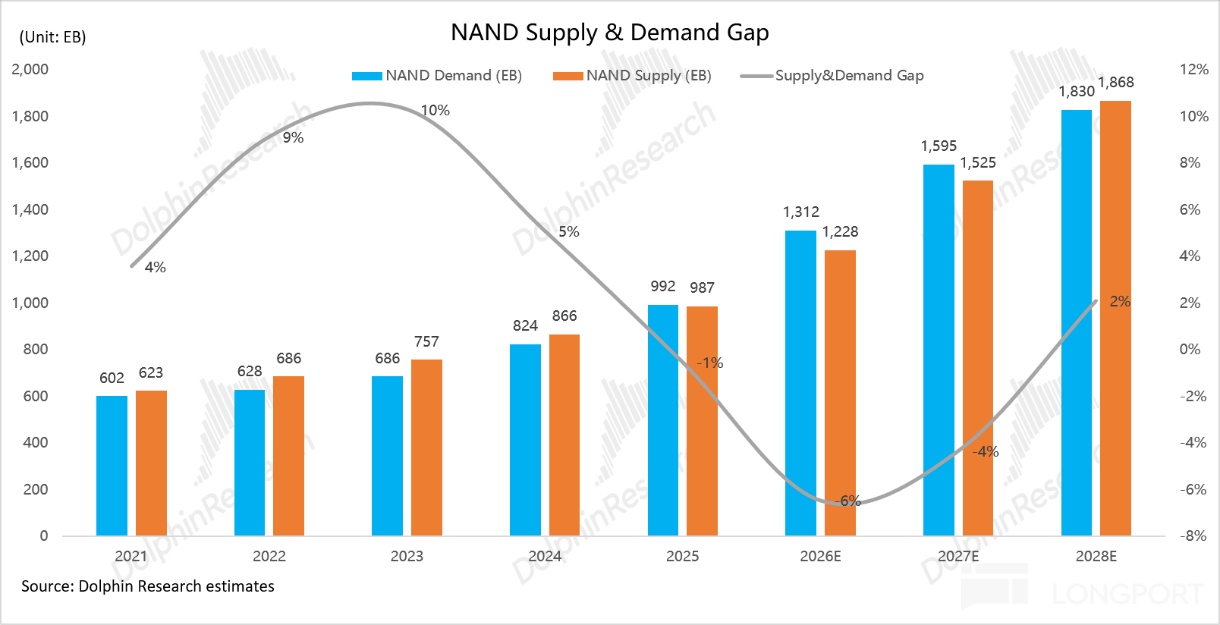
On this basis, we estimate NAND supply at ~1,228/1,525/1,868EB in 2026/2027/2028, a ~24% CAGR. About 73% of incremental supply comes from bits per wafer, with only 27% from wafer capacity growth, i.e., ‘tech-for-capacity.’
Migration headroom varies by vendor:
Kioxia+SanDisk are moving from BiCS8 (218 layers) to BiCS10 (332 layers). BiCS10 was sampled in Jul 2026 and is expected to mass-produce in mid–late 2027, lifting density by 59% vs. Gen8, offering the greatest elasticity.
Samsung jumps from V9 at 286 layers to V10 around 400 layers, with aspirations to move beyond 600 layers from 2027. YMTC’s Fab 3 introduces 294 layers (232 active), with 128-layer lines retired.
Upside supply risk lies in YMTC’s earlier-than-expected ramp and faster migration at Kioxia+SanDisk, where ~80% of bits are ≤192 layers. If migration accelerates, bits per wafer rise materially.
Downside supply risk is paradoxically demand-led. If pSLC/SLC products for AI inference staging (temporary data store pre-HBM) enter mass production in 2027–2028, they consume ~3x the capacity of normal SSDs and will tighten industry supply.
1.2 NAND demand: AI takes the baton, driving a fundamental shift in mix
Extreme supply–demand mismatch enables NAND to smooth cycles via deposits, prepayments, and LTAs. The market moves away from short orders, volume-only locks, and low breach costs.
However, we view this more as a super-cycle than a structural change in competitive moats. LTAs smooth cycles rather than eliminate them.
SanDisk’s LTA illustrates this: even with NBM LTAs, financial guarantees cover only ~18% of minimum revenue. The rest depends on customer credit, and a sharp spot decline risks renegotiation.
Since moats are unchanged, SanDisk’s value hinges on how long the mismatch lasts. The supply growth path is visible, so the next key variable is demand elasticity.
(i) AI demand structure: data lakes in 2026, NVIDIA’s storage cabinets in 2027 The inflection is 2026: DC demand is ~670EB, surpassing 50% of total NAND for the first time and displacing phones/PCs. For the next decade, AI capex will set the pace.
Behind that capex is the shift from training to inference. Three core server-side scenarios are high-frequency staging (temporary store), KV cache overflow from HBM to NAND for inference, and multi-modal data lakes.
We estimate AI servers’ NAND needs bottom-up:
AI NAND total demand = (ASIC + GPU + CPU racks + China CSP + QLC data lakes) × (1 + CSP inventory buffer). We infer chip shipments from TSMC CoWoS capacity, convert to tray counts at 4 chips/tray, and multiply by eSSD per tray.
Storage configs vary widely by platform:
The pivotal factor is memory architecture — HBM/DRAM capacity onboard and whether compute and storage are decoupled. That drives SSD requirements.
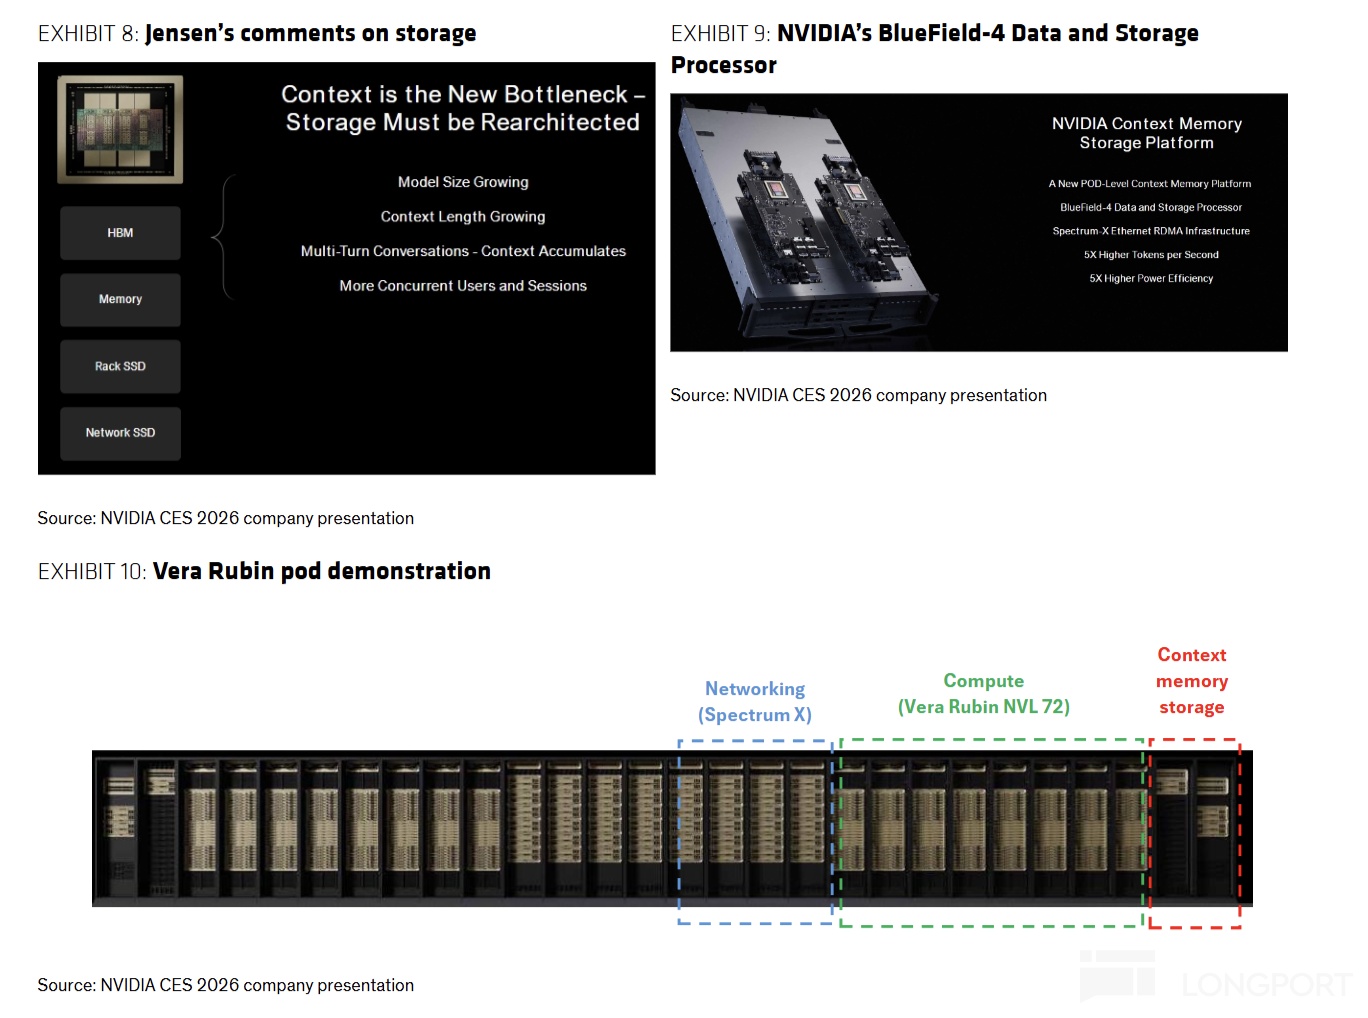
a. NVIDIA: compute–storage decoupled, with demand shifting to standalone cabinets NVIDIA has the thickest memory hierarchy. For Vera Rubin NVL72, a rack houses 20.7TB HBM (72 Rubin × 288GB) plus 54TB LPDDR5X (36 Vera CPUs), absorbing most KV cache in memory tiers.
NVIDIA’s approach is to keep base SSDs on compute trays while offloading bulk storage to a separate shared layer (ICMS for inference context). Its NAND stack has three main layers.
Layer 1: base in-rack config (18TB): Blackwell and Rubin standardize at 18TB per tray (4 GPUs), used for training data loads and checkpoints. This is the baseline.
Layer 2: Blackwell add-on (+46TB): 18TB is insufficient for multi-tenant inference, so customers often add ~46TB to reach 64TB/tray. But this is a transitional fix.
In Rubin, this demand shifts to CMS cabinets. When Rubin becomes the workhorse in 2027, in-tray add-ons will shrink sharply.
Layer 3: Rubin-era STX CMS context storage: This is the largest structural increment in 2027. As long-context inference proliferates, HBM/DRAM cannot hold massive KV caches, so NVIDIA introduces ICMS — shared cabinets of SSDs spanning the compute cluster.
Every 4 NVL72 racks share 1 CMS cabinet, each with 8 trays at 600TB/tray. That equates to ~16.7TB of extra NAND per Rubin GPU, roughly 4x Blackwell’s practical config.
By 2027, this layer will drive over 70% of NVIDIA’s NAND demand. It becomes a core driver alongside data lakes.
Layer 4: standalone Vera CPU racks. These address Agent workloads on CPU cores, with each Vera CPU provisioned with 8TB of NAND storage per rack.
b. In-house ASICs: thinner memory stacks require thicker SSD configs Cloud ASIC SSD configs diverge materially.
Google TPU: Onboard HBM (e.g., TPU v7 at 192GB per chip) allows only 16TB per tray. Per-node storage is the lowest, but shipment scale makes TPU over half of ASIC storage demand.
AWS Trainium: Onboard HBM at 144–288GB (Trainium3 at 144GB, Trainium4 at 288GB) supports training and inference, with ~32TB per tray. That is 2x Google’s tray configuration.
Meta MTIA: Early MTIA v2 is the only ‘no HBM’ approach, with just 128GB LPDDR5 per chip and ~512GB total tray memory. Recommender systems need TB-scale embedding tables, so SSDs extend memory.
MTIA trays thus provision ~64TB, fully 4x Google’s. The delta is architecture-driven, not merely preference.
c. AMD and others
AMD trays are standardized at 64TB across generations. China CSPs: capex implies demand of ~50/120/180EB in 2025/2026/2027.
QLC data lakes: per SanDisk’s disclosures, we assume ~25% of total NAND demand. Inventory buffer: in up-cycles, cloud buyers typically hold ~10% extra, so we multiply aggregate by 1.1 from 2026.
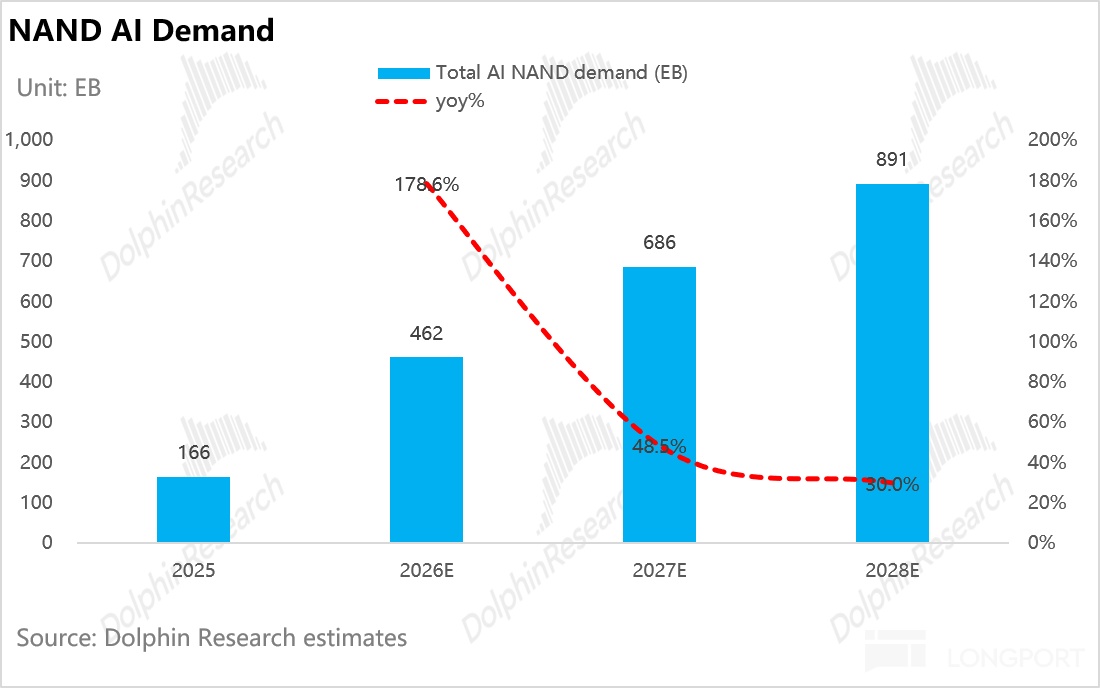
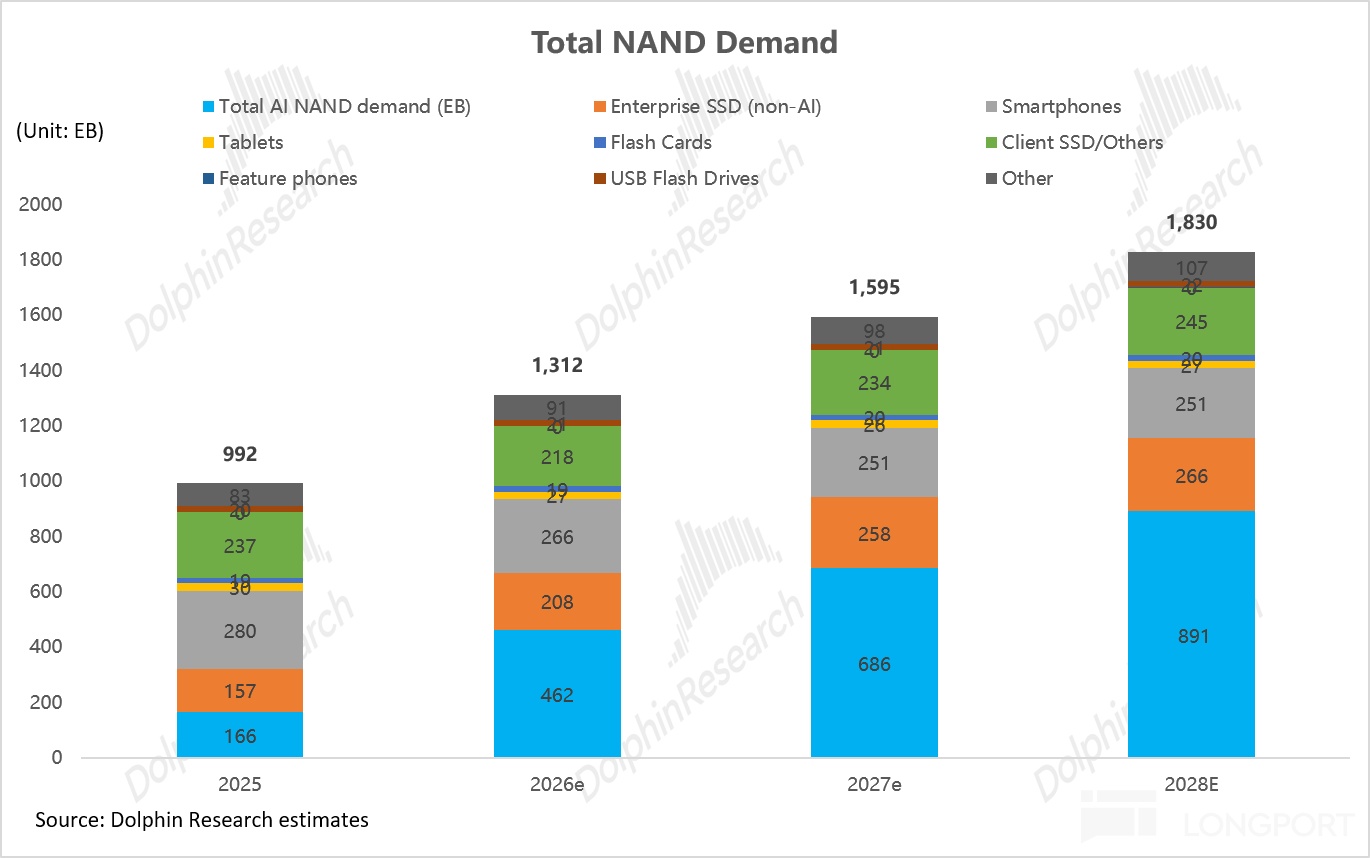
Aggregating the above, global AI NAND demand is ~462/686/891EB for 2026–2028, a 75% 3Y CAGR.
The 2026 surge is led by QLC data lakes, China CSP scaling and restocking, plus in-tray storage growth. In 2027, NVIDIA takes the baton — Rubin’s STX CMS context cabinets become its main NAND engine, alongside QLC data lakes as twin global drivers.
(ii) Non-AI demand: enterprise resilient, consumer under pressure
Non-AI enterprise SSDs benefit from general server refresh cycles. North American cloud inference roll-outs also lift units and pricing in general-purpose servers.
We expect growth of ~32.5%/~24.0% in 2026/2027, easing to ~3% in 2028. The near-term remains solid.
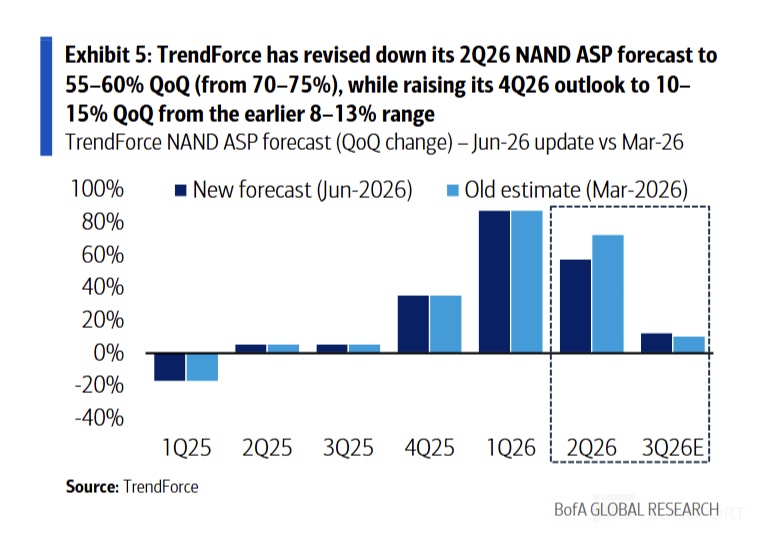
Consumer is heavily squeezed: TrendForce reports 2Q26 NAND contract prices up 55%–60% QoQ, forcing PC/phone vendors to cut storage capacities. Storage now accounts for 30%–50% of BOM in PCs/phones, 2–4x early-2025 levels.
OEMs are trimming shipment plans while freezing or shrinking per-device capacity. Allocations also shift.
On supply, vendors prioritize LTA-bound cloud buyers, and inference server demand is crowding out non-server customers’ quotas.
Dolphin Research estimates consumer/other NAND demand down ~4.0% in 2026. Client SSD demand falls ~8% in 2026 and rebounds ~7% in 2027 off a low base.
Smartphone NAND slides ~5%–6% in both 2026 and 2027, stabilizing only in 2028. The mix tilts to DC.
As a result, DC (AI + enterprise) exceeds 50% of total NAND demand in 2026 (51%), rising to ~63% by 2028. The cycle will likely bifurcate.
AI and enterprise products should stay tight under LTA support, while consumer pricing may peak earlier.
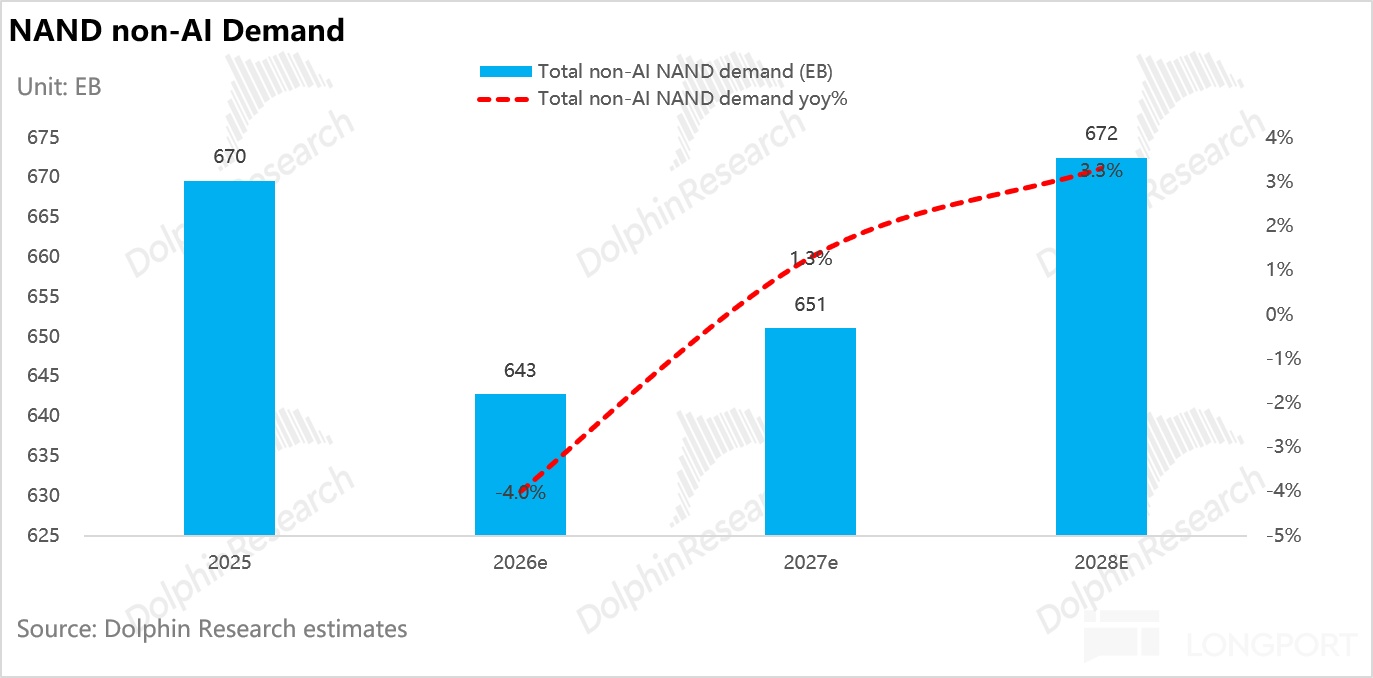
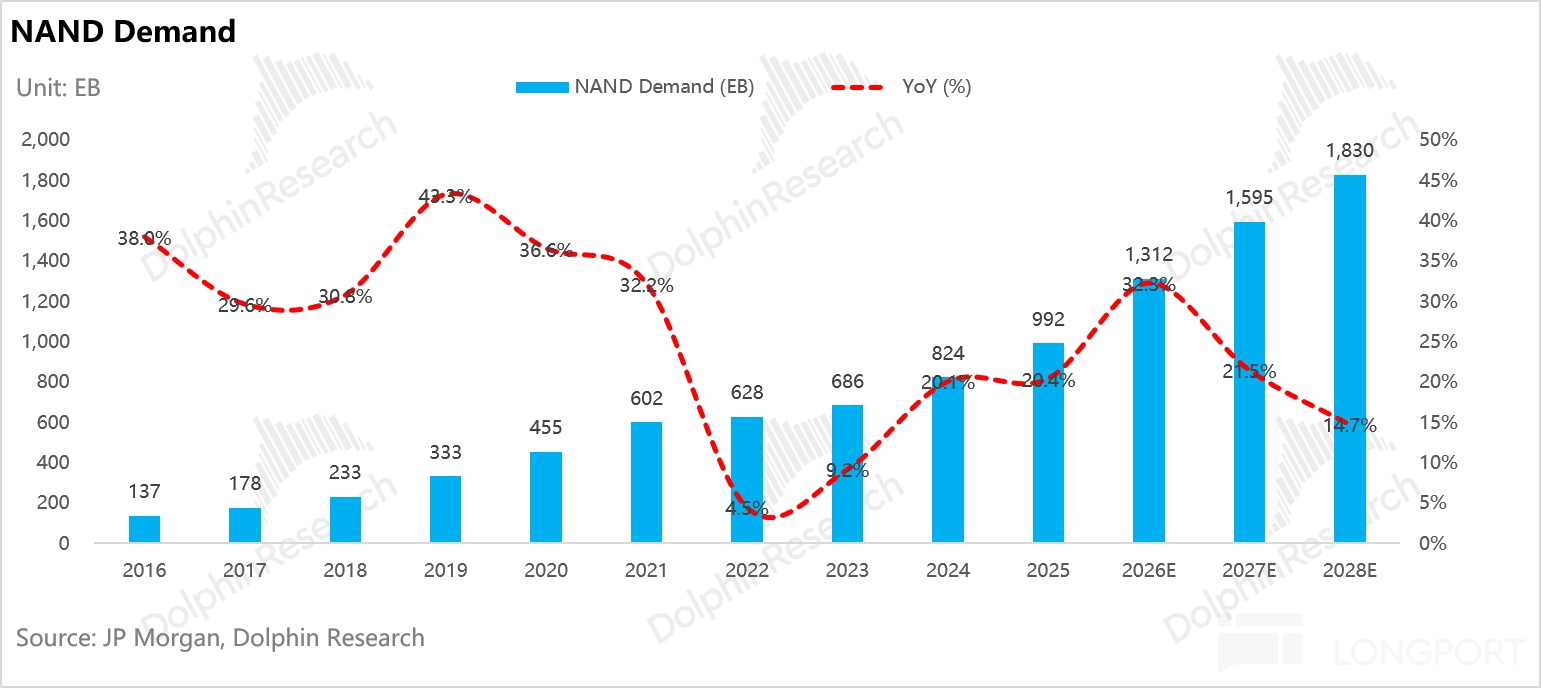
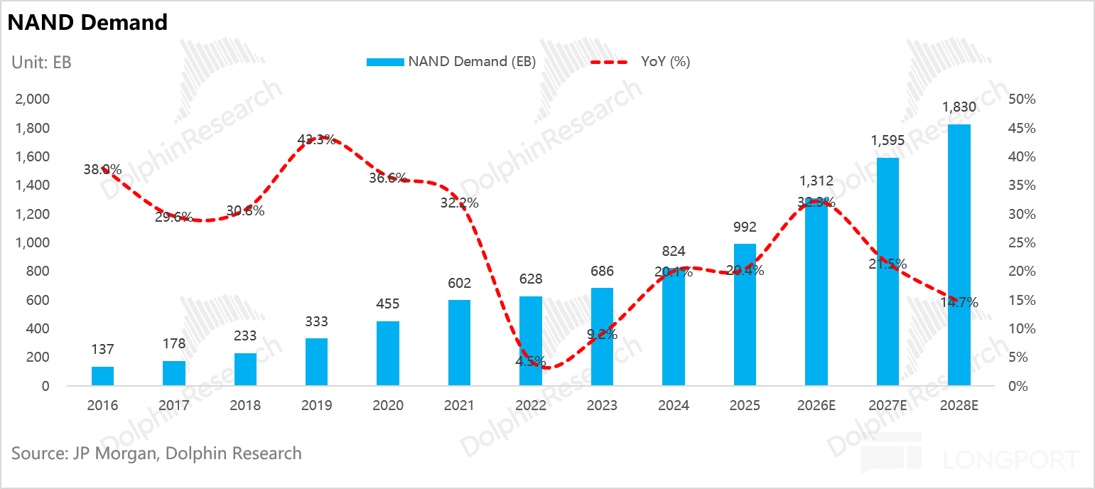
In total, global NAND demand is expected to rise from ~992EB in 2025 to ~1,830EB by 2028, a ~23% CAGR. That outpaces ~13% over 2021–2025.
Growth is almost entirely AI-driven. AI NAND demand rises from ~166EB to ~891EB, a 75% 3Y CAGR, contributing ~87% of incremental demand; non-AI grows only ~4% CAGR.
Structurally, DC exceeds 50% in 2026, and by 2028 server (AI + traditional) is ~60% of total. Within that, AI servers rise from 17% in 2025 to 49% in 2028.
Summary: will supply–demand flip in 2028?
Consolidating both sides: The NAND bit gap is ~6% in 2026 and still tight in 2027 at ~4%. The market remains firm through 2027.
2028 is the watershed. Supply certainty rises (YMTC new fab ramps), and unless new demand drivers emerge (e.g., CSP capex continues to surge, or edge AI breaks out), oversupply is likely and the price cycle should end.
2. At current valuation, does reborn SanDisk still have upside?
On this basis, we expect the super-cycle to likely extend through end-2027. From 2028, the balance loosens, and with overseas new capacity clustering in 2029, prices should retreat visibly.
Our outlook for SanDisk (fiscal year-end Jun; FY27 spans Jul 2026–Jun 2027, etc.):
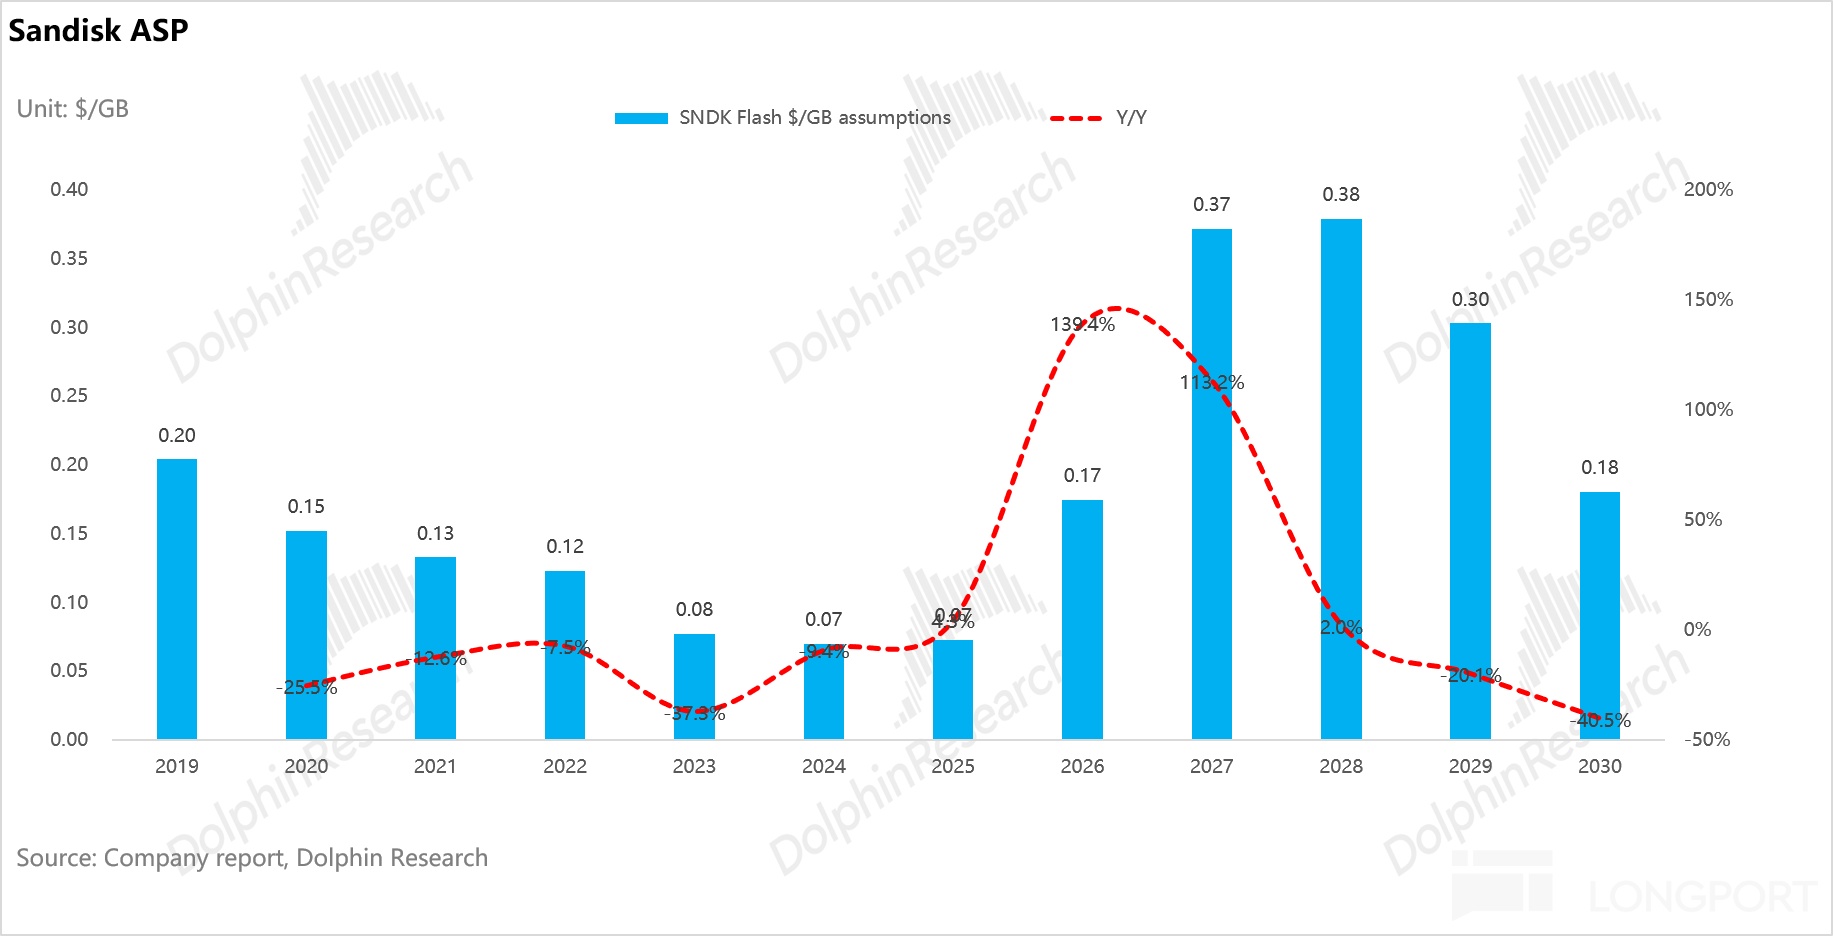
(i) ASP: peaks in FY28, with LTAs cushioning downside Management guides FY27 ASP rising modestly QoQ, with FY28–FY30 revenue up ~15%–19% in line with bit growth. This implies flat unit pricing over three years, with cycles fully ‘smoothed’ by LTAs — an extremely optimistic assumption.
We instead expect pricing to peak in FY28 and fall notably in FY29–FY30:
FY27 (modest rise): ASP ~$0.37/GB (+113% YoY). FY26 Q4 averaged ~$0.31/GB, spot is ~$0.44, and 2027 still has a ~4% supply gap, but LTA caps limit upside, yielding modest QoQ lifts.
FY28 (peak and turn): ASP ~$0.38/GB (+2% YoY), peaking within FY28 (2H27–1H28). As YMTC Fab 3 ramps and the balance loosens, pricing starts to roll over in 2H FY28.
FY29–FY30 (cyclical decline): ASP down ~20%/~40% YoY to ~$0.18/GB by FY30, returning to 2026 levels. This reflects oversupply and clustered new capacity at Samsung P5, Kioxia/SanDisk’s northern fab, and SK hynix M17 from 2029.
Even then, FY30 ASP is ~2.5x FY25 ($0.07/GB), supported by:
a) NBM price floors (full-cycle minimum contract revenue $93.9bn, with $16.5bn guaranteed). b) DC share of NAND demand rising to 63% in 2028, lifting the blended price floor via higher-value customers.
(ii) Shipments: driven by process migration
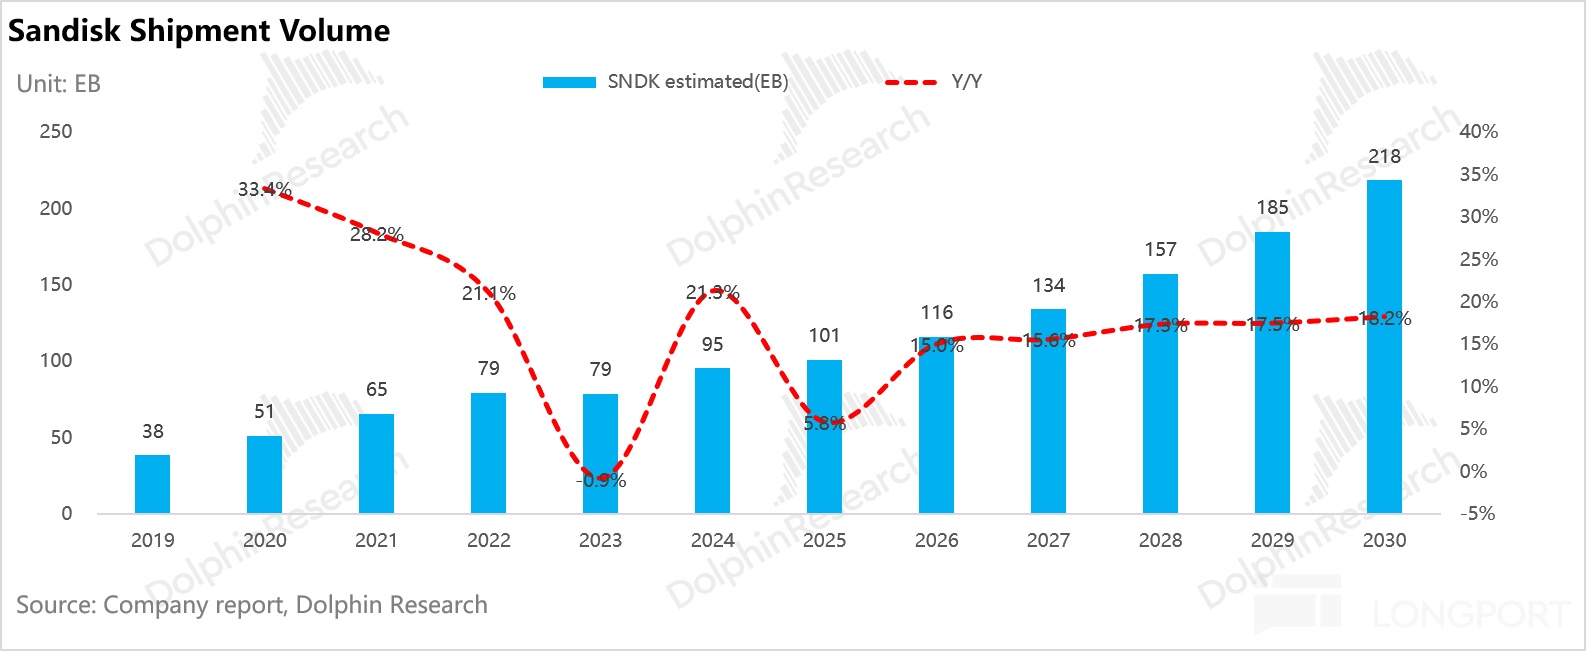
At Investor Day, management cut FY27 saleable bit growth from mid-to-high-teens to mid-teens (~15%) to reserve inventory for NBM LTAs. Bit growth is driven by migration rather than new wafer starts.
We expect SanDisk bit shipments to rise from 116EB in FY26 to 218EB in FY30, a ~17% CAGR. The main lever is BiCS8 to BiCS10 migration (BiCS10 mass production mid–late 2027), with the northern fab ramping after 2029.
NBM LTAs likely cover ~1/2 of FY27 shipments and ~2/3 of FY28. Volume visibility is high.
(iii) GPM: high margins at risk if oversupply emerges
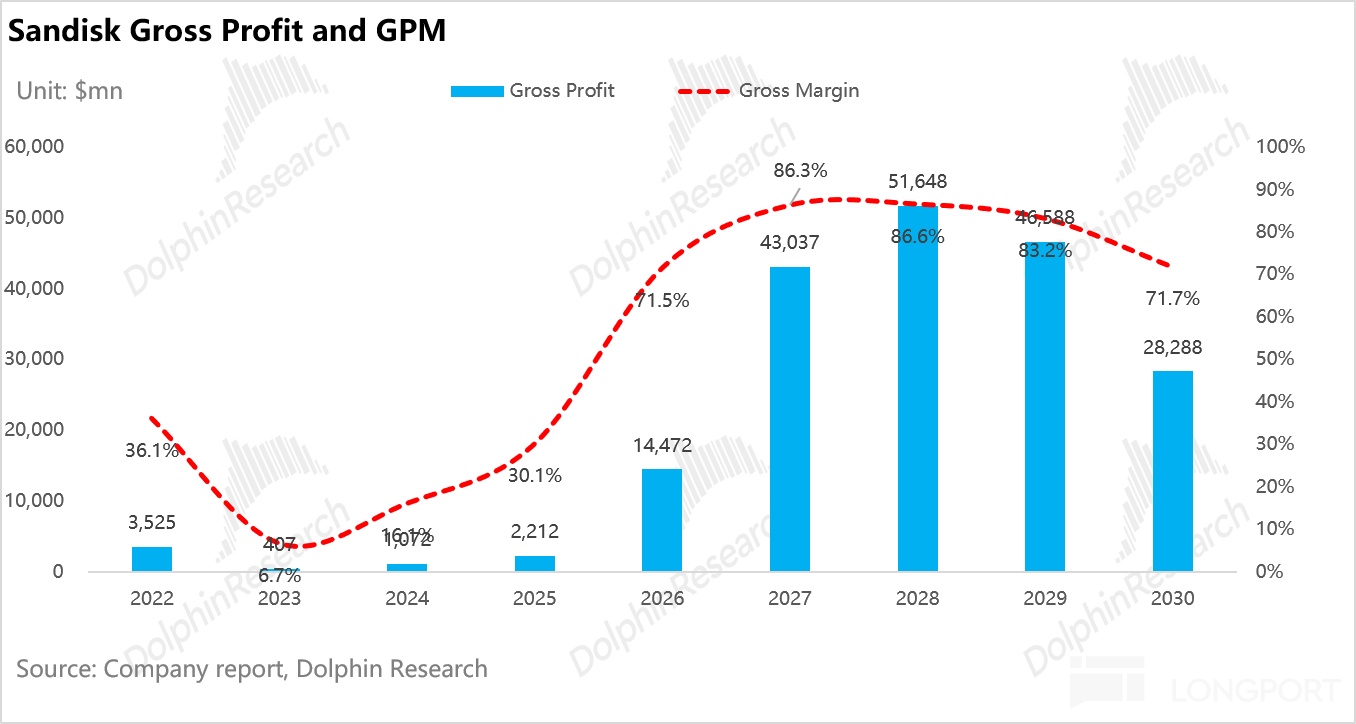
Management guides non-GAAP GPM at ~80% for FY28–FY30, contingent on stable ASPs. If prices turn down, margins could retreat quickly.
Historically, NAND often swings from shortage to surplus, and maintaining 80% GPM through a full cycle is rare. While NBM LTAs provide a floor, guarantees cover only ~18% of minimum revenue and the rest hinges on customer credit; spot crashes can trigger renegotiation.
We therefore assume unit cost at ~$0.051/GB in FY27–FY30 (excluding BiCS10 cost-down) to absorb new line depreciation, yield ramp, and raw material inflation. GPM peaks at ~86.6% in FY28, then declines annually with ASPs, reaching ~72% in FY30.
(iv) Profit debate: can the cycle be fully ‘smoothed’?
On opex, management guides FY28–FY30 OpEx at ~5% of revenue and non-GAAP OPM at ~75%. We expect OPM to peak at ~82% in FY28 and retreat to ~65% in FY30, with a ~75% three-year average.
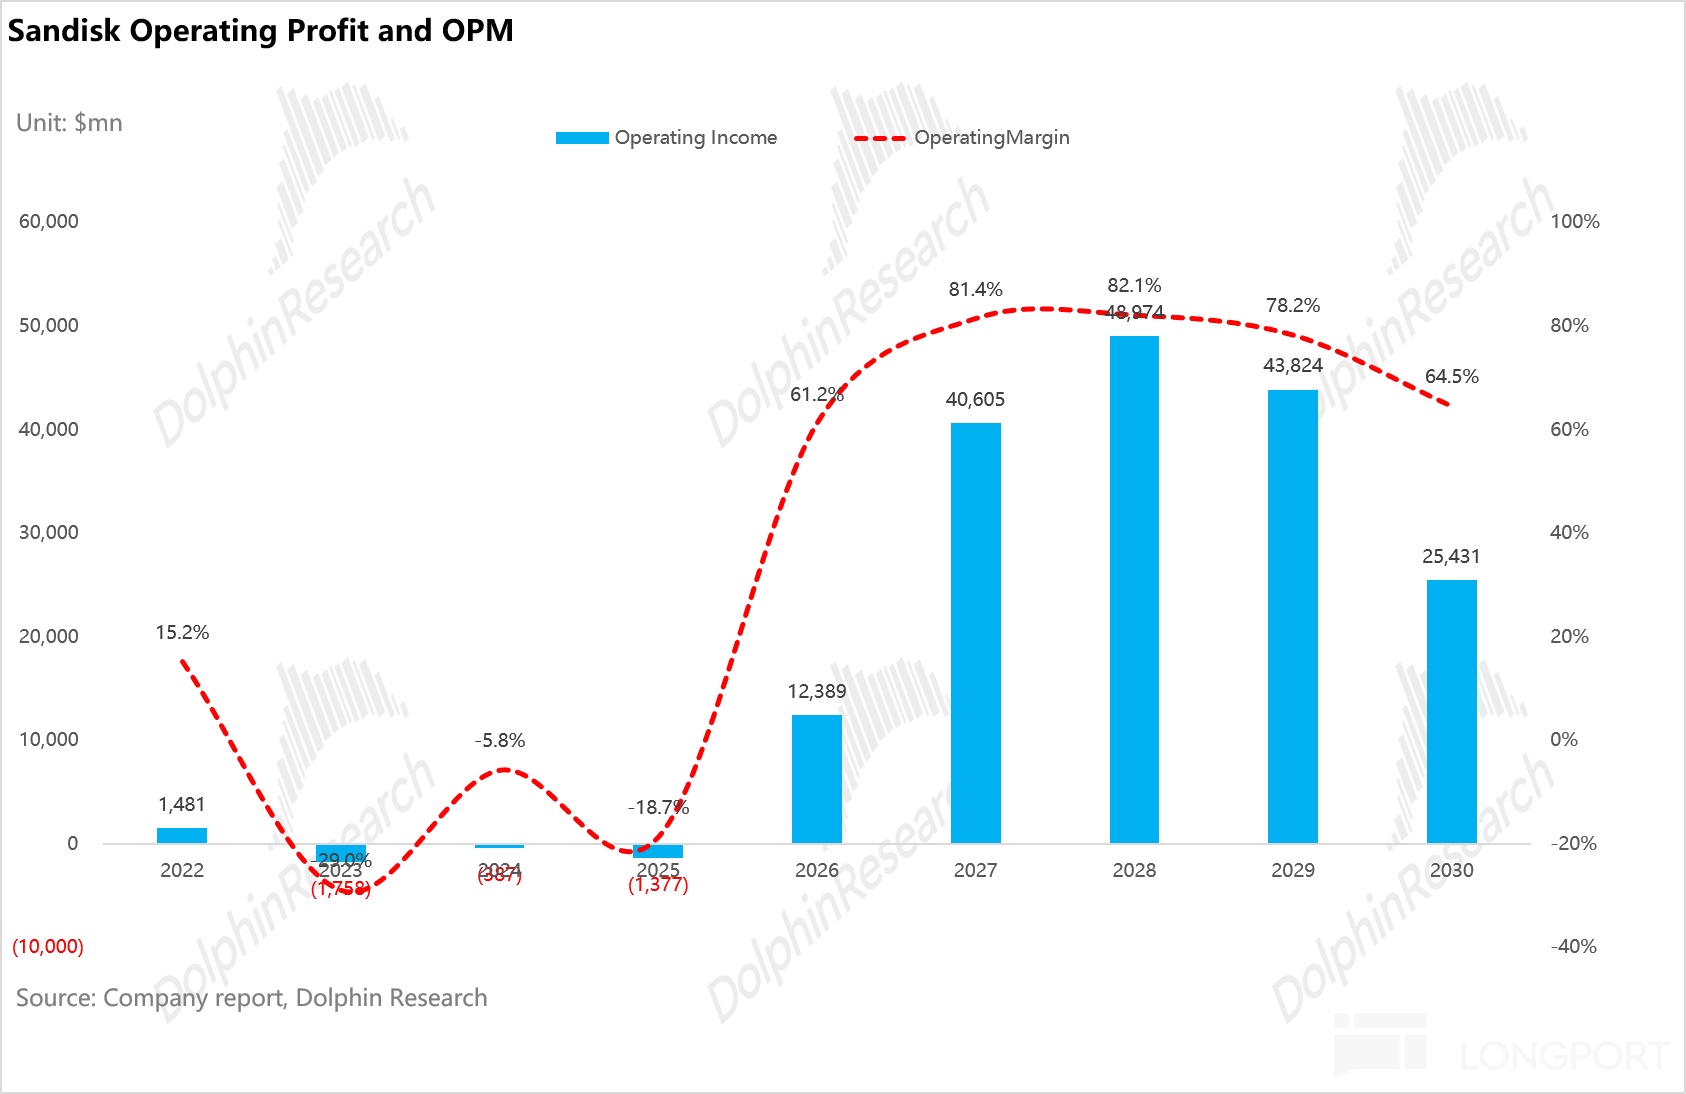
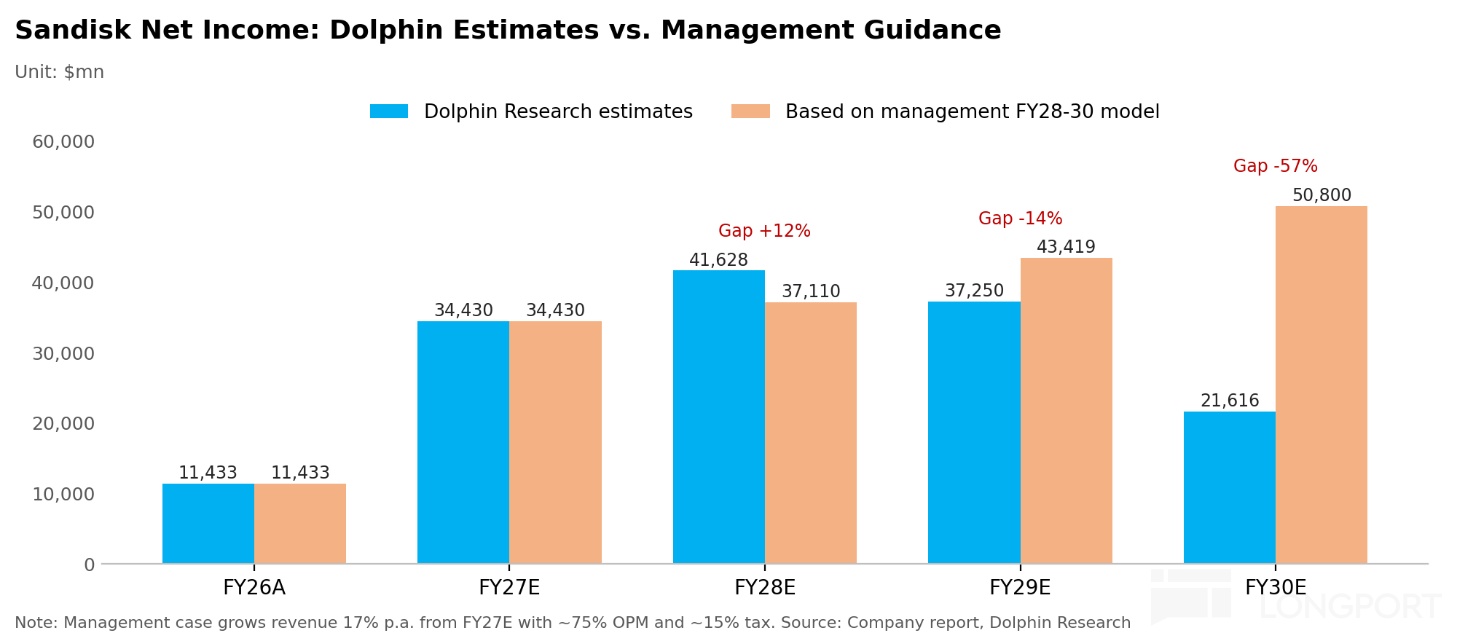
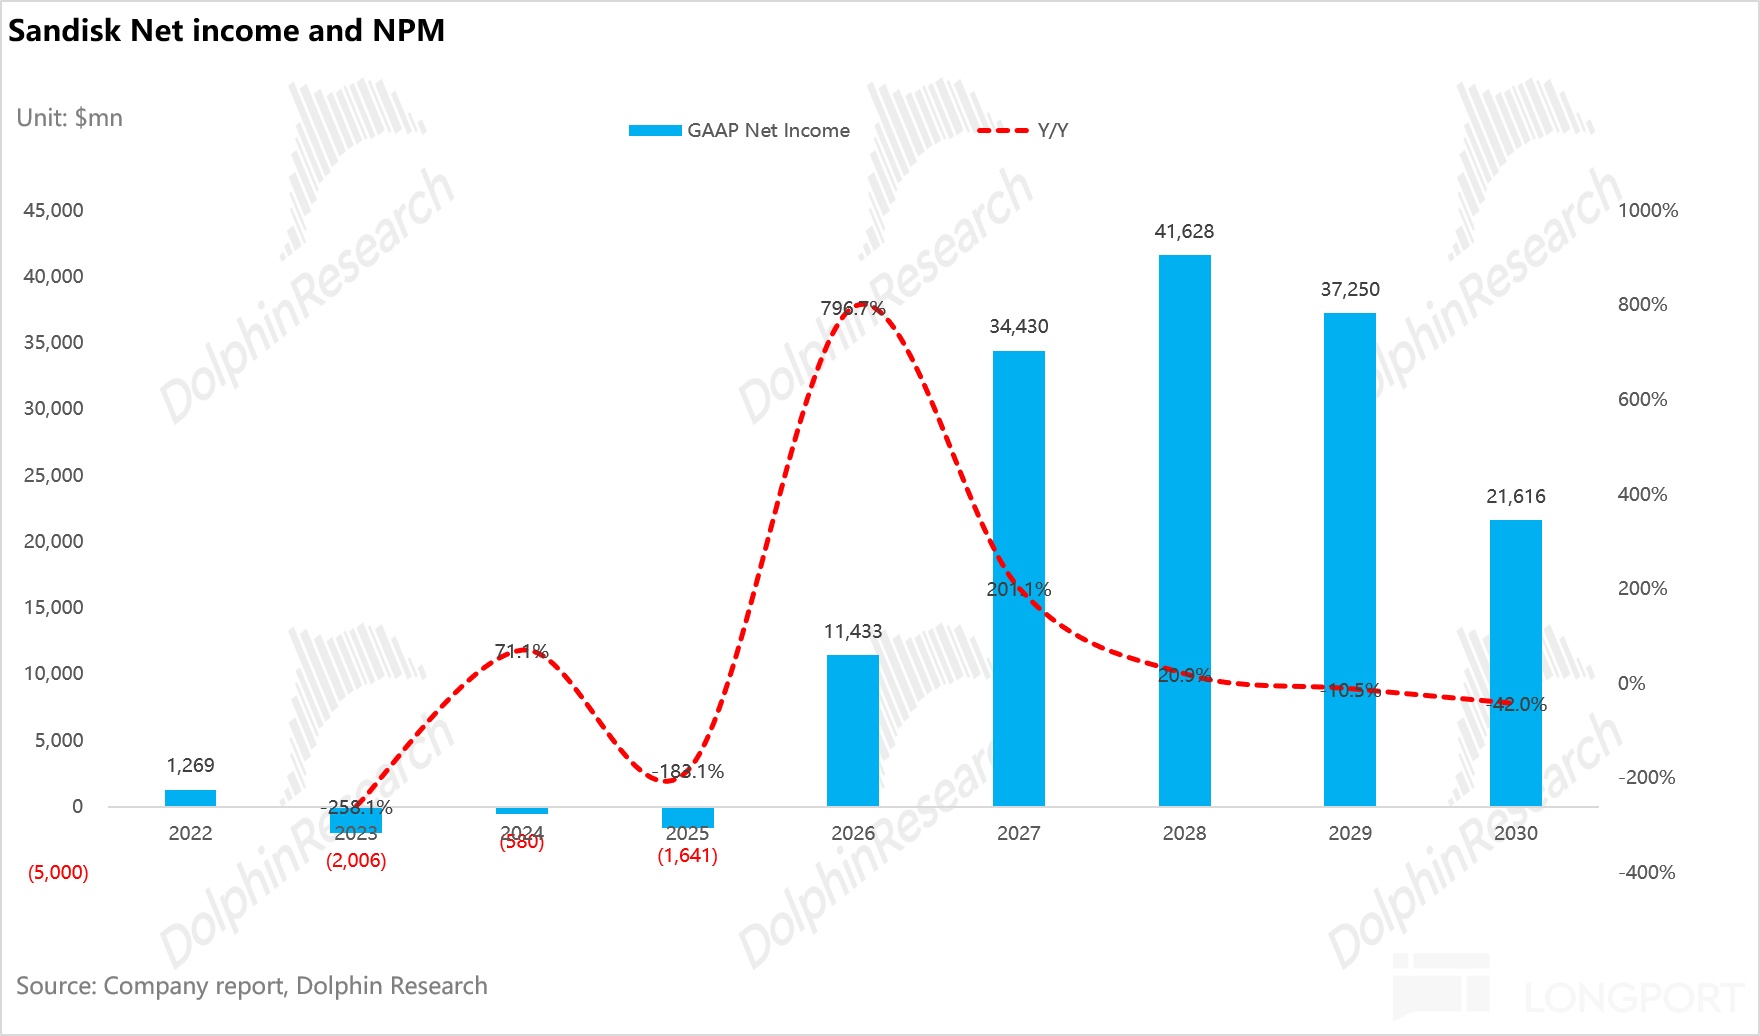
With a ~15% tax rate, we estimate net profit peaking at ~$41.6bn in FY28 and falling to ~$21.6bn in FY30. That is only ~43% of management’s implied ~$50.8bn.
Under management’s smoothing model: starting FY27E, revenue grows ~17% annually (no ASP decline), non-GAAP OPM ~75%, and net profit rises from ~$34.4bn in FY27 to ~$50.8bn in FY30. This requires both LTA floors and AI demand digesting post-2029 additions.
Valuation: super-cycle or just another cycle
SanDisk is a cyclical growth stock with volatile earnings. A classic ‘peak EPS × low multiple’ approach is highly sensitive to the peak year and ignores the deep trough.
We therefore anchor on ‘cross-cycle net profit × mid-cycle multiple’ and cross-check via DCF. This better captures downside.
Cross-cycle net profit is the FY22–FY30 average (~$15.9bn), covering the last trough (FY23–FY25), the AI super-cycle (FY26–FY28), and the downshift (FY29–FY30). This offers a balanced lens.
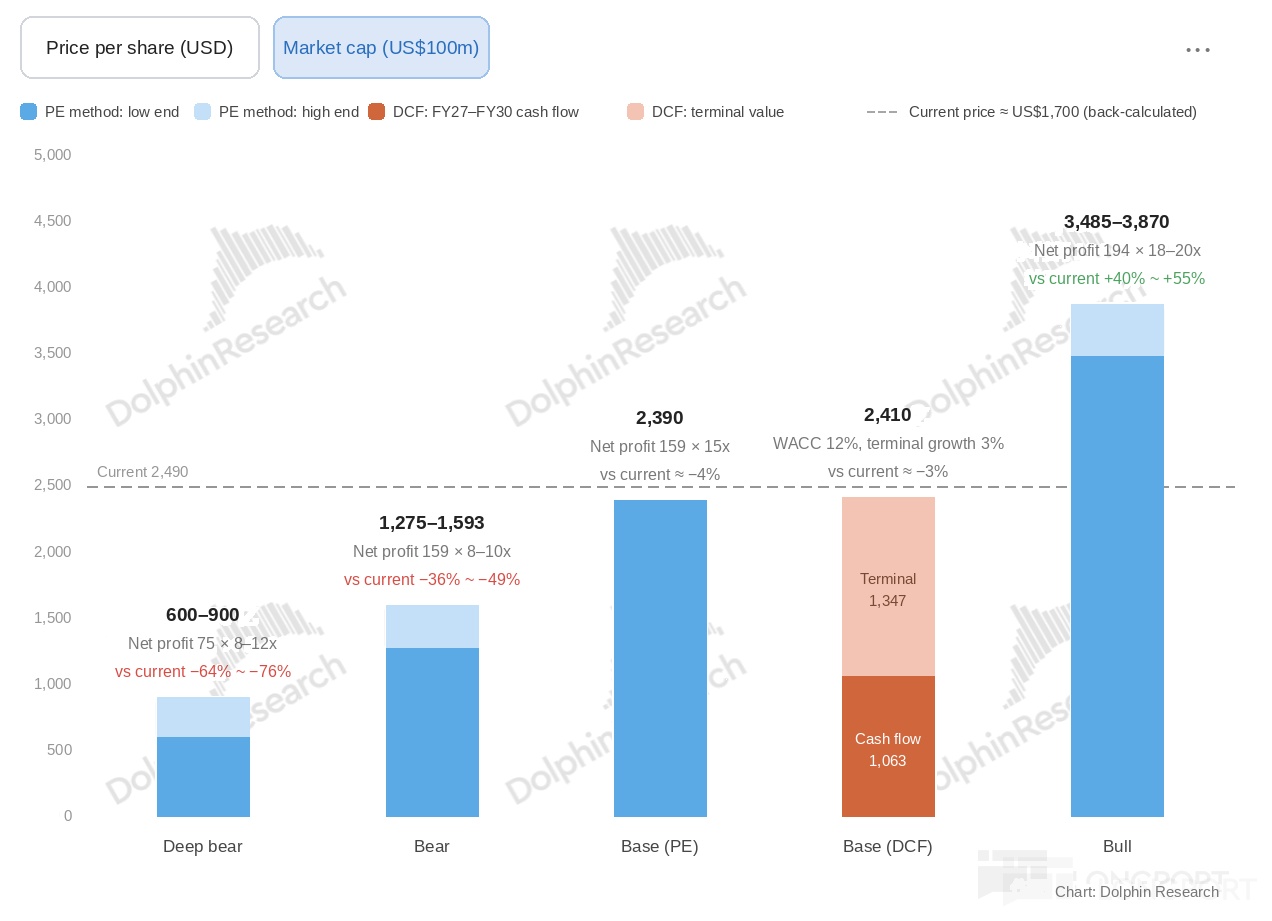
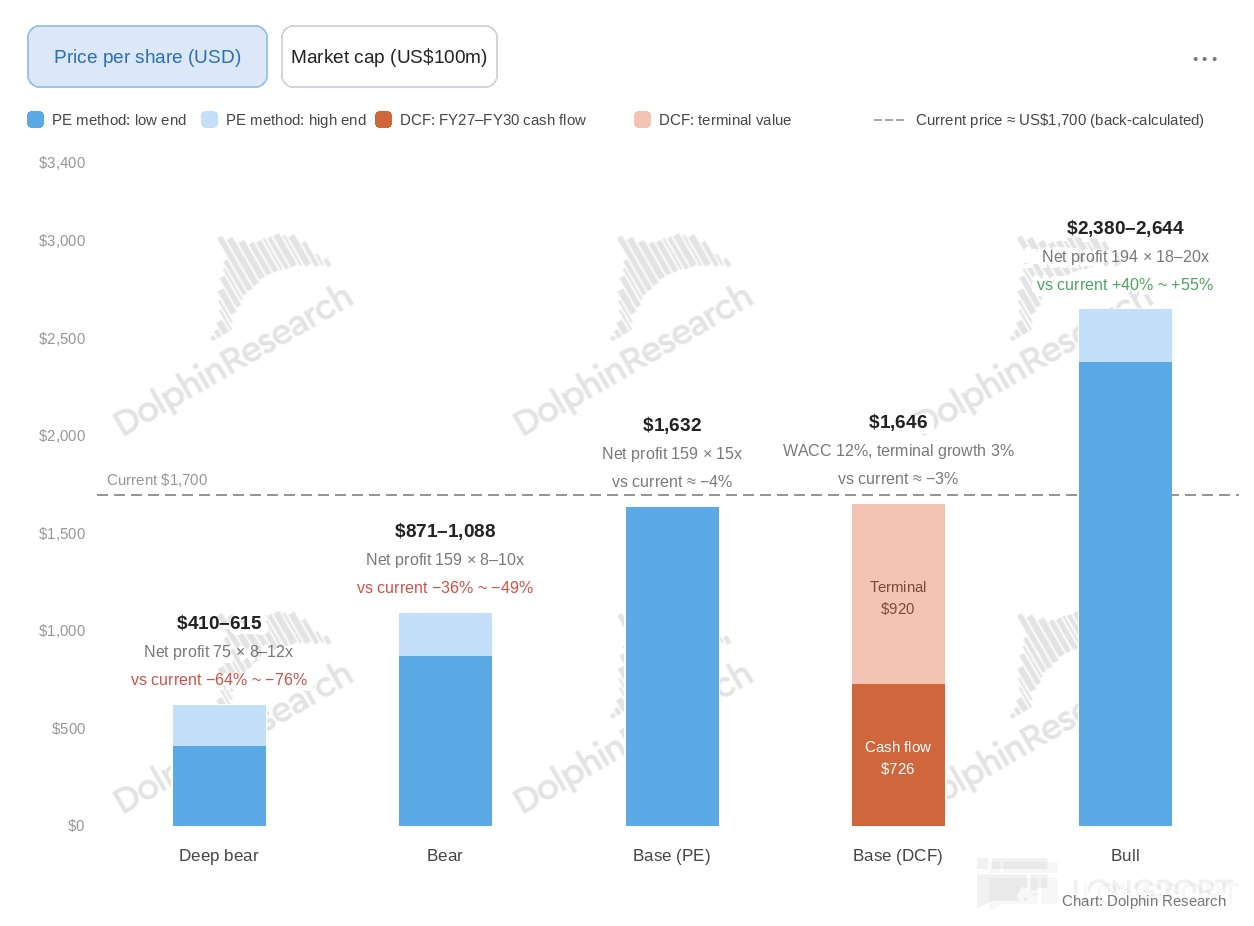
a. Base case (share price ~$1,632): our benchmark view
Assumptions: bit gaps of ~6% in 2026 and ~4% in 2027, ASP peaks in FY28, and oversupply post-2028. With NBM floors, FY30 GPM remains ~72%.
Valuation: 15x cross-cycle net profit implies ~$239bn mkt cap (~$1,632/sh). That is ~5.7x FY28 peak net profit.
DCF cross-check: FY27–FY30 cumulative FCF is ~$139bn, discounted at 12% WACC to ~$106.3bn. Perpetuity starts from cross-cycle avg. FCF (~$18bn) at 3% growth, discounted to ~$134.7bn. Total ~$241bn, aligning with PE-based value.
b. Bear case (share price ~$871–$1,088): earnings realized, but multiple de-rated
Assumptions: Earnings track our forecasts, but oversupply signs emerge in 2028 and spot declines. The scissors spread raises LTA performance concerns (guarantees cover ~18% of minimum revenue), and markets won’t pay a premium for LTA certainty.
Valuation: The market prices this as a one-off super-cycle, assigning 8–10x cross-cycle net profit (memory’s historical trough range) for ~$127.5–$159.3bn mkt cap. That is only ~3–3.8x FY28 peak net profit, implying ~36%–49% downside vs. current.
Extreme bear: If tightness ends by 1H27, FY27–FY30 ASPs drop to ~$0.31/$0.22/$0.13/$0.10, bit growth slows to ~12%–15%, and LTAs are renegotiated, net profits fall to ~$26.5/$18.7/$8.8/$5.5bn. FY30 GPM would slide to ~49%.
FY22–FY30 avg. net profit would be only ~$7.5bn, less than half our base-case ~$15.9bn. At 8–12x cross-cycle, mkt cap would be ~$60–$90bn (~$410–$615/sh), ~64%–76% below current, at ~2.3–3.4x FY27 peak net profit.
Dolphin Research sees low probability for this extreme, but it illustrates true downside if the cycle flips.
c. Bull case (share price ~$2,380–$2,644): management’s ‘smoothed cycle’ realized
Assumptions: AI inference demand beats, Rubin CMS cabinets and QLC data lakes scale fast, and pSLC/SLC mass introduction absorbs capacity, digesting post-2029 additions. NBM renewals proceed smoothly with higher coverage, ASPs flat in FY28–FY30 and GPM stable at ~80%.
Valuation: Net profit grows to ~$50.8bn by FY30, with cross-cycle at ~$19.4bn. Assigning 18–20x yields ~$348.5–$387bn mkt cap (~6.9–7.6x FY30E net), implying ~40%–55% upside from current.
Delivering this bull case relies more on AI driving sustained upside surprises in storage demand than on SanDisk alone. NAND’s fundamental barriers are not high, with 80% margins drawing new lines if demand keeps exploding.
By contrast, our base case expects capacity gains mainly via layer migration, not aggressive new lines. This makes the bull case challenging to sustain.
Conclusion: long-term hinges on new AI scenarios; near- to mid-term is a trading range
Risk–reward looks symmetric, with ~40%–55% upside vs. ~36%–49% downside. Tail risks (e.g., tightness ending by 1H27) widen the downside.
Overall, we view SanDisk’s current valuation as broadly fair, largely reflecting the base case. Near-term margin of safety is limited.
Further upside depends on the market believing and validating ‘no price collapse post-2028’ — i.e., management’s smoothing model. Before that, a pullback below base-case fair value (~$1,632/sh) would offer better odds and risk–reward.
<End here>
Risk disclosure and statement: Dolphin Research Disclaimer and General Disclosure
Updated analysis:
I. Dolphin Research AI storage series
DRAM industry:
‘Storage Power Takes the Baton from Compute: Why HBM Stands Out’
‘From HBM Caps to NAND Scale: NVIDIA vs. Storage Power — Who Controls Whom?’
Single names:
SanDisk (Part I): ‘AI Inference Boom: Can ‘Unlucky’ SanDisk Rise Like a Phoenix?’
SanDisk (Part II): ‘NAND’s Innate ‘Fertility’: How SanDisk Defends 80% GPM?’
SanDisk (Part III): 'From Sidekick to Center Stage: How AI Inference Can Rewrite NAND’s Fate'
II. Dolphin Research AI DC interconnect series:
CPO industry
‘AI in the Hyper-Connect Era: Racing Toward Light?’ ‘‘Copper’ Bull Stays: CPO — Real Opportunity or Mirage?’
Network architecture
NVIDIA networking: ‘AI-Era DC Interconnect: Beyond Single Chips, Fighting as a ‘Net’ — Is There a China Opportunity?’
DC networking — AMD vs. NVIDIA: ‘AMD Challenges NVIDIA: Is Helios Up to the Task?’
Google networking: ‘Challenging NVIDIA’s Dominance: What Gives Google’s ‘Optical Network’ Its Edge?’
Single names
Lumentum (Part I): ‘From Optical Interconnect Veteran to ‘All-Around Water Seller’: What Sets Lumentum Apart?’
Lumentum (Part II): ‘Lumentum: Capacity Crunch — Any Remaining Secret Sauce for the ‘All-Around Water Seller’?’
III. Dolphin Research AI XPU series
Agents and CPUs: ‘Muse Goes Viral: Is CPU Having Its ChatGPT Moment?’
...For more, follow Longbridge Dolphin Research.


The copyright of this article belongs to the original author/organization.
The views expressed herein are solely those of the author and do not reflect the stance of the platform. The content is intended for investment reference purposes only and shall not be considered as investment advice. Please contact us if you have any questions or suggestions regarding the content services provided by the platform.