Financial Analysis
D
Dolphin Research

China Mobile: Pricing slide not over; high dividend may be inflated?

China Mobile (600941.SH/00941.HK) released its Q3 2026 results after the HK close on Oct 20, 2026 (Beijing time). The report covers the period through Sep 2026.

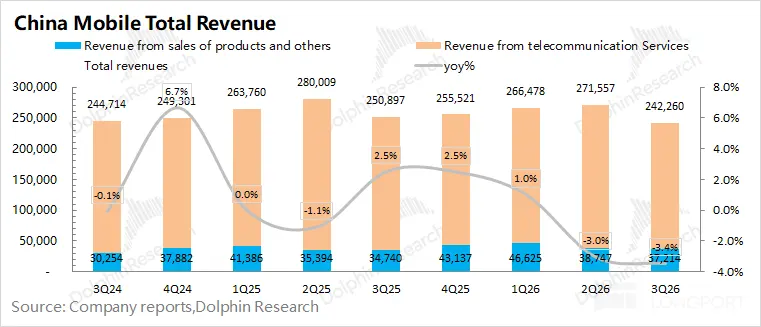
Key takeaways: 1) Operating data: $CHINA MOBILE(00941.HK) posted total revenue of RMB 242.3bn in Q3, down 3% YoY, mainly dragged by weaker telecom services. Telecom services softened due to a VAT hike (6% to 9%) and lower ARPU.

中 国移 移动 China Mobile
China Mobile Total Revenue Revenue from sales of products and others Revenue fro
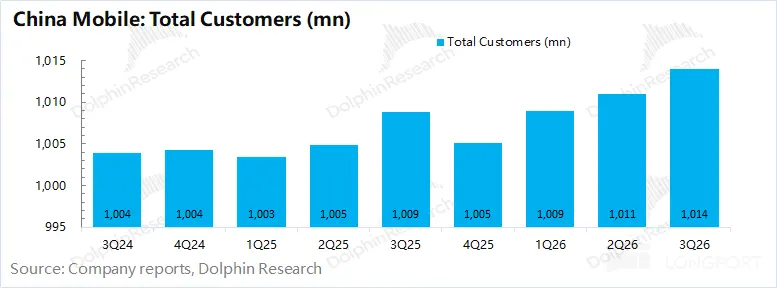
China Mobile: Total Customers (mn) 1,010 olphinResearch DolphinResearch Total Cu
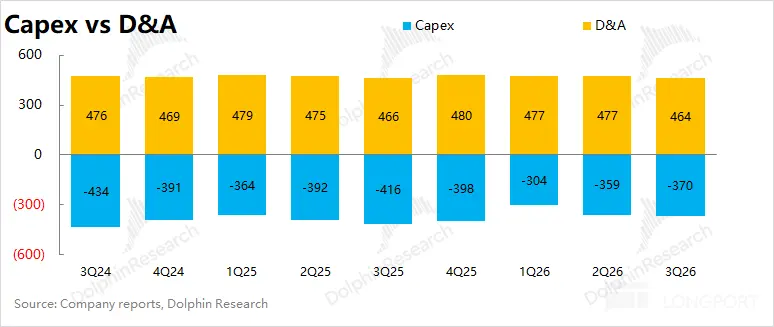
Capex vs D&A Capex D&A 600 arch earch 一 arch R 300 nR 476 469 479 475 466 480 47+8
D
Dolphin Research

NFLX: Soft guide dents confidence; can 'new leadership + peak season' reverse the slide?

$Netflix(NFLX.US) released its Q3 2026 results after-hours. The release hit in the early hours of Oct 21 Beijing time.

Heading into the print, sentiment was muted. In late Sep, the co-CEO said at the BBG Screentime conference that growth was 'too slow'. Layoffs announced last week and a shake-up with the Chief Content Officer stepping down further heightened growth uncertainty.

Even so, the print was weak. EPS posted a small beat, but off a low bar and aided by some timing mismatches between revenue and expenses. The upside was low quality...

hatNext?
NFLX Streaming Revenue $100mn 150 DolphinResearch 1 Total Streaming Revenues \ Y
Original Price Current Price Change District Currency Ads Basic Standard Premium
Netflix X Operatingl ng Margin and Expense Ratio 1C Operating margin Cost of rev+9
D
Dolphin Research

TSM: All Execution, No Hype — Can It Lead the Pack?

TSMC released its Q3 2026 results (quarter ended Sep 2026) before the U.S. market open on Oct 15, 2026 Beijing time.

Highlights follow.

Key takeaways: 1) Core focus areas for TSMC: a) as $Taiwan Semiconductor(TSM.US) discloses monthly revenue, GPM is the key metric. GPM was 66.4%, down 130bps QoQ, slightly below cons. at 66.8%.

By breakdown (converted to 12-inch equivalents). ① Per-wafer ASP was $10,438 per wafer...

tsmc
TSMC Gross Profit Composition(12"-equiv.Wafer) Gross Profit per Wafer Vari able
TSMC Capex 18.00 F 16.00 IphinResearch DolphinResear iResearch Capital Expenditu
TSMC Total Revenue 50.00 phineResearch DolphinResear Total Revenue(in US$ billio+8
D
Dolphin Research

MU: Without the AI melt-up, can LTAs sustain the memory supercycle?

Micron (MU) released its FY2026 Q4 results (quarter ended Aug 2026) after hours on Oct 1, 2026 Beijing time. Key points: 1) Overall performance:

$Micron Tech(MU.US) delivered revenue of $54.2bn this quarter (+31% QoQ). Growth slowed markedly vs. the 70%+ QoQ prints in the prior two quarters.

Revenue beat guidance by $8.0bn last quarter, but the beat narrowed to $4.0bn this quarter. Given that shipment volume is largely set when guidance is issued, the upside largely hinges on pricing...

Micron
Micron Technology Total Revenue (in mns/usc) DRAM NAND Others qoq% of total reve
% Sales Volume Change FQ4-26 Q/Q Increased in the mid-single digit DRAM percenta
Micron Technology Gross Profit (in mns/usd) Gross Profit Gross Profit Margin% 50+13
D
Dolphin Research

Reg crackdown settled: Can TCOM move forward unburdened?

On Sept 16, with $Trip.com(TCOM.US) releasing its Q2 results, the regulatory overhang finally cleared. The market's key uncertainty has been addressed.

Overall, the print was broadly in line with prior guidance. Absolute performance was soft, but there were no surprises vs. expectations.

As Dolphin Research noted last quarter, regardless of the print, with the largest uncertainty — regulation — resolved, Trip.com should have finished its final leg down. It can now shed the overhang and reset higher.

1) Regulatory and macro headwinds slowed revenue growth markedly. Group net revenue was approx. RMB 15.7bn this quarter...

Trip.comGroup 携程集团
200 Netrevenue -yoy 35% 180 29.4% 30% 160 23.4% 140 25% 20.8% 120 17.2% 20% 15.6
Trip( GAAP operating profit 60 Operating profmt1.6% OPM ch 27.8% 27.8% 30.4% 35%
Trip Non-GAAP operating profit Non-GAAP Op profit Non-GAAP OPM 70 一 25 ce 40% 34+4
D
Dolphin Research

ORCL: AI boosts the optics, but what backs the bottom line?

On Sep. 11 after the U.S. market close, leading cloud vendor Oracle ($Oracle(ORCL.US)) released FY27 Q1 results for the period ended Aug. Overall, it was a mixed print, with strengths very strong while weak spots stayed weak.

OCI drew the most attention with robust growth, revenue continuing to accelerate sharply, and Capex ramping significantly. Legacy businesses remained sluggish, GPM was under notable pressure, and those issues showed little improvement.

Specifically:

1) Core — OCI beat and accelerated. As the most critical segment, OCI revenue reached nearly 7.4 bn this quarter...

DRACLE
Oracle Cloud Service Rev. (SaaS +laaS) 13000 Cloud Application Cloud Infra. Clou
Oracle Capex xD Density Captial expenditures 0 c as % of rev xch C 0% -8% eo -11
Oracle Cash Flow 30,000 20,000 10,000 DolphinResear DolphinResear DolphinReseai +10